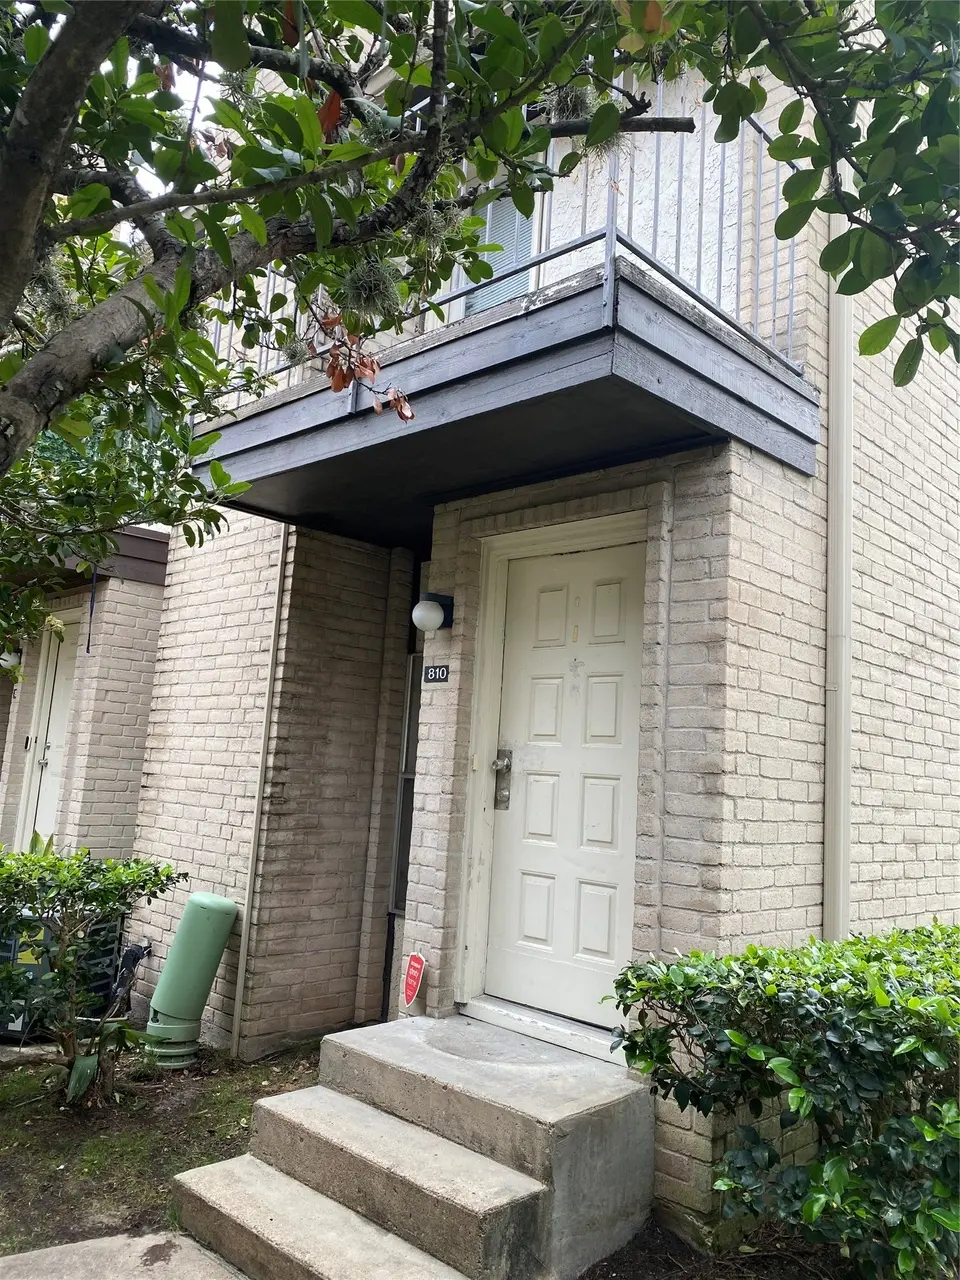
2021 Spenwick Dr #810 · Houston, TX
Flood risk 1/10 · Minimal
- FEMA flood zone
- X (unshaded)
- Chance of flooding over 30 yrs
- 0.0%
- Est. flood insurance / yr
- $507 – $1,088
Fire risk 1/10 · Minimal
- Est. fire insurance / yr
- $1,222 – $2,270
Heat risk 9/10 · Severe
- Hot days now (above 109°F)
- 7 days/yr
- Hot days in 30 yrs
- 24 days/yr
Wind risk 9/10 · Severe
- Chance of severe wind over 30 yrs
- 99.0%
Air-quality risk 3/10 · Minor
- Unhealthy air days now
- 3 days/yr
- Unhealthy air days in 30 yrs
- 3 days/yr
Risk factors via First Street. Map © Google.
Why this score? — see what drove the C- grade
The composite is a weighted blend of 9 inputs, each scored 0–100. Each bar is that input's sub-score; the figure is the points it added to the 100-point composite (weight × sub-score).
- Cash flow +15.0/30.0
- 1% rule +10.0/10.0
- ARV discount +7.5/15.0
- DSCR +4.6/10.0
- Schools +4.1/10.0
- Livability +3.7/5.0
- Rent growth +2.9/5.0
- Condition / age +2.5/5.0
- Appreciation +0.0/10.0
$72,000
🖨 Deal sheet 📄 Offer letter ✓ Due diligence
Listing remarks
Two story TH in well maintained complex in Spring Branch. Corner unit next to swimming pool, balcony, large living room and bedroom, walking closets. One assigned reserved covered parking and lot of uncovered parking. HOA fee covers insurance, ground, water, trash and sewer. Need some work and priced accordingly.
Key facts
- Walking closets
- Large living room
- Corner unit
Tags
Property features AI
Finance
- Other: Taxes listed for reference
- HOA & community: Managed by Creative Management; Monthly association fee of $285; HOA covers clubhouse, common areas, insurance, ground maintenance, structure maintenance, and trash
Exterior
- Utilities: Public water; Public sewer
- Home design: Residential property; 2 stories; Entry on slab foundation
- Construction: Built in 1982; Brick and cement siding exterior; Composition roof; Slab foundation
- Exterior features: Community pool; Gated community
Interior
- Kitchen: Dishwasher; Electric range; Microwave; Built-in oven; Garbage disposal
- Bedrooms: 3 total rooms (includes bedrooms and living areas)
- Bathrooms: 1 full bathroom; 1 half bathroom
- Heating & cooling: Central heating (electric); Central air conditioning (electric)
- Interior features: Wood-burning fireplace; Has heating and cooling
- Laundry & utility: Electric dryer hookup
Neighborhood map
What this means for you Summary
Snapshot
- This is a 1-bed/1.5-bath condo listed at $72k.
Deal economics
- At list price, monthly cash flow is $22 ($263/yr) — positive.
- The deal already cash-flows at list — no discount required.
- Meets the 1% rule at list price ($1k rent vs $72k).
- Recommended offer: $71k (1.5% below list) — sets the bar for market timing.
- Cap rate 6.7% vs local median 3.2% in Houston — top-decile yield for the area; either an underpriced asset or a hidden risk that comps aren't pricing in. Stress-test before assuming the spread holds.
Location & tenants
- Location reads 74/100 on livability (#184 in TX, #4,771 nationally) — a middle-class / working-renter tenant base. Strengths: amenities A+, cost of living A+, housing A+; Watch: crime F.
- Spring Branch ISD (urban): math 47% / reading 46% proficiency, ranked #215 of 826 in TX (top 26%) — families likely to look elsewhere, expect single-tenant / working-renter base with shorter leases.
- Zoned schools: Ridgecrest El (math 43% / reading 33%, grade F, #1,709 of 4,322 statewide, top 40%, 711 students, 94% FRL); Landrum Middle (math 22% / reading 31%, grade F, #1,200 of 1,662 statewide, top 73%, 967 students, 91% FRL); Northbrook H S (math 36% / reading 30%, grade F, #1,023 of 1,632 statewide, top 63%, 2,610 students, 85% FRL) — zoned schools average 90% FRL vs 54% district-wide (36 pts higher); higher-poverty schools than district average — tighter screening recommended.
- Zoned-school proficiency averages 32% at this address vs 46% district-wide (-14 pts) — the specific schools serving this property underperform the Spring Branch ISD average; the district grade overstates school quality for this exact location.
- Market conditions: Rents rising (+1.4%/yr); 441 active listings in the ZIP; 40 comparable units currently listed for rent nearby; rentals leasing fast (median 13d on market — plan ~1-2 weeks tenant-placement turnaround); 29,883 units permitted in Harris County in 2024 (8,621 in 5+ unit buildings).
Forward outlook
- Local home prices are declining (-3.0%/yr); year-one equity from $498 of loan paydown is wiped out by about $2k of value loss. Plan a longer hold.
- Harris County population projected at +47% by 2050 — long-run rental-demand tailwind backs the buy-and-hold thesis.
Negotiation context
- It's been on market 23 days — a 2% lower offer ($71k) is reasonable based on typical stale-listing flexibility.
Risks & watch-outs
- Watch-outs: property tax is 2.9% of price; HOA is 25% of rent.
- Climate carrying-cost: severe wind risk, 99% chance of damaging wind over 30y; extreme-heat days projected 7→24/yr by 2055 (HVAC capex compounding) — expect insurance premiums to compound above CPI over the hold.
Questions for the listing agent
- Property tax is high relative to price — has the assessment been appealed recently, and will the sale trigger a re-assessment?
- What does the HOA fee cover, when was the last increase, and are there any pending special assessments or reserve-fund shortfalls?
- Any open or pending special assessments — roof, HVAC, plumbing, elevator, façade? What's the per-unit balance and payoff schedule, and is the seller paying it off at close or rolling it to the buyer?
- Is there a deadline driving the sale (1031 exchange, divorce, estate, relocation)? That informs how much negotiation room exists.
- Schools are D-rated, which usually means shorter tenancies and higher turnover. Who's the typical renter profile here, and what's been the actual vacancy rate?
- Crime grade is F in this area — have there been break-ins, vandalism, or insurance claims at this property in the last 3 years? What carrier currently insures it and at what premium?
- What's the average days-on-market for RENTAL listings here right now (not sales)? A rising rental-DOM trend means longer vacancies and softer asking-rent achievability than the comps imply.
- What's the recent tenant-quality profile in this submarket — average credit score on applications, eviction rate, late-payment / NSF rate, and stable-employment percentage? A property-management company in the area should have these aggregated.
- How much new apartment / multifamily construction is in the pipeline within 1–3 miles? Heavy new supply (>2% of stock underway) typically softens rents 12–24 months out; light construction supports rent growth.
Investment metrics
- 1% rule
- 1.56% ✓
- Cap rate
- 6.66%
- Cash-on-cash
- 1.31%
- DSCR
- 1.06
- GRM
- 5.3
CMA / ARV
No comps found within radius.
Projected returns pro-forma
-3.0% appreciation · 1.41% rent growth · sell at horizon
- IRR
- -16.9%
- Equity multiple
- 0.41×
- Total profit
- $-11,798
- Equity at exit
- $10,735
- IRR
- -14.0%
- Equity multiple
- 0.28×
- Total profit
- $-14,526
- Equity at exit
- $6,225
Cash invested: $20,160 (down + closing). Projections, not guarantees.
Landlord ↔ Tenant lean methodology
- Overall (STATE)
- 87 Strongly Landlord-Friendly
- State Texas
- 87 Strongly Landlord-Friendly · R+5
- County
- — inherits STATE
- City
- — inherits STATE
ZIP-level market 77055
- Rents YoY
- 1.4%
- Active inventory
- 441
- Price-to-rent
- 5.3×
Monthly cashflow live
- Estimated rent
- $1,125 high interval (Pro) →
- Mortgage (P&I)
- −$378
- Tax from tax record
- −$174 /mo · $2,093/yr
- Insurance
- −$30
- HOA
- −$285
- Vacancy / Maint / Mgmt
- −$236
- Net cashflow
- $22
Break-even live
UW: 25.0% down · 7.5% · 30yr · 1.5% tax · 5.0% vac · 8.0% maint · 8.0% mgmt
Financing live
Cash to close
- Down payment
- $18,000
- Closing costs
- $2,160
- Reserves months
- —
- Total cash needed
- —
Loan-product check · same deal, 3 products live
Conventional
25% down · 7.5% · 30yr
- Down + closing
- —
- Monthly P&I
- —
- Monthly cashflow
- —
- DSCR
- —
- Eligible?
- —
Personal DTI + credit; lowest rate.
DSCR
20% down · 8.5% · 30yr
- Down + closing
- —
- Monthly P&I
- —
- Monthly cashflow
- —
- DSCR
- —
- Eligible?
- —
No personal income docs; deal must DSCR.
Hard money
10% down · 12.0% · 12mo
- Down + closing
- —
- Monthly P&I
- —
- Monthly cashflow
- —
- DSCR
- —
- Eligible?
- —
Short-term bridge; refi at stabilization.
Rent comps 40 comps
| Address | Beds | Baths | Sqft | Rent | $/sqft | DOM | Units | Dist |
|---|---|---|---|---|---|---|---|---|
| 2067 Spenwick Dr Houston, TX | 2.0 | 1.0 | 950 | $1,425 | $1.50 | 19d | 1 | 0.14mi |
| 1855 Wirt Rd Houston, TX | 3.0 | 1.0–2.0 | 954 | $1,067 | $1.12 | 2d | 76 | 0.35mi |
| 2010 Johanna Dr Houston, TX | 1.0–2.0 | 1.0 | 825 | $1,035 | $1.25 | 2d | 10 | 0.46mi |
| 2121 Pech Rd Houston, TX | 1.0–2.0 | 1.0–2.0 | 900 | $1,155 | $1.28 | 3d | 49 | 0.50mi |
| 1714 Wirt Rd Houston, TX | 2.0 | 1.0–2.0 | 625 | $1,045 | $1.67 | 3d | 1 | 0.58mi |
| 8515 Hammerly Blvd Unit 424 Houston, TX | 2.0 | 2.0 | 820 | $748 | $0.91 | 5d | 1 | 0.61mi |
| 8515 Hammerly Blvd Unit 1162 Houston, TX | 1.0 | 1.0 | 620 | $702 | $1.13 | 5d | 1 | 0.61mi |
| 8515 Hammerly Blvd Unit 8589 Houston, TX | 1.0 | 1.0 | 620 | $699 | $1.13 | 3d | 1 | 0.61mi |
| 8515 Hammerly Blvd Unit 8566 Houston, TX | 1.0 | 1.0 | 620 | $691 | $1.11 | 13d | 1 | 0.61mi |
| 8515 Hammerly Blvd Unit 8536 Houston, TX | 1.0 | 1.0 | 620 | $877 | $1.41 | 15d | 1 | 0.61mi |
| 8515 Hammerly Blvd Unit 2047 Houston, TX | 2.0 | 2.0 | 820 | $740 | $0.90 | 3d | 1 | 0.63mi |
| 8500 Hammerly Blvd Houston, TX | 1.0 | 1.0 | 720 | $1,378 | $1.91 | 17d | 1 | 0.68mi |
| 7556 Long Point Rd Houston, TX | 1.0 | 1.0 | 750 | $990 | $1.32 | 44d | 1 | 0.71mi |
| 7506 Highcrest Dr Houston, TX | 1.0 | 1.0 | 775 | $830 | $1.07 | 12d | 1 | 0.72mi |
| 7506 Highcrest Dr Houston, TX | 1.0 | 1.0 | 775 | $830 | $1.07 | 22d | 1 | 0.72mi |
| 7506 Highcrest Dr Houston, TX | 2.0 | 2.0 | 1100 | $1,040 | $0.95 | 20d | 1 | 0.72mi |
| 7506 Highcrest Dr Houston, TX | 2.0 | 2.0 | 1100 | $1,040 | $0.95 | 44d | 1 | 0.72mi |
| 1541 Moritz Dr Houston, TX | 1.0–2.0 | 1.0–2.0 | 775 | $995 | $1.28 | 1d | 8 | 0.74mi |
| 7550 Long Point Rd Houston, TX | 3.0 | 1.0–2.0 | 825 | $1,074 | $1.30 | 5d | 30 | 0.74mi |
| 1514 Wirt Rd Houston, TX | 2.0 | 1.0 | 1060 | $1,475 | $1.39 | 5d | 1 | 0.77mi |
| 1514 Wirt Rd Houston, TX | 2.0 | 1.0 | 1060 | $1,450 | $1.37 | 15d | 1 | 0.77mi |
| 1514 Wirt Rd Unit 4 Houston, TX | 2.0 | 1.0 | 1060 | $1,450 | $1.37 | 13d | 1 | 0.77mi |
| 2117 Thonig Rd Unit B Houston, TX | 1.0 | 1.0 | 750 | $795 | $1.06 | 5d | 1 | 0.78mi |
| 2308 Bingle Rd Houston, TX | 3.0 | 1.0–2.0 | 871 | $1,518 | $1.74 | 3d | 35 | 0.78mi |
| 1906 Thonig Rd Houston, TX | 1.0 | 1.0 | 640 | $680 | $1.06 | 24d | 1 | 0.80mi |
| 1906 Thonig Rd Houston, TX | 2.0 | 1.0 | 640 | $825 | $1.29 | 5d | 1 | 0.80mi |
| 1906 Thonig Rd Houston, TX | 1.0 | 1.0 | 640 | $680 | $1.06 | 44d | 1 | 0.80mi |
| 1742 Woodvine Dr Houston, TX | 2.0 | 1.0 | 875 | $1,480 | $1.69 | 21d | 1 | 0.80mi |
| 1742 Woodvine Dr Houston, TX | 2.0 | 1.0 | 875 | $1,480 | $1.69 | 22d | 1 | 0.80mi |
| 1742 Woodvine Dr Houston, TX | 3.0 | 1.0–2.0 | 715 | $1,142 | $1.60 | 14d | 10 | 0.80mi |
| 1508 Pech Rd Houston, TX | 1.0 | 1.0 | 618 | $1,025 | $1.66 | 21d | 1 | 0.81mi |
| 1508 Pech Rd Houston, TX | 1.0 | 1.0 | 618 | $1,025 | $1.66 | 44d | 1 | 0.81mi |
| 1508 Pech Rd Houston, TX | 2.0 | 1.0 | 912 | $1,289 | $1.41 | 24d | 1 | 0.81mi |
| 8000 W Tidwell Rd Houston, TX | 1.0–2.0 | 1.0–2.0 | 782 | $816 | $1.04 | 2d | 54 | 0.83mi |
| 1502 Pech Rd Houston, TX | 2.0 | 1.0–2.0 | 961 | $1,310 | $1.36 | 3d | 3 | 0.83mi |
| 8701 Hammerly Blvd Houston, TX | 3.0 | 1.0–2.0 | 843 | $1,131 | $1.34 | 5d | 55 | 0.84mi |
| 7429 Long Point Rd Houston, TX | 1.0 | 1.0 | 620 | $949 | $1.53 | 4d | 1 | 0.88mi |
| 7429 Long Point Rd Unit 710 Houston, TX | 2.0 | 1.0 | 840 | $1,249 | $1.49 | 24d | 1 | 0.88mi |
| 7429 Long Point Rd Unit 106 Houston, TX | 1.0 | 1.0 | 670 | $949 | $1.42 | 24d | 1 | 0.88mi |
| 7429 Long Point Rd Unit 205 Houston, TX | 1.0 | 1.0 | 670 | $999 | $1.49 | 4d | 1 | 0.88mi |
HOA detail condo
- Monthly dues
- $285 · $3,420/yr
- Likely covers
- watersewertrashpool
- Assessments
- None detected in remarks — confirm with the listing agent.
Listing history 5 events
-
2026-06-01days on market $72,000 Pending 23 DOM
-
2026-05-31days on market $72,000 Pending 22 DOM
-
2026-05-09$72,000 Active 317-char remark
-
2006-04-24soldstatus
-
1995-08-29soldstatus
ⓘ Source: listings_history table (triggers on properties + properties_extension) + one-shot
backfill from property_details.listing_events for pre-trigger history.
Tax reassessment forecast TX · Resets to sale price
- Current annual tax
- $2,093 · $174/mo
- Projected year-2 tax
- $2,093 · $174/mo
- Expected delta
- $0/yr ($0/mo · 0.0%)
ⓘ Screening estimate from a state-policy table — verify with the county assessor before closing.
Climate risk First Street
- Flood 1/10 Low FEMA zone X (unshaded) · 0% chance over 30 yrs
- Wildfire 1/10 Low
- Heat 9/10 Extreme 7 d/yr ≥109°F today · 24 d/yr by 30 yrs out
- Wind 9/10 Extreme 99% chance of damaging wind over 30 yrs
- Air quality 3/10 Moderate 3 unhealthy d/yr today · 3 by 30 yrs out
Nearby sold comps map
Loading sold comps map…
Walkable amenities ~0.75 mi
Loading nearby amenities…
Taxation est. · year 1
- Rental income
- $13,503
- − Mortgage interest
- −$4,033
- − Property taxes
- −$2,093
- − Insurance
- −$360
- − Repairs & maintenance
- −$1,080
- − Management
- −$1,080
- − HOA
- −$3,420
- − Depreciation
- −$2,095
- Taxable loss
- −$658
- Est. tax savings @ 24.0%
- +$158
- After-tax cash flow
- $421/yr
For passive investors: Depreciation is non-cash, so a rental often shows a tax loss while cash-flowing — sheltering income. Rental losses are passive: they offset passive income freely, and up to $25,000/yr can offset ordinary (W-2) income if you actively participate and your MAGI is under $100k (phasing out to $0 by $150k); unused losses carry forward. On sale, claimed depreciation is recaptured at up to 25%, and gains may owe capital-gains tax (a 1031 exchange can defer both). Figures are a year-1 estimate at your 24.0% rate — not tax advice; consult a CPA.
Schools (NCES district)
- District
- Spring Branch ISD
- NCES district ID
- 4841100
- Math proficiency
- 47% ▼ -4.00%
- Reading proficiency
- 46% ▼ -1.00%
- Median HH income
- $60,311
- Composite
- 40.88/100
- National rank
- #3624
- State rank
- #215 of 826 in TX
Livability — Houston
- Score
- 74/100
- State rank
- #184
- US rank
- #4771
Category grades
Schools grade is shown separately in the Schools card above.
Census & demographics
- Census place
- Houston, TX
- County
- Harris County · 4,702,590 people
- City population
- 3,226,434
- Metro
- Houston-The Woodlands-Sugar Land, TX
- Population (ZIP)
- 45,435
- Household income
- $74,369
- Rent vs Own
- Severe rent burden
- 2571.0
Population outlook (Harris County) Hauer SSP2
- Today (2025)
- 5,571,493 people
- By 2030
- 6,089,821 · +9.3%
- By 2040
- 7,142,806 · +28.2%
- By 2050
- 8,185,864 · +46.9%
- By 2075
- 10,574,329 · +89.8%
- By 2100
- 12,109,958 · +117.4%
Race, ethnicity, and origin ACS 2023
- Neighborhood character
- Diverse neighborhood (Simpson 0.61)
- Race & ethnicity
- Hispanic / Latino 53% White 33% Two or more races 18% Asian 6% Black 5% Native American 2%
- Hispanic origin (detail)
- Mexican 32%
- Common ancestry
- Lithuanian 2% Italian 1% Serbian 1%
- Foreign-born
- 34% · Canada, China, Vietnam
- Languages at home
- 46% English-only · Spanish 45% Chinese 2% Arabic 2%
Political lean MEDSL · Harris
- 2024 margin
- Lean D (+5.5) · D 52.0% · R 46.4% · Other 1.6%
- 2008→2024 swing
- +3.9pp toward D · 2008: 1.6pp · 2024: 5.5pp
- All cycles
- 2024: D+5.5 2020: D+13.3 2016: D+12.4 2012: D+0.1 2008: D+1.6
Not yet ingested
- Civics
- —
Market trends
- HPI YoY
- ▼ -488.83%
- Current HPI
- 251.807
- Rent YoY
- ▲ 1.41%
- Metro
- Houston-The Woodlands-Sugar Land, TX
- State GDP YoY
- ▲ 3.95%
- F500 in state
- 110
Industry mix (Fortune 500 HQ in TX)
| Industry | F500 HQs | Revenue |
|---|---|---|
| Energy | 16 | $1,198B |
|
||
| Technology | 5 | $198B |
|
||
| Engineering / Construction | 4 | $72B |
|
||
| Energy Services | 3 | $60B |
|
||
| Utilities | 3 | $41B |
|
||
| Healthcare | 2 | $330B |
|
||
Price history
6 events — show timeline
- 2026-06-12 Sold (MLS) — HARMLS
- 2026-06-02 Pending — HARMLS
- 2026-05-26 Pending — HARMLS
- 2026-05-09 Listed $72,000 HARMLS
- 2006-04-24 Sold (Public Records) — Public Records
- 1995-08-29 Sold (Public Records) — Public Records
Property tax history
+8.5%/yrLatest (2025): $2,093 · +2.1% YoY. Source: county tax records.
Cash-flow waterfall
monthlySold comps — $/sqft
last 12 mo · ≤1 miLoading sold comps…