 Duplex
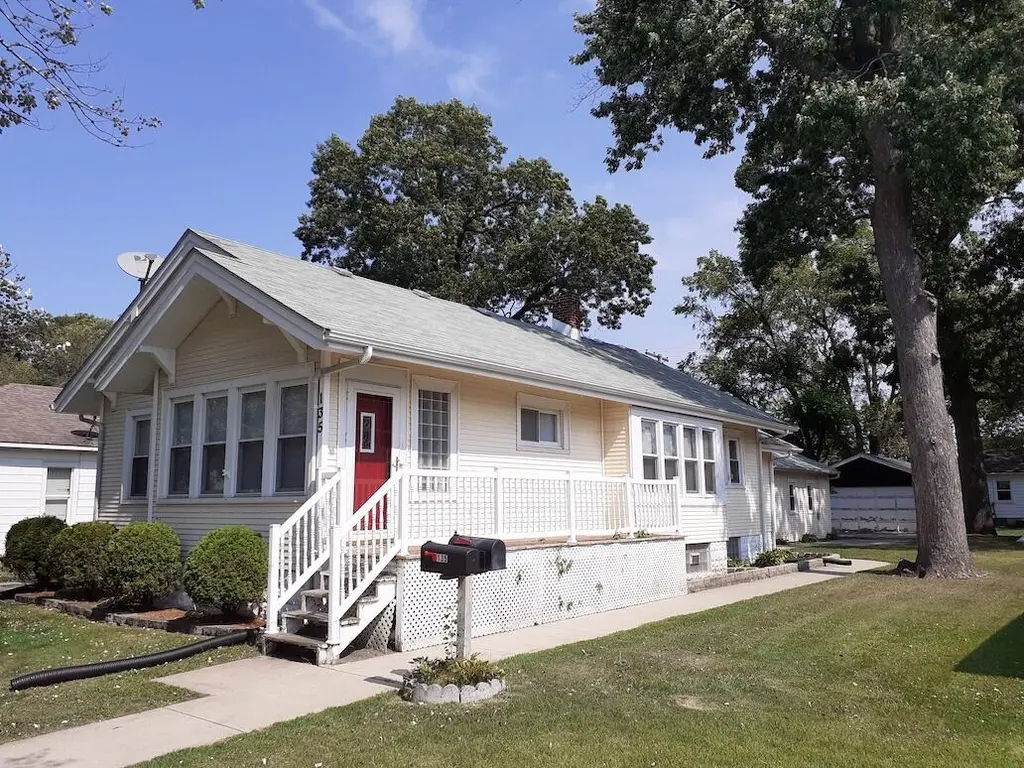
135 N Lindberg St · Griffith, IN
Flood risk 1/10 · Minimal
- FEMA flood zone
- X (unshaded)
- Chance of flooding over 30 yrs
- 0.0%
- Est. flood insurance / yr
- $473 – $860
Fire risk 1/10 · Minimal
- Est. fire insurance / yr
- $717 – $1,331
Heat risk 3/10 · Minor
- Hot days now (above 103°F)
- 7 days/yr
- Hot days in 30 yrs
- 15 days/yr
Wind risk 2/10 · Minimal
- Chance of severe wind over 30 yrs
- 1.0%
Air-quality risk 3/10 · Minor
- Unhealthy air days now
- 2 days/yr
- Unhealthy air days in 30 yrs
- 3 days/yr
Risk factors via First Street. Map © Google.
Why this score? — see what drove the D+ grade
The composite is a weighted blend of 9 inputs, each scored 0–100. Each bar is that input's sub-score; the figure is the points it added to the 100-point composite (weight × sub-score).
- Cash flow +15.8/30.0
- ARV discount +7.5/15.0
- 1% rule +5.3/10.0
- DSCR +4.9/10.0
- Livability +3.5/5.0
- Schools +3.0/10.0
- Rent growth +2.5/5.0
- Condition / age +2.5/5.0
- Appreciation +0.0/10.0
$265,000
🖨 Deal sheet 📄 Offer letter ✓ Due diligence
Multi-family units
County records classify this as Multi-Family (2-4 Unit). Listing-text estimate: 2 units. confirmed
Listing remarks MLS
Best deal you will ever find in your whole entire life! Two HOUSES both for ONE PRICE of $69,900. First home is a 3 bed 1 bath on a full finished basement. The second home is a 1 bed 1 bath on a slab! Clean, tasteful updates and lots of new features! Homes are right downtown close to Main st with award winning schools and walk anywhere want. Jump on them now before the investors are all over them! #flip #live #rent #griffith #downtown #pricedTOfly #NWI #Griffith
Key facts
- 3 bedroom unit
- Vacant rear studio
- 7,884 sq ft lot
Tags
Property features AI
Exterior
- Parking: Driveway; On-street parking
- Utilities: Electricity connected; Public water; Public sewer; Natural gas connected
- Home design: Built in 1923; One level
- Construction: Partially finished basement
- Exterior features: Front porch; Rain gutters; Neighborhood view; No pool
Interior
- Kitchen: Appliances: Other
- Bedrooms: Multi-unit property with 2 total units (includes efficiencies and a three-bedroom unit)
- Flooring: Tile flooring; Vinyl flooring
- Bathrooms: 2 full bathrooms
- Heating & cooling: Hot water heating; Ceiling fan cooling
- Interior features: Ceiling fans
- Laundry & utility: Washer hookup; Gas dryer hookup; Laundry sink
Neighborhood map
What this means for you Summary
Snapshot
- This is a 2 × 3-bed/1.0-bath units multifamily listed at $265k.
Deal economics
- At list price, monthly cash flow is $120 ($1k/yr) — positive. Per door: $60/mo.
- The deal already cash-flows at list — no discount required.
- Meets the 1% rule at list price ($3k rent vs $265k).
- Recommended offer: $261k (1.5% below list) — sets the bar for market timing.
- Cap rate 6.8% vs local median 4.9% in Griffith — top-decile yield for the area; either an underpriced asset or a hidden risk that comps aren't pricing in. Stress-test before assuming the spread holds.
Location & tenants
- Location reads 70/100 on livability (#146 in IN) — a middle-class / working-renter tenant base. Strengths: cost of living A+, housing A+, crime A; Watch: amenities F, commute F, health & safety F.
- Griffith Public Schools (suburban): math 31% / reading 38% proficiency, ranked #189 of 301 in IN (top 63%) — families likely to look elsewhere, expect single-tenant / working-renter base with shorter leases.
- Zoned schools: Griffth Jr/Sr High School (math 32% / reading 62%, grade D-, #143 of 369 statewide, top 44%, 1,059 students, 55% FRL).
- Zoned-school proficiency averages 47% at this address vs 34% district-wide (+12 pts) — the actual schools serving this property are materially stronger than the Griffith Public Schools average implies; a family-tenant draw the district grade alone would hide.
- Market conditions: 66 active listings in the ZIP; 7 comparable units currently listed for rent nearby; rentals leasing fast (median 8d on market — plan ~1-2 weeks tenant-placement turnaround); 1,642 units permitted in Lake County in 2024 (14 in 5+ unit buildings).
- This rent runs 44% of the median local income ($75k/yr) — at the standard rent-burdened threshold; future hikes will face affordability resistance.
Forward outlook
- Local home prices are declining (-3.0%/yr); year-one equity from $2k of loan paydown is wiped out by about $8k of value loss. Plan a longer hold.
- Lake County population projected to shrink 7% by 2050 — rents likely to lag national; underwrite the cash flow, not the appreciation.
Negotiation context
- It's been on market 16 days — a 2% lower offer ($261k) is reasonable based on typical stale-listing flexibility.
- 2 sale attempts since 10y ago with the ask held roughly flat each time — persistent listings suggest the price (not the market) is what's stuck; bring a comps-based counter.
- Current owner paid $64k; list at $265k implies a 314% gain — meaningful room to come down on a strong offer.
Risks & watch-outs
- Watch-outs: built in 1923 — expect roof / HVAC / electrical / plumbing capex.
Questions for the listing agent
- Can we see the unit-by-unit rent roll, current vacancy, and any below-market leases? What's the average tenancy length?
- What capital expenditures (roof, boiler, parking lot, exteriors) have been made in the last 5 years, and what's planned in the next 2?
- Built in 1923 — when were the roof, HVAC, electrical panel, plumbing, and water heater last replaced?
- Is there a deadline driving the sale (1031 exchange, divorce, estate, relocation)? That informs how much negotiation room exists.
- The area grade is low — what's the realistic commute time and amenity access for the typical tenant pool here? Any planned neighborhood developments (good or bad) we should know about?
- What's the average days-on-market for RENTAL listings here right now (not sales)? A rising rental-DOM trend means longer vacancies and softer asking-rent achievability than the comps imply.
- What's the recent tenant-quality profile in this submarket — average credit score on applications, eviction rate, late-payment / NSF rate, and stable-employment percentage? A property-management company in the area should have these aggregated.
- How much new apartment / multifamily construction is in the pipeline within 1–3 miles? Heavy new supply (>2% of stock underway) typically softens rents 12–24 months out; light construction supports rent growth.
Investment metrics
- 1% rule
- 1.03% ✓
- Cap rate
- 6.84%
- Cash-on-cash
- 1.94%
- DSCR
- 1.09
- GRM
- 8.1
CMA / ARV
No comps found within radius.
Projected returns pro-forma
-3.0% appreciation · 3.0% rent growth · sell at horizon
- IRR
- -13.1%
- Equity multiple
- 0.53×
- Total profit
- $-35,118
- Equity at exit
- $39,512
- IRR
- -4.1%
- Equity multiple
- 0.73×
- Total profit
- $-20,033
- Equity at exit
- $22,912
Cash invested: $74,200 (down + closing). Projections, not guarantees.
Landlord ↔ Tenant lean methodology
- Overall (STATE)
- 90 Strongly Landlord-Friendly
- State Indiana
- 90 Strongly Landlord-Friendly · R+11
- County
- — inherits STATE
- City
- — inherits STATE
ZIP-level market 46319
- Home prices YoY
- -25.5%
- Active inventory
- 66
- Price-to-rent
- 16.1×
Monthly cashflow live
- Estimated rent
- $2,737 medium interval (Pro) →
- Mortgage (P&I)
- −$1,390
- Tax from tax record
- −$542 /mo · $6,504/yr
- Insurance
- −$110
- HOA
- −$0
- Vacancy / Maint / Mgmt
- −$575
- Net cashflow
- $120
Break-even live
2-unit breakdown (identical units grouped — click to expand)
| Units | Beds | Baths | Est. rent |
|---|---|---|---|
| 2× units | 3 | 1 | $2,736 |
| #1 | 3 | 1 | $1,368 |
| #2 | 3 | 1 | $1,368 |
| Total (2 units) | $2,737 | ||
UW: 25.0% down · 7.5% · 30yr · 1.5% tax · 5.0% vac · 8.0% maint · 8.0% mgmt
Financing live
Cash to close
- Down payment
- $66,250
- Closing costs
- $7,950
- Reserves months
- —
- Total cash needed
- —
Loan-product check · same deal, 3 products live
Conventional
25% down · 7.5% · 30yr
- Down + closing
- —
- Monthly P&I
- —
- Monthly cashflow
- —
- DSCR
- —
- Eligible?
- —
Personal DTI + credit; lowest rate.
DSCR
20% down · 8.5% · 30yr
- Down + closing
- —
- Monthly P&I
- —
- Monthly cashflow
- —
- DSCR
- —
- Eligible?
- —
No personal income docs; deal must DSCR.
Hard money
10% down · 12.0% · 12mo
- Down + closing
- —
- Monthly P&I
- —
- Monthly cashflow
- —
- DSCR
- —
- Eligible?
- —
Short-term bridge; refi at stabilization.
Rent comps 7 comps
| Address | Beds | Baths | Sqft | Rent | $/sqft | DOM | Units | Dist |
|---|---|---|---|---|---|---|---|---|
| 420 N Broad St Unit 1 Griffith, IN | 2.0 | 1.0 | 825 | $1,295 | $1.57 | 1d | 1 | 0.42mi |
| 422 N Dwiggins St Griffith, IN | 2.0 | 1.0 | 1135 | $1,650 | $1.45 | 24d | 1 | 0.73mi |
| 329 N Jay St Griffith, IN | 2.0 | 1.0 | 832 | $1,450 | $1.74 | 12d | 1 | 0.77mi |
| 632 N Elmer St Apt C Griffith, IN 46319 Griffith, IN | 2.0 | 1.0 | 870 | $1,300 | $1.49 | 7d | 1 | 0.82mi |
| 9616 Farmer Dr Highland, IN | 2.0 | 1.0 | 960 | $1,516 | $1.58 | 1d | 1 | 1.22mi |
| 9616 Farmer Dr Highland, IN | 2.0 | 1.0 | 960 | $1,629 | $1.70 | 17d | 1 | 1.22mi |
| 820 N Wheeler St Griffith, IN | 1.0–2.0 | 1.0 | 870 | $1,400 | $1.61 | 1d | 1 | 1.29mi |
Listing history 12 events
-
2026-06-18days on market $265,000 Active 16 DOM
-
2026-06-17days on market $265,000 Active 15 DOM
-
2026-06-16days on market $265,000 Active 14 DOM
-
2026-06-15days on market $265,000 Active 13 DOM
-
2026-06-13days on market $265,000 Active 11 DOM
-
2026-06-13days on market $265,000 Active 10 DOM
-
2026-06-09days on market $265,000 Active 7 DOM
-
2026-06-08days on market $265,000 Active 6 DOM
-
2026-06-07days on market $265,000 Active 5 DOM
-
2026-06-04days on market $265,000 Active 2 DOM
-
2026-06-02remarks 529-char remark
-
2026-06-02$265,000 Active 1 DOM
ⓘ Source: listings_history table (triggers on properties + properties_extension) + one-shot
backfill from property_details.listing_events for pre-trigger history.
Tax reassessment forecast IN · Partial reset (capped growth)
- Current annual tax
- $6,504 · $542/mo
- Projected year-2 tax
- $6,504 · $542/mo
- Expected delta
- $0/yr ($0/mo · 0.0%)
ⓘ Screening estimate from a state-policy table — verify with the county assessor before closing.
Climate risk First Street
- Flood 1/10 Low FEMA zone X (unshaded) · 0% chance over 30 yrs
- Wildfire 1/10 Low
- Heat 3/10 Moderate 7 d/yr ≥103°F today · 15 d/yr by 30 yrs out
- Wind 2/10 Low 100% chance of damaging wind over 30 yrs
- Air quality 3/10 Moderate 2 unhealthy d/yr today · 3 by 30 yrs out
Nearby sold comps map
Loading sold comps map…
Walkable amenities ~0.75 mi
Loading nearby amenities…
Taxation est. · year 1
- Rental income
- $32,844
- − Mortgage interest
- −$14,844
- − Property taxes
- −$6,504
- − Insurance
- −$1,325
- − Repairs & maintenance
- −$2,628
- − Management
- −$2,628
- − Depreciation
- −$7,709
- Taxable loss
- −$2,793
- Est. tax savings @ 24.0%
- +$670
- After-tax cash flow
- $2,112/yr
For passive investors: Depreciation is non-cash, so a rental often shows a tax loss while cash-flowing — sheltering income. Rental losses are passive: they offset passive income freely, and up to $25,000/yr can offset ordinary (W-2) income if you actively participate and your MAGI is under $100k (phasing out to $0 by $150k); unused losses carry forward. On sale, claimed depreciation is recaptured at up to 25%, and gains may owe capital-gains tax (a 1031 exchange can defer both). Figures are a year-1 estimate at your 24.0% rate — not tax advice; consult a CPA.
Schools (NCES district)
- District
- Griffith Public Schools
- NCES district ID
- 1804170
- Math proficiency
- 31% ▼ -15.00%
- Reading proficiency
- 38% ▼ -5.00%
- Median HH income
- $54,808
- Composite
- 30.37/100
- National rank
- #6254
- State rank
- #189 of 301 in IN
Livability — Griffith
- Score
- 70/100
- State rank
- #146
- US rank
- #7400
Category grades
Schools grade is shown separately in the Schools card above.
Census & demographics
- Census place
- Griffith, IN
- County
- Lake County · 422,878 people
- City population
- 17,847
- Metro
- Chicago-Naperville-Elgin, IL-IN-WI
- Population (ZIP)
- 17,847
- Household income
- $74,662
- Rent vs Own
- Severe rent burden
- 504.0
Population outlook (Lake County) Hauer SSP2
- Today (2025)
- 484,026 people
- By 2030
- 478,091 · -1.2%
- By 2040
- 462,974 · -4.3%
- By 2050
- 449,894 · -7.1%
- By 2075
- 436,169 · -9.9%
- By 2100
- 426,607 · -11.9%
Race, ethnicity, and origin ACS 2023
- Neighborhood character
- Majority White (64%)
- Race & ethnicity
- White 64% Hispanic / Latino 17% Black 13% Two or more races 12% Asian 2%
- Hispanic origin (detail)
- Mexican 14% Puerto Rican 1%
- Common ancestry
- Romanian 14% Iranian 4% Lithuanian 2%
- Foreign-born
- 6% · Canada, Philippines, China
- Languages at home
- 88% English-only · Spanish 9% Russian/Polish/Slavic 1% Other Asian/Pacific 1%
Political lean MEDSL · Lake
- 2024 margin
- Lean D (+5.6) · D 52.1% · R 46.5% · Other 1.5%
- 2008→2024 swing
- -28.6pp toward R · 2008: 34.3pp · 2024: 5.6pp
- All cycles
- 2024: D+5.6 2020: D+15.1 2016: D+20.6 2012: D+31.0 2008: D+34.3
Not yet ingested
- Civics
- —
Market trends
- HPI YoY
- ▼ -95.17%
- Current HPI
- 278.3139
- Rent YoY
- —
- Metro
- Chicago-Naperville-Elgin, IL-IN-WI
- State GDP YoY
- ▲ 2.90%
- F500 in state
- 18
Industry mix (Fortune 500 HQ in IN)
| Industry | F500 HQs | Revenue |
|---|---|---|
| Industrial Machinery | 2 | $37B |
|
||
| Healthcare | 1 | $177B |
|
||
| Pharmaceuticals | 1 | $45B |
|
||
| Metals / Steel | 1 | $18B |
|
||
| Agriculture | 1 | $17B |
|
||
| Packaging | 1 | $12B |
|
||
Price history
+279.1% since first listed3 events — show timeline
- 2026-06-02 Listed $265,000 NIRA MLS as Distributed by MLS Grid
- 2016-08-12 Sold (MLS) $64,000 NIRA MLS as Distributed by MLS Grid
- 2016-05-13 Listed $69,900 NIRA MLS as Distributed by MLS Grid
Property tax history
+12.2%/yrLatest (2024): $6,504 · +4.6% YoY. Source: county tax records.
Cash-flow waterfall
monthlySold comps — $/sqft
last 12 mo · ≤1 miLoading sold comps…