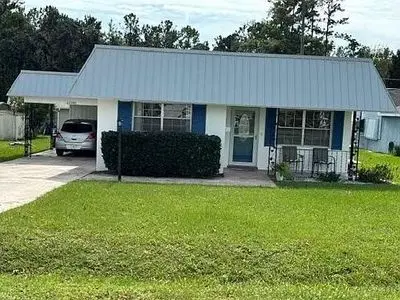
22280 Victory Dr · South Brooksville, FL
Flood risk 1/10 · Minimal
- FEMA flood zone
- X (unshaded)
- Chance of flooding over 30 yrs
- 0.0%
- Est. flood insurance / yr
- $507 – $1,088
Fire risk 7/10 · Major
- Est. fire insurance / yr
- $947 – $1,759
Heat risk 10/10 · Severe
- Hot days now (above 109°F)
- 7 days/yr
- Hot days in 30 yrs
- 27 days/yr
Wind risk 9/10 · Severe
- Chance of severe wind over 30 yrs
- 99.0%
Air-quality risk 2/10 · Minimal
- Unhealthy air days now
- 1 days/yr
- Unhealthy air days in 30 yrs
- 1 days/yr
Risk factors via First Street. Map © Google.
Why this score? — see what drove the C grade
The composite is a weighted blend of 9 inputs, each scored 0–100. Each bar is that input's sub-score; the figure is the points it added to the 100-point composite (weight × sub-score).
- Cash flow +24.6/30.0
- DSCR +8.0/10.0
- 1% rule +6.6/10.0
- ARV discount +6.2/15.0
- Schools +4.2/10.0
- Livability +3.4/5.0
- Rent growth +2.5/5.0
- Condition / age +2.5/5.0
- Appreciation +0.0/10.0
$115,000
🖨 Deal sheet (PDF) 📄 Offer letter ✓ Due diligence
Listing remarks
Welcome to 22280 Victory Dr & acirc; & euro; & ldquo; a rare opportunity to own a home in the highly desirable Wesleyan community of Brooksville. This well-maintained home offers a peaceful setting with strong community values, making it ideal for buyers seeking both comfort and connection. ? Key Features: 2 bedrooms / 2 bathrooms 997 sq ft of living space Bright, open living areas Quiet, established neighborhood ?? Community Highlights: Located within a respected Wesleyan community Serene environment with a strong sense of community Convenient access to Brooksville amenities, shopping, and major routes ?? Location: Situated in Brooksville, Florida, offering a blend of sma
Key facts
- Built 1988
- Listed 40 days
Neighborhood map
What this means for you Summary
Snapshot
- This is a 2-bed/2.0-bath single-family listed at $115k.
Deal economics
- At list price, monthly cash flow is $239 ($3k/yr) — positive.
- The deal already cash-flows at list — no discount required.
- Meets the 1% rule at list price ($1k rent vs $115k).
- Recommended offer: $112k (3.0% below list) — sets the bar for market timing.
- Cap rate 8.8% vs local median 2.9% in South Brooksville — top-decile yield for the area; either an underpriced asset or a hidden risk that comps aren't pricing in. Stress-test before assuming the spread holds.
Location & tenants
- Location reads 67/100 on livability (#584 in FL) — a middle-class / working-renter tenant base. Strengths: cost of living A+, health & safety A+; Watch: amenities F, commute F.
- Hernando (suburban): math 50% / reading 50% proficiency, ranked #38 of 73 in FL (top 52%) — acceptable for families but not a draw, mixed tenant base, ~2y average lease.
- Zoned schools: Moton Elementary School (math 46% / reading 39%, grade F, #1,383 of 2,144 statewide, top 65%, 679 students, 79% FRL); D. S. Parrott Middle School (math 40% / reading 40%, grade F, #368 of 571 statewide, top 65%, 835 students, 67% FRL) — zoned schools average 73% FRL vs 55% district-wide (18 pts higher); higher-poverty schools than district average — tighter screening recommended.
- Market conditions: Rents flat; 498 active listings in the ZIP; 11 comparable units currently listed for rent nearby; rentals at typical pace (median 14d on market — plan ~3-4 weeks tenant-placement turnaround); 2,505 units permitted in Hernando County in 2024 (318 in 5+ unit buildings).
Forward outlook
- Local home prices are declining (-3.0%/yr); year-one equity from $795 of loan paydown is wiped out by about $3k of value loss. Plan a longer hold.
- Hernando County population projected at +11% by 2050 — modest demand growth; plan on rents tracking national, not racing it.
Negotiation context
- It's been on market 40 days — a 3% lower offer ($112k) is reasonable based on typical stale-listing flexibility.
- Current owner paid $75k; list at $115k implies a 53% gain — meaningful room to come down on a strong offer.
Risks & watch-outs
- Climate carrying-cost: severe wind risk, 99% chance of damaging wind over 30y; major wildfire risk; extreme-heat days projected 7→27/yr by 2055 (HVAC capex compounding) — expect insurance premiums to compound above CPI over the hold.
Questions for the listing agent
- It's been on market 40 days. Have you received any prior offers? Is the seller open to a 3% concession, seller financing, or rate buy-down credit?
- Is there a deadline driving the sale (1031 exchange, divorce, estate, relocation)? That informs how much negotiation room exists.
- Schools are D-rated, which usually means shorter tenancies and higher turnover. Who's the typical renter profile here, and what's been the actual vacancy rate?
- What's the average days-on-market for RENTAL listings here right now (not sales)? A rising rental-DOM trend means longer vacancies and softer asking-rent achievability than the comps imply.
- What's the recent tenant-quality profile in this submarket — average credit score on applications, eviction rate, late-payment / NSF rate, and stable-employment percentage? A property-management company in the area should have these aggregated.
- How much new for-sale + rental construction is in the pipeline within 1–3 miles? Heavy new supply typically softens prices + rents 12–24 months out; constrained supply supports both.
Investment metrics
- 1% rule
- 1.16% ✓
- Cap rate
- 8.78%
- Cash-on-cash
- 8.90%
- DSCR
- 1.40
- GRM
- 7.2
CMA / ARV
- ARV (on-the-fly)
- $111,664
- Comps found
- 3
Show comp detail 3 sales within ~0.75 mi
| Address | Dist | Beds/Ba | Sqft | Sold | Price | $/sf | Match |
|---|---|---|---|---|---|---|---|
| 11 Kings Cir | 0.65mi | 3/1.0 (+1) | 980 (-2%) | 0mo | $78,000 | $80 | 58 |
| 900 Wood Dr | 0.63mi | 3/1.0 (+1) | 980 (-2%) | 14mo | $110,000 | $112 | 47 |
| 7 Kings Cir | 0.66mi | 3/2.0 (+1) | 1,034 (+4%) | 17mo | $204,000 | $197 | 44 |
Match score weights: distance 35% · size 25% · config 20% · recency 20%. Top-matched comps best support the ARV.
Projected returns pro-forma
-3.0% appreciation · 0.19% rent growth · sell at horizon
- IRR
- -6.1%
- Equity multiple
- 0.78×
- Total profit
- $-7,056
- Equity at exit
- $17,147
- IRR
- -0.3%
- Equity multiple
- 0.98×
- Total profit
- $-637
- Equity at exit
- $9,943
Cash invested: $32,200 (down + closing). Projections, not guarantees.
Landlord ↔ Tenant lean methodology
- Overall (STATE)
- 87 Strongly Landlord-Friendly
- State Florida
- 87 Strongly Landlord-Friendly · R+3
- County
- — inherits STATE
- City
- — inherits STATE
ZIP-level market 34601
- Home prices YoY
- -29.7%
- Rents YoY
- 0.2%
- Active inventory
- 498
- Price-to-rent
- 7.2×
Monthly cashflow live
- Estimated rent
- $1,331 high interval (Pro) →
- Mortgage (P&I)
- −$603
- Tax from tax record
- −$162 /mo · $1,944/yr
- Insurance
- −$48
- HOA
- −$0
- Vacancy / Maint / Mgmt
- −$280
- Net cashflow
- $239
Break-even live
Sensitivity live
| Price | -10% $304 | -5% $271 | +0% $239 | +5% $206 | +10% $174 |
|---|---|---|---|---|---|
| Rent | -10% $134 | -5% $186 | +0% $239 | +5% $291 | +10% $344 |
| Rate | -1.0pp $297 | -0.5pp $268 | base $239 | +0.5pp $209 | +1.0pp $179 |
UW: 25.0% down · 7.5% · 30yr · 1.5% tax · 5.0% vac · 8.0% maint · 8.0% mgmt
Financing live
Cash to close
- Down payment
- $28,750
- Closing costs
- $3,450
- Reserves months
- —
- Total cash needed
- —
Loan-product check · same deal, 3 products live
Conventional
25% down · 7.5% · 30yr
- Down + closing
- —
- Monthly P&I
- —
- Monthly cashflow
- —
- DSCR
- —
- Eligible?
- —
Personal DTI + credit; lowest rate.
DSCR
20% down · 8.5% · 30yr
- Down + closing
- —
- Monthly P&I
- —
- Monthly cashflow
- —
- DSCR
- —
- Eligible?
- —
No personal income docs; deal must DSCR.
Hard money
10% down · 12.0% · 12mo
- Down + closing
- —
- Monthly P&I
- —
- Monthly cashflow
- —
- DSCR
- —
- Eligible?
- —
Short-term bridge; refi at stabilization.
Rent comps 11 comps
| Address | Beds | Baths | Sqft | Rent | $/sqft | DOM | Units | Dist |
|---|---|---|---|---|---|---|---|---|
| 113 Dryden Pl Brooksville, FL | 2.0 | 1.0 | 761 | $1,395 | $1.83 | 19d | 1 | 0.79mi |
| 87 Dryden Pl Brooksville, FL | 2.0 | 1.0 | 761 | $1,295 | $1.70 | 6d | 1 | 0.80mi |
| 131 Dryden Pl Brooksville, FL | 2.0 | 1.0 | 761 | $1,395 | $1.83 | 6d | 1 | 0.81mi |
| 181 Dryden Pl Brooksville, FL | 1.0–2.0 | 1.0 | 714 | $1,395 | $1.95 | 14d | 4 | 0.81mi |
| 109 Dryden Pl Brooksville, FL | 2.0 | 1.0 | 761 | $1,299 | $1.71 | 19d | 1 | 0.81mi |
| 105 Dryden Pl Brooksville, FL | 2.0 | 1.0 | 761 | $1,395 | $1.83 | 6d | 1 | 0.81mi |
| 253 Dryden Pl Brooksville, FL | 1.0 | 1.0 | 667 | $1,275 | $1.91 | 26d | 1 | 0.81mi |
| 265 Dryden Pl Brooksville, FL | 1.0 | 1.0 | 667 | $1,229 | $1.84 | 26d | 1 | 0.82mi |
| 199 Dryden Pl Brooksville, FL | 2.0 | 1.0 | 761 | $1,395 | $1.83 | 6d | 1 | 0.82mi |
| 222 Dryden Pl Brooksville, FL | 1.0 | 1.0 | 667 | $1,275 | $1.91 | 6d | 1 | 0.86mi |
| 203 D St Brooksville, FL | 3.0 | 1.0 | 748 | $1,600 | $2.14 | 26d | 1 | 1.49mi |
Listing history 21 events
-
2026-06-21days on market $115,000 Active 40 DOM
-
2026-06-18days on market $115,000 Active 37 DOM
-
2026-06-17days on market $115,000 Active 36 DOM
-
2026-06-16days on market $115,000 Active 35 DOM
-
2026-06-15days on market $115,000 Active 34 DOM
-
2026-06-13days on market $115,000 Active 32 DOM
-
2026-06-13days on market $115,000 Active 31 DOM
-
2026-06-09days on market $115,000 Active 28 DOM
-
2026-06-08days on market $115,000 Active 27 DOM
-
2026-06-07days on market $115,000 Active 26 DOM
-
2026-06-04days on market $115,000 Active 23 DOM
-
2026-06-03days on market $115,000 Active 22 DOM
-
2026-06-02days on market $115,000 Active 21 DOM
-
2026-06-01days on market $115,000 Active 20 DOM
-
2026-05-31days on market $115,000 Active 19 DOM
-
2026-05-12$115,000 Active
-
2014-11-25soldstatus $75,000
-
2008-01-03soldstatus $62,500
-
2004-09-29soldstatus $49,000
-
2000-08-14soldstatus $42,500
-
1983-08-01soldstatus $39,000
ⓘ Source: listings_history table (triggers on properties + properties_extension) + one-shot
backfill from property_details.listing_events for pre-trigger history.
Tax reassessment forecast FL · Resets to sale price
- Current annual tax
- $1,944 · $162/mo
- Projected year-2 tax
- $1,944 · $162/mo
- Expected delta
- $0/yr ($0/mo · 0.0%)
ⓘ Screening estimate from a state-policy table — verify with the county assessor before closing.
Climate risk First Street
- Flood 1/10 Low FEMA zone X (unshaded) · 0% chance over 30 yrs
- Wildfire 7/10 Severe
- Heat 10/10 Extreme 7 d/yr ≥109°F today · 27 d/yr by 30 yrs out
- Wind 9/10 Extreme 99% chance of damaging wind over 30 yrs
- Air quality 2/10 Low 1 unhealthy d/yr today · 1 by 30 yrs out
Nearby sold comps map
Loading sold comps map…
Walkable amenities ~0.75 mi
Loading nearby amenities…
Taxation est. · year 1
- Rental income
- $15,976
- − Mortgage interest
- −$6,442
- − Property taxes
- −$1,944
- − Insurance
- −$575
- − Repairs & maintenance
- −$1,278
- − Management
- −$1,278
- − Depreciation
- −$3,345
- Taxable income
- $1,114
- Est. tax owed @ 24.0%
- −$267
- After-tax cash flow
- $2,598/yr
For passive investors: Depreciation is non-cash, so a rental often shows a tax loss while cash-flowing — sheltering income. Rental losses are passive: they offset passive income freely, and up to $25,000/yr can offset ordinary (W-2) income if you actively participate and your MAGI is under $100k (phasing out to $0 by $150k); unused losses carry forward. On sale, claimed depreciation is recaptured at up to 25%, and gains may owe capital-gains tax (a 1031 exchange can defer both). Figures are a year-1 estimate at your 24.0% rate — not tax advice; consult a CPA.
Schools (NCES district)
- District
- Hernando
- NCES district ID
- 1200810
- Math proficiency
- 50% ▼ -8.00%
- Reading proficiency
- 50% ▼ -4.00%
- Median HH income
- $41,985
- Composite
- 42.03/100
- National rank
- #3329
- State rank
- #38 of 73 in FL
Livability — South Brooksville
- Score
- 67/100
- State rank
- #584
- US rank
- #11158
Category grades
Schools grade is shown separately in the Schools card above.
Census & demographics
- Census place
- South Brooksville, FL
- County
- Hernando County · 169,677 people
- Metro
- Tampa-St. Petersburg-Clearwater, FL
- Population (ZIP)
- 24,115
- Household income
- $60,440
- Rent vs Own
- Severe rent burden
- 664.0
Population outlook (Hernando County) Hauer SSP2
- Today (2025)
- 189,218 people
- By 2030
- 194,367 · +2.7%
- By 2040
- 203,398 · +7.5%
- By 2050
- 209,589 · +10.8%
- By 2075
- 218,452 · +15.4%
- By 2100
- 205,923 · +8.8%
Race, ethnicity, and origin ACS 2023
- Neighborhood character
- Predominantly White (77%)
- Race & ethnicity
- White 77% Hispanic / Latino 11% Black 8% Two or more races 5%
- Hispanic origin (detail)
- Puerto Rican 4% Cuban 2% Dominican 1%
- Common ancestry
- Slovak 4% Romanian 2% Iranian 2%
- Foreign-born
- 4% · Canada, Jamaica
- Languages at home
- 93% English-only · Spanish 6%
Political lean MEDSL · Hernando
- 2024 margin
- Solid R (+37.0) · D 31.1% · R 68.2%
- 2008→2024 swing
- -33.5pp toward R · 2008: -3.6pp · 2024: -37.0pp
- All cycles
- 2024: R+37.0 2020: R+30.2 2016: R+29.0 2012: R+8.5 2008: R+3.6
Not yet ingested
- Civics
- —
Market trends
- HPI YoY
- ▼ -132.68%
- Current HPI
- 313.4695
- Rent YoY
- ▲ 0.19%
- Metro
- Tampa-St. Petersburg-Clearwater, FL
- State GDP YoY
- ▲ 3.28%
- F500 in state
- 36
Industry mix (Fortune 500 HQ in FL)
| Industry | F500 HQs | Revenue |
|---|---|---|
| Industrial Technology | 2 | $29B |
|
||
| Insurance | 2 | $17B |
|
||
| Retail | 1 | $60B |
|
||
| Technology Distribution | 1 | $58B |
|
||
| Homebuilding | 1 | $35B |
|
||
| Technology Manufacturing | 1 | $35B |
|
||
Price history
+194.9% since first listed6 events — show timeline
- 2026-05-12 Listed $115,000 FSBO.com
- 2014-11-25 Sold (Public Records) $75,000 Public Records
- 2008-01-03 Sold (Public Records) $62,500 Public Records
- 2004-09-29 Sold (Public Records) $49,000 Public Records
- 2000-08-14 Sold (Public Records) $42,500 Public Records
- 1983-08-01 Sold (Public Records) $39,000 Public Records
Property tax history
+8.9%/yrLatest (2025): $1,944 · -1.2% YoY. Source: county tax records.
Cash-flow waterfall
monthlySold comps — $/sqft
last 12 mo · ≤1 miLoading sold comps…