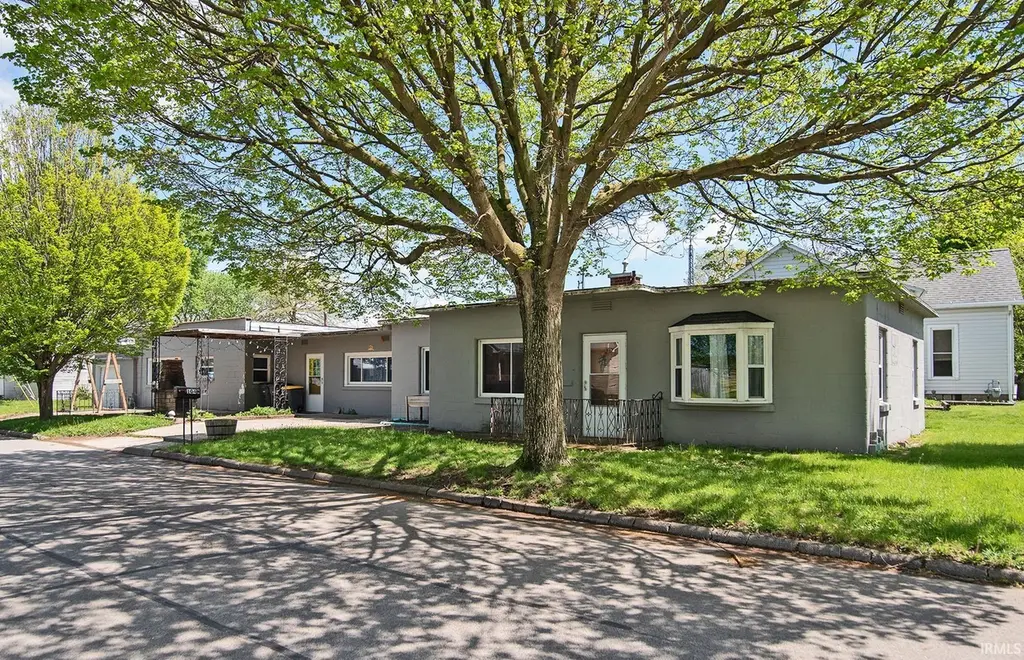
104 N 15th St · Decatur, IN
Flood risk 1/10 · Minimal
- FEMA flood zone
- X (unshaded)
- Chance of flooding over 30 yrs
- 0.0%
- Est. flood insurance / yr
- $507 – $1,088
Fire risk 1/10 · Minimal
- Est. fire insurance / yr
- $717 – $1,331
Heat risk 3/10 · Minor
- Hot days now (above 100°F)
- 7 days/yr
- Hot days in 30 yrs
- 17 days/yr
Wind risk 2/10 · Minimal
- Chance of severe wind over 30 yrs
- —
Air-quality risk 2/10 · Minimal
- Unhealthy air days now
- 1 days/yr
- Unhealthy air days in 30 yrs
- 3 days/yr
Risk factors via First Street. Map © Google.
Why this score? — see what drove the B grade
The composite is a weighted blend of 9 inputs, each scored 0–100. Each bar is that input's sub-score; the figure is the points it added to the 100-point composite (weight × sub-score).
- Cash flow +28.2/30.0
- ARV discount +15.0/15.0
- DSCR +10.0/10.0
- 1% rule +6.4/10.0
- Livability +3.9/5.0
- Schools +2.7/10.0
- Rent growth +2.5/5.0
- Condition / age +2.5/5.0
- Appreciation +0.0/10.0
$115,000
🖨 Deal sheet 📄 Offer letter ✓ Due diligence
Listing remarks
MOTIVATED SELLERS!!! Welcome to this spacious and affordable 4-bedroom, 1.5 bath located in downtown Decatur, Indiana. This property offers an excellent opportunity for first-time buyers, or investors looking for value and space. This home has a lot of potential and is located near local parks and food. Schedule your showing today!
Key facts
- 6,098 sq ft lot
- Garage
- Built 1950
Property features AI
Exterior
- Parking: Attached garage (1 car)
- Utilities: Public water; Public sewer
- Home design: Single-family residence; Site-built home; Single story
- Construction: Block construction; Slab foundation; Built as site-built home
- Exterior features: Patio; Corner lot; Publicly maintained road
Interior
- Kitchen: Microwave; Refrigerator; Gas Range
- Bathrooms: 1 full bathroom; 1 half bathroom; 2 main level bathrooms
- Heating & cooling: Central air; Wall unit(s); Forced air heating
- Interior features: Fireplace (1)
- Laundry & utility: Washer; Dryer; Laundry on main level
Neighborhood map
What this means for you Summary
Snapshot
- This is a 3-bed/1.5-bath single-family listed at $115k.
Deal economics
- At list price, monthly cash flow is $365 ($4k/yr) — positive.
- The deal already cash-flows at list — no discount required.
- Meets the 1% rule at list price ($1k rent vs $115k).
- Recommended offer: $113k (1.5% below list) — sets the bar for market timing.
- Cap rate 10.1% vs local median 3.4% in Decatur — top-decile yield for the area; either an underpriced asset or a hidden risk that comps aren't pricing in. Stress-test before assuming the spread holds.
Location & tenants
- Location reads 77/100 on livability (#40 in IN, #3,038 nationally) — a middle-class / working-renter tenant base. Strengths: cost of living A+, housing A+, health & safety A+; Watch: employment C-, amenities F, commute F.
- North Adams Community Schools (town): math 29% / reading 35% proficiency, ranked #220 of 301 in IN (top 73%) — families likely to look elsewhere, expect single-tenant / working-renter base with shorter leases.
- Zoned schools: Bellmont Elementary (math 30% / reading 23%, grade F, #755 of 994 statewide, top 76%, 656 students, 60% FRL); Bellmont Middle School (math 21% / reading 36%, grade F, #224 of 330 statewide, top 68%, 313 students, 58% FRL); Bellmont Senior High School (math 42% / reading 57%, grade D, #123 of 369 statewide, top 36%, 641 students, 34% FRL).
- Market conditions: 54 active listings in the ZIP; 78 units permitted in Adams County in 2024 (0 in 5+ unit buildings).
Forward outlook
- Local home prices are declining (-3.0%/yr); year-one equity from $795 of loan paydown is wiped out by about $3k of value loss. Plan a longer hold.
- Adams County population projected at -13% by 2050 — secular population decline; favor cash flow + early exit over multi-decade hold.
- At projected returns (-3.0% appreciation + 3.0% rent growth), your $32k cash investment doubles in ~9 years — after that, you're playing with house money.
Negotiation context
- It's been on market 29 days — a 2% lower offer ($113k) is reasonable based on typical stale-listing flexibility.
- Current owner paid $65k; list at $115k implies a 77% gain — meaningful room to come down on a strong offer.
Risks & watch-outs
- Watch-outs: built in 1950 — expect roof / HVAC / electrical / plumbing capex.
Questions for the listing agent
- Built in 1950 — when were the roof, HVAC, electrical panel, plumbing, and water heater last replaced?
- Is there a deadline driving the sale (1031 exchange, divorce, estate, relocation)? That informs how much negotiation room exists.
- Schools are D-rated, which usually means shorter tenancies and higher turnover. Who's the typical renter profile here, and what's been the actual vacancy rate?
- What's the average days-on-market for RENTAL listings here right now (not sales)? A rising rental-DOM trend means longer vacancies and softer asking-rent achievability than the comps imply.
- What's the recent tenant-quality profile in this submarket — average credit score on applications, eviction rate, late-payment / NSF rate, and stable-employment percentage? A property-management company in the area should have these aggregated.
- How much new for-sale + rental construction is in the pipeline within 1–3 miles? Heavy new supply typically softens prices + rents 12–24 months out; constrained supply supports both.
Investment metrics
- 1% rule
- 1.14% ✓
- Cap rate
- 10.10%
- Cash-on-cash
- 13.60%
- DSCR
- 1.61
- GRM
- 7.3
CMA / ARV
- ARV (median comp)
- $177,681
- List price
- $115,000
- Delta
- -35.28%
- Verdict
- UNDERPRICED
- Comps
- 20 within 1.0 mi
Show comp detail 12 sales within ~0.75 mi
| Address | Dist | Beds/Ba | Sqft | Sold | Price | $/sf | Match |
|---|---|---|---|---|---|---|---|
| 104 N 15th St | 0.00mi | 4/1.5 (+1) | 2,023 (0%) | 0mo | $65,000 | $32 | 95 |
| 1024 Adams St | 0.31mi | 4/2.0 (+1) | 2,105 (+4%) | 2mo | $210,900 | $100 | 70 |
| 109 N 10th St | 0.31mi | 3/1.0 | 1,855 (-8%) | 6mo | $189,900 | $102 | 65 |
| 209 S 5th St | 0.65mi | 3/2.5 | 2,020 (-0%) | 1mo | $250,000 | $124 | 64 |
| 715 St Marys St | 0.74mi | 3/2.0 | 1,924 (-5%) | 0mo | $180,000 | $94 | 55 |
| 607 W Jefferson St | 0.56mi | 4/1.0 (+1) | 1,839 (-9%) | 1mo | $100,000 | $54 | 51 |
| 134 S 10th St | 0.32mi | 3/2.0 | 2,264 (+12%) | 22mo | $221,150 | $98 | 45 |
| 507 Marshall St | 0.66mi | 4/2.0 (+1) | 1,856 (-8%) | 5mo | $240,000 | $129 | 44 |
| 724 Adams Street St | 0.49mi | 4/2.0 (+1) | 1,873 (-7%) | 16mo | $159,000 | $85 | 44 |
| 604 Adams St | 0.58mi | 4/2.0 (+1) | 2,190 (+8%) | 16mo | $163,000 | $74 | 39 |
| 313 W Madison St | 0.72mi | 4/2.0 (+1) | 2,124 (+5%) | 21mo | $165,000 | $78 | 34 |
| 121 S 7th St | 0.53mi | 4/2.0 (+1) | 1,737 (-14%) | 15mo | $218,000 | $126 | 32 |
Match score weights: distance 35% · size 25% · config 20% · recency 20%. Top-matched comps best support the ARV.
Projected returns pro-forma
-3.0% appreciation · 3.0% rent growth · sell at horizon
- IRR
- 3.7%
- Equity multiple
- 1.14×
- Total profit
- $4,549
- Equity at exit
- $17,147
- IRR
- 13.1%
- Equity multiple
- 2.05×
- Total profit
- $33,658
- Equity at exit
- $9,943
Cash invested: $32,200 (down + closing). Projections, not guarantees.
Landlord ↔ Tenant lean methodology
- Overall (STATE)
- 90 Strongly Landlord-Friendly
- State Indiana
- 90 Strongly Landlord-Friendly · R+11
- County
- — inherits STATE
- City
- — inherits STATE
ZIP-level market 46733
- Home prices YoY
- -18.9%
- Active inventory
- 54
- Price-to-rent
- 7.3×
Monthly cashflow live
- Estimated rent
- $1,311 medium interval (Pro) →
- Mortgage (P&I)
- −$603
- Tax from tax record
- −$20 /mo · $237/yr
- Insurance
- −$48
- HOA
- −$0
- Vacancy / Maint / Mgmt
- −$275
- Net cashflow
- $365
Break-even live
UW: 25.0% down · 7.5% · 30yr · 1.5% tax · 5.0% vac · 8.0% maint · 8.0% mgmt
Financing live
Cash to close
- Down payment
- $28,750
- Closing costs
- $3,450
- Reserves months
- —
- Total cash needed
- —
Loan-product check · same deal, 3 products live
Conventional
25% down · 7.5% · 30yr
- Down + closing
- —
- Monthly P&I
- —
- Monthly cashflow
- —
- DSCR
- —
- Eligible?
- —
Personal DTI + credit; lowest rate.
DSCR
20% down · 8.5% · 30yr
- Down + closing
- —
- Monthly P&I
- —
- Monthly cashflow
- —
- DSCR
- —
- Eligible?
- —
No personal income docs; deal must DSCR.
Hard money
10% down · 12.0% · 12mo
- Down + closing
- —
- Monthly P&I
- —
- Monthly cashflow
- —
- DSCR
- —
- Eligible?
- —
Short-term bridge; refi at stabilization.
Listing history 2 events
-
2026-05-10price $130,000 312-char remark
-
2026-04-27$150,000 Active 312-char remark
ⓘ Source: listings_history table (triggers on properties + properties_extension) + one-shot
backfill from property_details.listing_events for pre-trigger history.
Tax reassessment forecast IN · Partial reset (capped growth)
- Current annual tax
- $237 · $20/mo
- Projected year-2 tax
- $607 · $51/mo
- Expected delta
- +$370/yr (+$31/mo · 156.0%)
ⓘ Screening estimate from a state-policy table — verify with the county assessor before closing.
Climate risk First Street
- Flood 1/10 Low FEMA zone X (unshaded) · 0% chance over 30 yrs
- Wildfire 1/10 Low
- Heat 3/10 Moderate 7 d/yr ≥100°F today · 17 d/yr by 30 yrs out
- Wind 2/10 Low
- Air quality 2/10 Low 1 unhealthy d/yr today · 3 by 30 yrs out
Nearby sold comps map
Loading sold comps map…
Walkable amenities ~0.75 mi
Loading nearby amenities…
Taxation est. · year 1
- Rental income
- $15,731
- − Mortgage interest
- −$6,442
- − Property taxes
- −$237
- − Insurance
- −$575
- − Repairs & maintenance
- −$1,259
- − Management
- −$1,259
- − Depreciation
- −$3,345
- Taxable income
- $2,615
- Est. tax owed @ 24.0%
- −$628
- After-tax cash flow
- $3,751/yr
For passive investors: Depreciation is non-cash, so a rental often shows a tax loss while cash-flowing — sheltering income. Rental losses are passive: they offset passive income freely, and up to $25,000/yr can offset ordinary (W-2) income if you actively participate and your MAGI is under $100k (phasing out to $0 by $150k); unused losses carry forward. On sale, claimed depreciation is recaptured at up to 25%, and gains may owe capital-gains tax (a 1031 exchange can defer both). Figures are a year-1 estimate at your 24.0% rate — not tax advice; consult a CPA.
Schools (NCES district)
- District
- North Adams Community Schools
- NCES district ID
- 1807680
- Math proficiency
- 29% ▼ -3.00%
- Reading proficiency
- 35% ▼ -6.00%
- Median HH income
- $45,806
- Composite
- 27.44/100
- National rank
- #6964
- State rank
- #220 of 301 in IN
Livability — Decatur
- Score
- 77/100
- State rank
- #40
- US rank
- #3038
Category grades
Schools grade is shown separately in the Schools card above.
Census & demographics
- Census place
- Decatur, IN
- City population
- 19,246
- Population (ZIP)
- 19,246
Population outlook (Adams County) Hauer SSP2
- Today (2025)
- 33,772 people
- By 2030
- 32,927 · -2.5%
- By 2040
- 31,349 · -7.2%
- By 2050
- 29,447 · -12.8%
- By 2075
- 24,062 · -28.8%
- By 2100
- 18,126 · -46.3%
Race, ethnicity, and origin ACS 2023
- Neighborhood character
- Predominantly White (90%)
- Race & ethnicity
- White 90% Hispanic / Latino 6% Two or more races 4%
- Hispanic origin (detail)
- Mexican 6%
- Common ancestry
- Lithuanian 2% Italian 2% Slovak 1%
- Foreign-born
- 1% · Canada
- Languages at home
- 96% English-only · German/W. Germanic 3% Spanish 1%
Political lean MEDSL · Adams
- 2024 margin
- Solid R (+52.6) · D 22.8% · R 75.4% · Other 1.8%
- 2008→2024 swing
- -26.9pp toward R · 2008: -25.7pp · 2024: -52.6pp
- All cycles
- 2024: R+52.6 2020: R+52.4 2016: R+52.5 2012: R+39.5 2008: R+25.7
Not yet ingested
- Civics
- —
Market trends
- HPI YoY
- ▼ -50.02%
- Current HPI
- 215.0238
- Rent YoY
- —
- Metro
- —
- State GDP YoY
- ▲ 2.90%
- F500 in state
- 18
Industry mix (Fortune 500 HQ in IN)
| Industry | F500 HQs | Revenue |
|---|---|---|
| Industrial Machinery | 2 | $37B |
|
||
| Healthcare | 1 | $177B |
|
||
| Pharmaceuticals | 1 | $45B |
|
||
| Metals / Steel | 1 | $18B |
|
||
| Agriculture | 1 | $17B |
|
||
| Packaging | 1 | $12B |
|
||
Price history
-56.7% since first listed5 events — show timeline
- 2026-06-05 Sold (MLS) $65,000 IRMLS
- 2026-05-25 Pending — IRMLS
- 2026-05-22 Price Changed $115,000 IRMLS
- 2026-05-10 Price Changed $130,000 IRMLS
- 2026-04-27 Listed $150,000 IRMLS
Property tax history
-5.5%/yrLatest (2024): $237 · +226.5% YoY. Source: county tax records.
Cash-flow waterfall
monthlySold comps — $/sqft
last 12 mo · ≤1 miLoading sold comps…