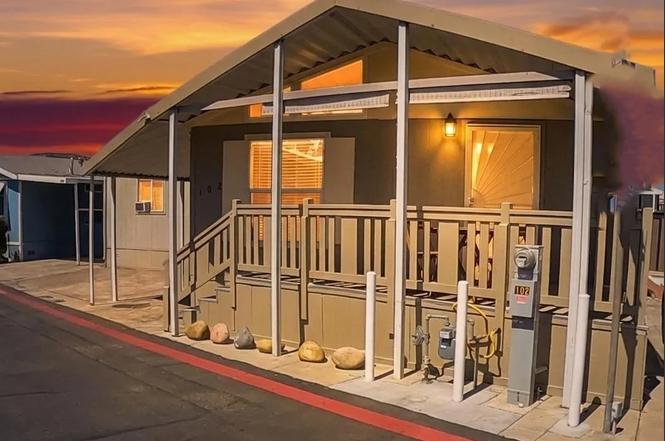
255 E Bradley Ave #102 · Bostonia, CA
Flood risk 6/10 · Moderate
- FEMA flood zone
- X (unshaded)
- Chance of flooding over 30 yrs
- 0.73%
- Est. flood insurance / yr
- $507 – $1,088
Fire risk 1/10 · Minimal
- Est. fire insurance / yr
- $659 – $1,223
Heat risk 5/10 · Moderate
- Hot days now (above 98°F)
- 6 days/yr
- Hot days in 30 yrs
- 18 days/yr
Wind risk 1/10 · Minimal
- Chance of severe wind over 30 yrs
- —
Air-quality risk 3/10 · Minor
- Unhealthy air days now
- 4 days/yr
- Unhealthy air days in 30 yrs
- 4 days/yr
Risk factors via First Street. Map © Google.
Why this score? — see what drove the B+ grade
The composite is a weighted blend of 9 inputs, each scored 0–100. Each bar is that input's sub-score; the figure is the points it added to the 100-point composite (weight × sub-score).
- Cash flow +30.0/30.0
- ARV discount +14.1/15.0
- 1% rule +10.0/10.0
- DSCR +10.0/10.0
- Schools +4.0/10.0
- Livability +3.2/5.0
- Condition / age +2.5/5.0
- Rent growth +2.3/5.0
- Appreciation +0.0/10.0
$108,995
🖨 Deal sheet 📄 Offer letter ✓ Due diligence
Listing remarks
Welcome to Villa Cajon Mobile Home Estates, a welcoming all-age community where comfort, convenience, and family-friendly amenities come together. Residents enjoy access to a sparkling community pool and beautiful park, creating the perfect setting for relaxation and outdoor fun. An excellent opportunity for comfortable and affordable living in a convenient location close to shopping, dining, and freeway access. 4 minutes away to 67 and 8 freeway. Space rent is $1,800.00 per month Step inside this immaculate 3-bedroom, 2-bathroom home, built in 2000 and thoughtfully updated throughout. The spacious open-concept floor plan features soaring vaulted ceilings that create a bright and airy atmo
Key facts
- Community pool
- Upgraded kitchen
- Storage shed
Tags
Property features AI
Finance
- Other: Located in Villa Cajon Mobile Home community
- HOA & community: Community amenities include pool, playground, picnic area and sport court; Association fees include water and sewer
Exterior
- Parking: Assigned parking; 1-car garage (3 total parking spaces)
- Security: Smoke and carbon monoxide detectors
- Utilities: Public water; Sewer connected
- Home design: Mobile home; Single-story
- Construction: Stucco construction; Asphalt roof; Built on a foundation (mobile home)
- Exterior features: Porch; Community in-ground pool; Playground; Picnic area; Sport court; Shed(s)
Interior
- Kitchen: Microwave; Refrigerator; Disposal
- Bedrooms: Up to 3 bedrooms
- Flooring: Laminate
- Bathrooms: 2 full bathrooms
- Heating & cooling: Floor furnace heating; Electric heating; Central air conditioning
- Interior features: Disposal; Water heater; Carbon monoxide detector(s); Smoke detector(s); Has view
- Laundry & utility: Washer; Dryer
Neighborhood map
What this means for you Summary
Snapshot
- This is a 2-bed/2.0-bath manufactured listed at $109k.
Deal economics
- At list price, monthly cash flow is $1k ($14k/yr) — positive.
- The deal already cash-flows at list — no discount required.
- Meets the 1% rule at list price ($2k rent vs $109k).
- Cap rate 19.6% vs local median 6.0% in Bostonia — top-decile yield for the area; either an underpriced asset or a hidden risk that comps aren't pricing in. Stress-test before assuming the spread holds.
Location & tenants
- Location reads 65/100 on livability (#383 in CA) — a middle-class / working-renter tenant base. Strengths: commute A+, housing B+; Watch: schools D, crime F, amenities F.
- Grossmont Union High (suburban): math 31% / reading 60% proficiency, ranked #173 of 517 in CA (top 34%) — families likely to look elsewhere, expect single-tenant / working-renter base with shorter leases; only 17% free/reduced lunch — higher-income household profile.
- Market conditions: Rents soft (-0.8%/yr); 238 active listings in the ZIP; 40 comparable units currently listed for rent nearby; rentals leasing fast (median 2d on market — plan ~1-2 weeks tenant-placement turnaround); 11,759 units permitted in San Diego County in 2024 (7,244 in 5+ unit buildings).
- This rent runs 38% of the median local income ($74k/yr) — at the standard rent-burdened threshold; future hikes will face affordability resistance.
Forward outlook
- Local home prices are declining (-3.0%/yr); year-one equity from $753 of loan paydown is wiped out by about $3k of value loss. Plan a longer hold.
- San Diego County population projected at +20% by 2050 — long-run rental-demand tailwind backs the buy-and-hold thesis.
- At projected returns (-3.0% appreciation + 0.0% rent growth), your $31k cash investment doubles in ~3 years — after that, you're playing with house money.
Negotiation context
- Only 2 days on market — expect competitive offers; lowballing is unlikely to land.
- 2 sale attempts since 22y ago with the ask held roughly flat each time — persistent listings suggest the price (not the market) is what's stuck; bring a comps-based counter.
Risks & watch-outs
- Climate carrying-cost: major flood risk; extreme-heat days projected 6→18/yr by 2055 (HVAC capex compounding) — expect insurance premiums to compound above CPI over the hold.
Questions for the listing agent
- Is there a deadline driving the sale (1031 exchange, divorce, estate, relocation)? That informs how much negotiation room exists.
- Schools are D-rated, which usually means shorter tenancies and higher turnover. Who's the typical renter profile here, and what's been the actual vacancy rate?
- Crime grade is F in this area — have there been break-ins, vandalism, or insurance claims at this property in the last 3 years? What carrier currently insures it and at what premium?
- What's the average days-on-market for RENTAL listings here right now (not sales)? A rising rental-DOM trend means longer vacancies and softer asking-rent achievability than the comps imply.
- What's the recent tenant-quality profile in this submarket — average credit score on applications, eviction rate, late-payment / NSF rate, and stable-employment percentage? A property-management company in the area should have these aggregated.
- How much new for-sale + rental construction is in the pipeline within 1–3 miles? Heavy new supply typically softens prices + rents 12–24 months out; constrained supply supports both.
Investment metrics
- 1% rule
- 2.16% ✓
- Cap rate
- 19.55%
- Cash-on-cash
- 47.36%
- DSCR
- 3.11
- GRM
- 3.8
CMA / ARV
- ARV (on-the-fly)
- $127,600
- Comps found
- 11
Show comp detail 11 sales within ~0.75 mi
| Address | Dist | Beds/Ba | Sqft | Sold | Price | $/sf | Match |
|---|---|---|---|---|---|---|---|
| 351 E Bradley Ave #48 | 0.11mi | 2/1.0 | 800 (-9%) | 1mo | $79,999 | $100 | 75 |
| 255 E Bradley Ave #119 | 0.03mi | 3/1.5 (+1) | 950 (+8%) | 4mo | $121,000 | $127 | 75 |
| 255 E Bradley Ave #13 | 0.00mi | 2/2.0 | 960 (+9%) | 14mo | $165,000 | $172 | 73 |
| 255 E Bradley Ave Spc 79 | 0.00mi | 2/2.0 | 760 (-14%) | 6mo | $95,500 | $126 | 72 |
| 255 E Bradley Ave #11 | 0.03mi | 2/2.0 | 800 (-9%) | 17mo | $130,000 | $163 | 69 |
| 351 E Bradley Ave #45 | 0.10mi | 2/2.0 | 960 (+9%) | 15mo | $135,000 | $141 | 68 |
| 351 E Bradley Ave #91 | 0.15mi | 3/1.0 (+1) | 880 (0%) | 20mo | $140,000 | $159 | 68 |
| 351 E Bradley Ave Spc 125 | 0.15mi | 3/2.0 (+1) | 960 (+9%) | 10mo | $150,000 | $156 | 65 |
| 400 Greenfield Dr Spc 123 | 0.24mi | 2/2.0 | 960 (+9%) | 11mo | $107,000 | $111 | 64 |
| 351 E Bradley Ave #75 | 0.15mi | 2/2.5 | 1,000 (+14%) | 22mo | $145,000 | $145 | 50 |
| 751 E Bradley Ave #43 | 0.42mi | 2/2.0 | 960 (+9%) | 21mo | $245,000 | $255 | 48 |
Match score weights: distance 35% · size 25% · config 20% · recency 20%. Top-matched comps best support the ARV.
Projected returns pro-forma
-3.0% appreciation · 0.0% rent growth · sell at horizon
- IRR
- 41.4%
- Equity multiple
- 2.71×
- Total profit
- $52,112
- Equity at exit
- $16,252
- IRR
- 46.3%
- Equity multiple
- 4.85×
- Total profit
- $117,345
- Equity at exit
- $9,424
Cash invested: $30,519 (down + closing). Projections, not guarantees.
Landlord ↔ Tenant lean methodology
- Overall (STATE)
- 18 Strongly Tenant-Friendly
- State California
- 18 Strongly Tenant-Friendly · D+13
- County
- — inherits STATE
- City
- — inherits STATE
ZIP-level market 92021
- Rents YoY
- -0.8%
- Active inventory
- 238
- Price-to-rent
- 3.8×
Monthly cashflow live
- Estimated rent
- $2,359 high interval (Pro) →
- Mortgage (P&I)
- −$572
- Tax from tax record
- −$42 /mo · $509/yr
- Insurance
- −$45
- HOA
- −$0
- Vacancy / Maint / Mgmt
- −$495
- Net cashflow
- $1,204
Break-even live
UW: 25.0% down · 7.5% · 30yr · 1.5% tax · 5.0% vac · 8.0% maint · 8.0% mgmt
Financing live
Cash to close
- Down payment
- $27,249
- Closing costs
- $3,270
- Reserves months
- —
- Total cash needed
- —
Loan-product check · same deal, 3 products live
Conventional
25% down · 7.5% · 30yr
- Down + closing
- —
- Monthly P&I
- —
- Monthly cashflow
- —
- DSCR
- —
- Eligible?
- —
Personal DTI + credit; lowest rate.
DSCR
20% down · 8.5% · 30yr
- Down + closing
- —
- Monthly P&I
- —
- Monthly cashflow
- —
- DSCR
- —
- Eligible?
- —
No personal income docs; deal must DSCR.
Hard money
10% down · 12.0% · 12mo
- Down + closing
- —
- Monthly P&I
- —
- Monthly cashflow
- —
- DSCR
- —
- Eligible?
- —
Short-term bridge; refi at stabilization.
Rent comps 40 comps
| Address | Beds | Baths | Sqft | Rent | $/sqft | DOM | Units | Dist |
|---|---|---|---|---|---|---|---|---|
| 425 E Bradley Ave El Cajon, CA | 1.0–2.0 | 1.0 | 771 | $2,350 | $3.05 | 1d | 13 | 0.22mi |
| 310 E Bradley Ave El Cajon, CA | 1.0–2.0 | 1.0 | 664 | $2,050 | $3.09 | 1d | 1 | 0.22mi |
| 1521 Graves Ave El Cajon, CA | 1.0–2.0 | 1.0–2.0 | 730 | $2,632 | $3.61 | 1d | 7 | 0.29mi |
| 1237 Graves Ave El Cajon, CA | 1.0–2.0 | 1.0–2.0 | 775 | $2,565 | $3.31 | 1d | 13 | 0.29mi |
| 360 E Bradley Ave El Cajon, CA | 3.0 | 2.0 | 1116 | $2,934 | $2.63 | 1d | 3 | 0.30mi |
| 1261 Victor Ave Unit 9 El Cajon, CA | 2.0 | 2.0 | 810 | $2,195 | $2.71 | 1d | 1 | 0.33mi |
| 745 E Bradley Ave Unit 46 El Cajon, CA | 3.0 | 1.0 | 806 | $2,298 | $2.85 | 24d | 1 | 0.40mi |
| 1294 N Mollison Ave El Cajon, CA | 1.0–2.0 | 1.0 | 750 | $2,128 | $2.84 | 1d | 8 | 0.47mi |
| 1696 Buckeye Dr El Cajon, CA | 3.0 | 1.0 | 942 | $2,900 | $3.08 | 2d | 1 | 0.56mi |
| 1430 Diamond Ln El Cajon, CA | 2.0 | 1.0 | 863 | $2,695 | $3.12 | 2d | 1 | 0.65mi |
| 1314 5 D Dr Unit 1318 El Cajon, CA | 3.0 | 1.0 | 960 | $2,600 | $2.71 | 23d | 1 | 0.70mi |
| 1005 N Mollison Ave El Cajon, CA | 2.0 | 1.0 | 750 | $2,195 | $2.93 | 1d | 1 | 0.71mi |
| 359 Cascade Rd El Cajon, CA | 2.0 | 1.0 | 765 | $2,875 | $3.76 | 7d | 1 | 0.76mi |
| 848 N Mollison Ave El Cajon, CA | 1.0 | 1.0 | 690 | $2,101 | $3.04 | 1d | 5 | 0.80mi |
| 716 Ballantyne St Unit 12 El Cajon, CA | 2.0 | 2.0 | 900 | $2,100 | $2.33 | 1d | 1 | 0.86mi |
| 700 Ballantyne St El Cajon, CA | 1.0–2.0 | 1.0 | 850 | $2,150 | $2.53 | 1d | 5 | 0.87mi |
| 8527 Graves Ave Santee, CA | 1.0–2.0 | 1.0–2.0 | 505 | $2,000 | $3.96 | 1d | 1 | 0.90mi |
| 989 Peach Ave El Cajon, CA | 1.0–3.0 | 1.0–2.0 | 845 | $2,150 | $2.54 | 1d | 11 | 0.91mi |
| 798 McClure St Unit 14 El Cajon, CA | 3.0 | 1.0 | 916 | $2,295 | $2.51 | 1d | 1 | 0.91mi |
| 798 McClure St Apt 7 El Cajon, CA | 1.0 | 1.0 | 570 | $1,595 | $2.80 | 1d | 1 | 0.91mi |
| 1019 Peach Ave El Cajon, CA | 1.0–2.0 | 1.0–2.0 | 700 | $2,161 | $3.09 | 1d | 8 | 0.96mi |
| 1038 Peach Ave El Cajon, CA | 2.0 | 1.5 | 850 | $1,978 | $2.33 | 1d | 4 | 0.97mi |
| 1050 Peach Ave El Cajon, CA | 2.0 | 2.0 | 850 | $3,460 | $4.07 | 4d | 1 | 0.99mi |
| 1037 Peach Ave El Cajon, CA | 1.0 | 1.0 | 560 | $1,694 | $3.03 | 1d | 4 | 0.99mi |
| 205 Beech St El Cajon, CA | 2.0 | 1.5 | 850 | $2,480 | $2.92 | 1d | 1 | 1.04mi |
| 390 E Madison Ave Unit E El Cajon, CA | 2.0 | 1.5 | 1034 | $2,300 | $2.22 | 4d | 1 | 1.09mi |
| 1221 Oro St El Cajon, CA | 2.0 | 1.5 | 1020 | $2,575 | $2.52 | 1d | 1 | 1.11mi |
| 534 Jeffree St El Cajon, CA | 3.0 | 2.0 | 1118 | $3,895 | $3.48 | 3d | 1 | 1.12mi |
| 534 Jeffree St El Cajon, CA | 3.0 | 2.0 | 1118 | $3,895 | $3.48 | 10d | 1 | 1.12mi |
| 303 E Madison Ave El Cajon, CA | 2.0 | 1.0 | 875 | $1,995 | $2.28 | 1d | 1 | 1.13mi |
| 455 Ballantyne St El Cajon, CA | 2.0 | 1.5 | 925 | $2,195 | $2.37 | 1d | 1 | 1.15mi |
| 505 E Madison Ave #89 El Cajon, CA | 2.0 | 1.5 | 975 | $2,350 | $2.41 | 2d | 1 | 1.15mi |
| 453 Graves Ave El Cajon, CA | 2.0 | 2.0 | 840 | $2,150 | $2.56 | 2d | 1 | 1.18mi |
| 545 N Mollison Ave El Cajon, CA | 2.0 | 1.0 | 700 | $2,028 | $2.90 | 1d | 11 | 1.18mi |
| 545 N Mollison Ave El Cajon, CA | 2.0 | 1.0 | 700 | $2,000 | $2.86 | 7d | 9 | 1.18mi |
| 458 Ballantyne St Unit 15 El Cajon, CA | 2.0 | 1.0 | 760 | $2,100 | $2.76 | 1d | 1 | 1.18mi |
| 589 N Johnson Ave El Cajon, CA | 2.0 | 1.0–2.0 | 889 | $2,150 | $2.42 | 1d | 1 | 1.19mi |
| 8729 Graves Ave Santee, CA | 1.0–2.0 | 1.0 | 752 | $2,385 | $3.17 | 1d | 8 | 1.19mi |
| 444 Graves Ave El Cajon, CA | 1.0 | 1.0 | 600 | $1,815 | $3.02 | 2d | 1 | 1.21mi |
| 917 E Madison Ave El Cajon, CA | 2.0 | 1.0 | 750 | $2,195 | $2.93 | 1d | 1 | 1.25mi |
Listing history 3 events
-
2026-06-18days on market $108,995 Active 2 DOM
-
2026-06-17remarks 699-char remark
-
2026-06-17$108,995 Active 1 DOM
ⓘ Source: listings_history table (triggers on properties + properties_extension) + one-shot
backfill from property_details.listing_events for pre-trigger history.
Tax reassessment forecast CA · Resets to sale price
- Current annual tax
- $509 · $42/mo
- Projected year-2 tax
- $828 · $69/mo
- Expected delta
- +$319/yr (+$27/mo · 62.7%)
ⓘ Screening estimate from a state-policy table — verify with the county assessor before closing.
Climate risk First Street
- Flood 6/10 Major FEMA zone X (unshaded) · 73% chance over 30 yrs
- Wildfire 1/10 Low
- Heat 5/10 Major 6 d/yr ≥98°F today · 18 d/yr by 30 yrs out
- Wind 1/10 Low
- Air quality 3/10 Moderate 4 unhealthy d/yr today · 4 by 30 yrs out
Nearby sold comps map
Loading sold comps map…
Walkable amenities ~0.75 mi
Loading nearby amenities…
Taxation est. · year 1
- Rental income
- $28,311
- − Mortgage interest
- −$6,105
- − Property taxes
- −$509
- − Insurance
- −$545
- − Repairs & maintenance
- −$2,265
- − Management
- −$2,265
- − Depreciation
- −$3,171
- Taxable income
- $13,451
- Est. tax owed @ 24.0%
- −$3,228
- After-tax cash flow
- $11,225/yr
For passive investors: Depreciation is non-cash, so a rental often shows a tax loss while cash-flowing — sheltering income. Rental losses are passive: they offset passive income freely, and up to $25,000/yr can offset ordinary (W-2) income if you actively participate and your MAGI is under $100k (phasing out to $0 by $150k); unused losses carry forward. On sale, claimed depreciation is recaptured at up to 25%, and gains may owe capital-gains tax (a 1031 exchange can defer both). Figures are a year-1 estimate at your 24.0% rate — not tax advice; consult a CPA.
Schools (NCES district)
- District
- Grossmont Union High
- NCES district ID
- 0616230
- Math proficiency
- 31% ▼ -1.00%
- Reading proficiency
- 60% ▲ 5.00%
- Median HH income
- $61,801
- Composite
- 40.07/100
- National rank
- #3810
- State rank
- #173 of 517 in CA
Livability — Bostonia
- Score
- 65/100
- State rank
- #383
- US rank
- #13065
Category grades
Schools grade is shown separately in the Schools card above.
Census & demographics
- Census place
- Bostonia, CA
- County
- San Diego County · 3,178,799 people
- Metro
- San Diego-Chula Vista-Carlsbad, CA
- Population (ZIP)
- 70,501
- Household income
- $74,013
- Rent vs Own
- Severe rent burden
- 4178.0
Population outlook (San Diego County) Hauer SSP2
- Today (2025)
- 3,678,185 people
- By 2030
- 3,856,546 · +4.8%
- By 2040
- 4,171,407 · +13.4%
- By 2050
- 4,421,607 · +20.2%
- By 2075
- 4,831,599 · +31.4%
- By 2100
- 4,832,502 · +31.4%
Race, ethnicity, and origin ACS 2023
- Neighborhood character
- Diverse neighborhood (Simpson 0.62)
- Race & ethnicity
- White 54% Hispanic / Latino 28% Two or more races 14% Black 6% Asian 5% Native American 2%
- Hispanic origin (detail)
- Mexican 24%
- Common ancestry
- Arab 6% Italian 2% Lithuanian 2%
- Foreign-born
- 22% · Canada
- Languages at home
- 65% English-only · Spanish 18% Arabic 7% Other Indo-European 3%
Political lean MEDSL · San Diego
- 2024 margin
- D (+16.8) · D 56.9% · R 40.1% · Other 2.9%
- 2008→2024 swing
- +6.6pp toward D · 2008: 10.2pp · 2024: 16.8pp
- All cycles
- 2024: D+16.8 2020: D+22.8 2016: D+17.8 2012: D+5.1 2008: D+10.2
Not yet ingested
- Civics
- —
Market trends
- HPI YoY
- ▼ -654.88%
- Current HPI
- 335.0617
- Rent YoY
- ▼ -0.83%
- Metro
- San Diego-Chula Vista-Carlsbad, CA
- State GDP YoY
- ▲ 3.21%
- F500 in state
- 116
Industry mix (Fortune 500 HQ in CA)
| Industry | F500 HQs | Revenue |
|---|---|---|
| Technology | 27 | $1,492B |
|
||
| Financial Services | 3 | $174B |
|
||
| Retail | 3 | $44B |
|
||
| Insurance | 3 | $26B |
|
||
| Media / Entertainment | 2 | $115B |
|
||
| Pharmaceuticals / Biotech | 2 | $62B |
|
||
Price history
+55.7% since first listed3 events — show timeline
- 2026-06-12 Listed $108,995 SDMLS
- 2005-01-11 Listing Removed — SDMLS
- 2004-09-29 Listed $70,000 SDMLS
Property tax history
-8.4%/yrLatest (2013): $509 · +5.3% YoY. Source: county tax records.
Cash-flow waterfall
monthlySold comps — $/sqft
last 12 mo · ≤1 miLoading sold comps…