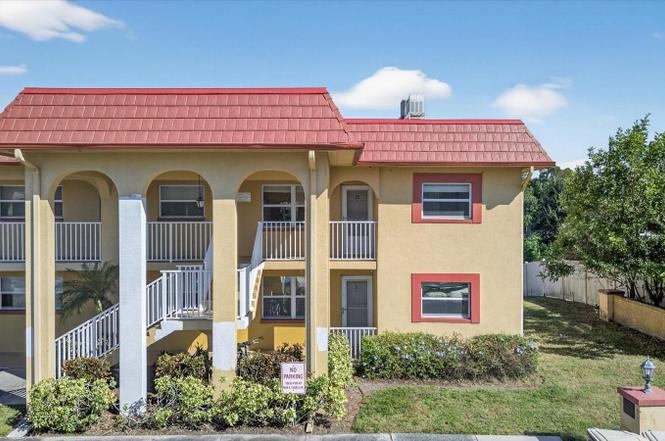
1301 S Hercules Ave #22 · Clearwater, FL
Flood risk 1/10 · Minimal
- FEMA flood zone
- X (unshaded)
- Chance of flooding over 30 yrs
- 0.0%
- Est. flood insurance / yr
- $507 – $1,088
Fire risk 1/10 · Minimal
- Est. fire insurance / yr
- $947 – $1,759
Heat risk 10/10 · Severe
- Hot days now (above 107°F)
- 7 days/yr
- Hot days in 30 yrs
- 24 days/yr
Wind risk 10/10 · Severe
- Chance of severe wind over 30 yrs
- 99.0%
Air-quality risk 3/10 · Minor
- Unhealthy air days now
- 2 days/yr
- Unhealthy air days in 30 yrs
- 3 days/yr
Risk factors via First Street. Map © Google.
Why this score? — see what drove the C- grade
The composite is a weighted blend of 9 inputs, each scored 0–100. Each bar is that input's sub-score; the figure is the points it added to the 100-point composite (weight × sub-score).
- Cash flow +19.0/30.0
- 1% rule +10.0/10.0
- ARV discount +7.5/15.0
- DSCR +6.0/10.0
- Schools +4.3/10.0
- Livability +4.1/5.0
- Condition / age +2.5/5.0
- Rent growth +1.2/5.0
- Appreciation +0.0/10.0
$99,000
🖨 Deal sheet (PDF) 📄 Offer letter ✓ Due diligence
Listing remarks MLS
Located just minutes from shopping, restaurants and the Gulf Beaches, this corner unit is completely move in ready. It has new paint and carpet. Best of all it has the best view of the lake of all the units in the complex. The association has upgraded all the windows and screen doors and has painted the outside. The Co-op has been in existence since the 70's and is in excellent financial shape. All the units are wholly owned and there are no foreclosures. There are no age restrictions and it is a perfect location if you are just starting out or are slowing down!
Key facts
- Roof has been redone
- End unit
- $748 HOA
Tags
Property features AI
Finance
- Other: Lease restrictions apply; Furnished; Irrigation equipment included
- Financial info: Total annual fees: $8,976
- HOA & community: Monthly association fee of $748 (includes pool, structure maintenance, grounds maintenance, sewer, trash, water); Association approval required; Association name: Steve Sarang; Pool and sidewalks in community; Pets not allowed
Exterior
- Utilities: Public water; Public sewer; Cable available; High‑speed internet available; Electricity connected; Water connected; Irrigation (reclaimed water)
- Home design: Condominium; Two total stories; Unit on 2nd floor; Faces west
- Construction: Block and stucco construction; Shingle roof; Slab foundation; Building name: IMPERIAL PARK CO-OP BLDG
- Exterior features: Sidewalk
Interior
- Kitchen: Range; Range hood
- Bedrooms: 2 bedrooms
- Flooring: Carpet; Ceramic tile; Tile
- Bathrooms: 2 full bathrooms
- Heating & cooling: Central heating; Central air
- Interior features: Living room/dining room combo; Thermostat
- Laundry & utility: Common area laundry
Neighborhood map
What this means for you Summary
Snapshot
- This is a 2-bed/2.0-bath condo listed at $99k.
Deal economics
- At list price, monthly cash flow is $103 ($1k/yr) — positive.
- The deal already cash-flows at list — no discount required.
- Meets the 1% rule at list price ($2k rent vs $99k).
- Recommended offer: $87k (12.0% below list) — sets the bar for market timing.
- Cap rate 7.5% vs local median 2.9% in Clearwater — top-decile yield for the area; either an underpriced asset or a hidden risk that comps aren't pricing in. Stress-test before assuming the spread holds.
Location & tenants
- Location reads 82/100 on livability (#60 in FL, #988 nationally) — a professional / high-income tenant draw. Strengths: commute A+, housing A+, health & safety A+; Watch: schools C-, employment C-.
- Pinellas (suburban): math 51% / reading 51% proficiency, ranked #31 of 73 in FL (top 42%) — acceptable for families but not a draw, mixed tenant base, ~2y average lease.
- Market conditions: Rents falling (-5.2%/yr); 262 active listings in the ZIP; 40 comparable units currently listed for rent nearby; rentals at typical pace (median 18d on market — plan ~3-4 weeks tenant-placement turnaround); 2,676 units permitted in Pinellas County in 2024 (1,422 in 5+ unit buildings).
- This rent runs 35% of the median local income ($67k/yr) — at the standard rent-burdened threshold; future hikes will face affordability resistance.
Forward outlook
- Local home prices are declining (-3.0%/yr); year-one equity from $684 of loan paydown is wiped out by about $3k of value loss. Plan a longer hold.
- Pinellas County population projected at +14% by 2050 — modest demand growth; plan on rents tracking national, not racing it.
Negotiation context
- It's been on market 171 days — a 12% lower offer ($87k) is reasonable based on typical stale-listing flexibility.
- 7 sale attempts since 19y ago with the ask held roughly flat each time — persistent listings suggest the price (not the market) is what's stuck; bring a comps-based counter.
- Current owner paid $36k; list at $99k implies a 175% gain — meaningful room to come down on a strong offer.
Risks & watch-outs
- Watch-outs: HOA is 38% of rent.
- Climate carrying-cost: severe wind risk, 99% chance of damaging wind over 30y; extreme-heat days projected 7→24/yr by 2055 (HVAC capex compounding) — expect insurance premiums to compound above CPI over the hold.
Questions for the listing agent
- It's been on market 171 days. Have you received any prior offers? Is the seller open to a 12% concession, seller financing, or rate buy-down credit?
- Built in 1968 — when were the roof, HVAC, electrical panel, plumbing, and water heater last replaced?
- What does the HOA fee cover, when was the last increase, and are there any pending special assessments or reserve-fund shortfalls?
- Any open or pending special assessments — roof, HVAC, plumbing, elevator, façade? What's the per-unit balance and payoff schedule, and is the seller paying it off at close or rolling it to the buyer?
- Why hasn't it sold? Are there any deal-killer items the seller is aware of (foundation, flood, title, zoning, code violations)?
- Is there a deadline driving the sale (1031 exchange, divorce, estate, relocation)? That informs how much negotiation room exists.
- What's the average days-on-market for RENTAL listings here right now (not sales)? A rising rental-DOM trend means longer vacancies and softer asking-rent achievability than the comps imply.
- What's the recent tenant-quality profile in this submarket — average credit score on applications, eviction rate, late-payment / NSF rate, and stable-employment percentage? A property-management company in the area should have these aggregated.
- How much new apartment / multifamily construction is in the pipeline within 1–3 miles? Heavy new supply (>2% of stock underway) typically softens rents 12–24 months out; light construction supports rent growth.
Investment metrics
- 1% rule
- 1.98% ✓
- Cap rate
- 7.54%
- Cash-on-cash
- 4.44%
- DSCR
- 1.20
- GRM
- 4.2
CMA / ARV
No comps found within radius.
Projected returns pro-forma
-3.0% appreciation · 0.0% rent growth · sell at horizon
- IRR
- -15.8%
- Equity multiple
- 0.47×
- Total profit
- $-14,768
- Equity at exit
- $14,761
- IRR
- -26.4%
- Equity multiple
- 0.11×
- Total profit
- $-24,663
- Equity at exit
- $8,560
Cash invested: $27,720 (down + closing). Projections, not guarantees.
Landlord ↔ Tenant lean methodology
- Overall (STATE)
- 87 Strongly Landlord-Friendly
- State Florida
- 87 Strongly Landlord-Friendly · R+3
- County
- — inherits STATE
- City
- — inherits STATE
ZIP-level market 33764
- Rents YoY
- -5.2%
- Active inventory
- 262
- Price-to-rent
- 4.2×
Monthly cashflow live
- Estimated rent
- $1,964 high interval (Pro) →
- Mortgage (P&I)
- −$519
- Tax from tax record
- −$140 /mo · $1,686/yr
- Insurance
- −$41
- HOA
- −$748
- Vacancy / Maint / Mgmt
- −$412
- Net cashflow
- $103
Break-even live
Sensitivity live
| Price | -10% $159 | -5% $131 | +0% $103 | +5% $75 | +10% $46 |
|---|---|---|---|---|---|
| Rent | -10% $-53 | -5% $25 | +0% $103 | +5% $180 | +10% $258 |
| Rate | -1.0pp $152 | -0.5pp $128 | base $103 | +0.5pp $77 | +1.0pp $51 |
UW: 25.0% down · 7.5% · 30yr · 1.5% tax · 5.0% vac · 8.0% maint · 8.0% mgmt
Financing live
Cash to close
- Down payment
- $24,750
- Closing costs
- $2,970
- Reserves months
- —
- Total cash needed
- —
Loan-product check · same deal, 3 products live
Conventional
25% down · 7.5% · 30yr
- Down + closing
- —
- Monthly P&I
- —
- Monthly cashflow
- —
- DSCR
- —
- Eligible?
- —
Personal DTI + credit; lowest rate.
DSCR
20% down · 8.5% · 30yr
- Down + closing
- —
- Monthly P&I
- —
- Monthly cashflow
- —
- DSCR
- —
- Eligible?
- —
No personal income docs; deal must DSCR.
Hard money
10% down · 12.0% · 12mo
- Down + closing
- —
- Monthly P&I
- —
- Monthly cashflow
- —
- DSCR
- —
- Eligible?
- —
Short-term bridge; refi at stabilization.
Rent comps 40 comps
| Address | Beds | Baths | Sqft | Rent | $/sqft | DOM | Units | Dist |
|---|---|---|---|---|---|---|---|---|
| 2100 Nursery Rd Clearwater, FL | 1.0–2.0 | 1.0–2.0 | 910 | $1,750 | $1.92 | 4d | 10 | 0.51mi |
| 2102 Nursery Rd Unit 2 Clearwater, FL | 2.0 | 2.0 | 960 | $1,555 | $1.62 | 15d | 1 | 0.60mi |
| 2236 Morningside Dr Clearwater, FL | 2.0 | 1.5 | 902 | $2,200 | $2.44 | 5d | 1 | 0.61mi |
| 1433 S Belcher Rd Clearwater, FL | 1.0–2.0 | 1.0–2.0 | 748 | $2,450 | $3.27 | 20d | 2 | 0.62mi |
| 1433 S Belcher Rd Unit F9 Clearwater, FL | 2.0 | 2.0 | 855 | $2,450 | $2.87 | 3d | 1 | 0.66mi |
| 2159 Nursery Rd Clearwater, FL | 1.0–3.0 | 1.0–2.0 | 870 | $1,481 | $1.70 | 2d | 10 | 0.67mi |
| 2066 Druid Park Dr N Clearwater, FL | 2.0 | 2.0 | 1248 | $3,095 | $2.48 | 24d | 1 | 0.70mi |
| 2025 Rogers St Clearwater, FL | 1.0–3.0 | 1.0–2.0 | 985 | $1,874 | $1.90 | 11d | 10 | 0.71mi |
| 1550 S Belcher Rd Clearwater, FL | 1.0 | 1.0 | 825 | $1,350 | $1.64 | 5d | 1 | 0.73mi |
| 2168 Druid Rd E Clearwater, FL | 1.0–3.0 | 1.0–2.0 | 1049 | $2,532 | $2.41 | 4d | 20 | 0.73mi |
| 1192 S Duncan Ave Clearwater, FL | 2.0 | 2.0 | 1395 | $2,500 | $1.79 | 5d | 1 | 0.84mi |
| 411 S Nimbus Ave Unit 3 Clearwater, FL | 1.0 | 1.0 | 700 | $1,395 | $1.99 | 18d | 1 | 0.85mi |
| 1653 Bravo Dr Clearwater, FL | 1.0 | 1.0 | 850 | $2,200 | $2.59 | 5d | 1 | 0.85mi |
| 2225 Nursery Rd Clearwater, FL | 2.0 | 1.0–2.0 | 802 | $1,850 | $2.31 | 25d | 1 | 0.86mi |
| 311 S Arcturas Ave Unit 3 Clearwater, FL | 1.0 | 1.0 | 775 | $1,200 | $1.55 | 11d | 1 | 0.92mi |
| 310 S Arcturas Ave Unit 3 Clearwater, FL | 2.0 | 1.0 | 840 | $1,599 | $1.90 | 25d | 1 | 0.93mi |
| 518 Florida Ave Clearwater, FL | 3.0 | 1.0 | 990 | $1,795 | $1.81 | 5d | 1 | 0.95mi |
| 2207 Belleair Rd Unit B4 Clearwater, FL | 2.0 | 1.0 | 857 | $1,625 | $1.90 | 15d | 1 | 0.96mi |
| 2207 Belleair Rd Unit B7 Clearwater, FL | 2.0 | 1.0 | 857 | $1,800 | $2.10 | 20d | 1 | 0.96mi |
| 1903 Rainbow Dr Unit 10 Clearwater, FL | 2.0 | 1.0 | 850 | $1,500 | $1.76 | 25d | 1 | 0.97mi |
| 1719 Turner St Clearwater, FL | 2.0 | 2.0 | 900 | $2,200 | $2.44 | 21d | 1 | 0.99mi |
| 1624 Fruitwood Dr Clearwater, FL | 2.0 | 2.0 | 1298 | $2,500 | $1.93 | 25d | 1 | 1.00mi |
| 2346 Druid Rd #1106 Clearwater, FL | 2.0 | 2.0 | 1008 | $1,495 | $1.48 | 17d | 1 | 1.00mi |
| 2430 Harn Blvd Unit 14 Clearwater, FL | 1.0 | 1.0 | 725 | $1,400 | $1.93 | 25d | 1 | 1.05mi |
| 2430 Harn Blvd Unit 7 Clearwater, FL | 1.0 | 1.0 | 725 | $1,500 | $2.07 | 5d | 1 | 1.05mi |
| 1330 Moreland Dr Clearwater, FL | 2.0 | 2.0 | 1192 | $2,125 | $1.78 | 25d | 3 | 1.06mi |
| 2465 Brentwood Dr Clearwater, FL | 3.0 | 2.0 | 1301 | $2,550 | $1.96 | 25d | 1 | 1.08mi |
| 1657 S Lake Dr Unit 3 Clearwater, FL | 2.0 | 2.0 | 1250 | $1,550 | $1.24 | 18d | 1 | 1.09mi |
| 1536 Illinois Rd Clearwater, FL | 2.0 | 1.0 | 1440 | $2,200 | $1.53 | 5d | 1 | 1.16mi |
| 533 Yelvington Ave Clearwater, FL | 1.0 | 1.0 | 812 | $1,550 | $1.91 | 25d | 1 | 1.20mi |
| 1524 Lakeview Rd Clearwater, FL | 2.0 | 2.0 | 1100 | $1,395 | $1.27 | 25d | 1 | 1.21mi |
| 25 N Belcher Rd Clearwater, FL | 1.0–2.0 | 1.0–2.0 | 780 | $2,026 | $2.60 | 3d | 12 | 1.22mi |
| 2348 Shelley St #9 Clearwater, FL | 2.0 | 1.0 | 950 | $2,200 | $2.32 | 25d | 1 | 1.23mi |
| 1520 Jeffords St Clearwater, FL | 1.0–2.0 | 1.0 | 645 | $1,500 | $2.33 | 25d | 1 | 1.24mi |
| 1657 S Lake Ave Clearwater, FL | 2.0 | 2.0 | 1250 | $1,550 | $1.24 | 18d | 1 | 1.25mi |
| 618 S Crest Ave Clearwater, FL | 3.0 | 1.0 | 997 | $2,500 | $2.51 | 5d | 1 | 1.28mi |
| 2381 Chaucer St Clearwater, FL | 2.0 | 1.0 | 1000 | $1,950 | $1.95 | 3d | 1 | 1.28mi |
| 2370 Chaucer St Clearwater, FL | 3.0 | 1.0 | 1100 | $2,500 | $2.27 | 5d | 1 | 1.29mi |
| 2525 Harn Blvd #3 Clearwater, FL | 2.0 | 2.5 | 1252 | $1,899 | $1.52 | 25d | 1 | 1.32mi |
| 2505 Harn Blvd #1 Clearwater, FL | 3.0 | 2.5 | 1429 | $2,400 | $1.68 | 5d | 1 | 1.36mi |
HOA detail condo
- Monthly dues
- $748 · $8,976/yr
- Assessments
- None detected in remarks — confirm with the listing agent.
Listing history 24 events
-
2026-06-18days on market $99,000 Active 171 DOM
-
2026-06-17days on market $99,000 Active 170 DOM
-
2026-06-16days on market $99,000 Active 169 DOM
-
2026-06-15days on market $99,000 Active 168 DOM
-
2026-06-13pricedays on market $99,000 Active 166 DOM
-
2026-06-09days on market $99,500 Active 162 DOM
-
2026-06-08days on market $99,500 Active 161 DOM
-
2026-06-07days on market $99,500 Active 160 DOM
-
2026-06-04days on market $99,500 Active 157 DOM
-
2026-06-03days on market $99,500 Active 156 DOM
-
2026-06-01days on market $99,500 Active 154 DOM
-
2026-05-31days on market $99,500 Active 153 DOM
-
2026-05-11price $99,500
-
2026-04-02status Active
-
2026-02-06status Pending
-
2025-11-04$99,900 Active
-
2023-01-10historical
-
2022-11-11$138,000 Active
-
2011-02-18soldstatus $36,000 568-char remark
Show marketing remark (568 chars)
Located just minutes from shopping, restaurants and the Gulf Beaches, this corner unit is completely move in ready. It has new paint and carpet. Best of all it has the best view of the lake of all the units in the complex. The association has upgraded all the windows and screen doors and has painted the outside. The Co-op has been in existence since the 70's and is in excellent financial shape. All the units are wholly owned and there are no foreclosures. There are no age restrictions and it is a perfect location if you are just starting out or are slowing down!
-
2010-10-21$49,000 568-char remark
Show marketing remark (568 chars)
Located just minutes from shopping, restaurants and the Gulf Beaches, this corner unit is completely move in ready. It has new paint and carpet. Best of all it has the best view of the lake of all the units in the complex. The association has upgraded all the windows and screen doors and has painted the outside. The Co-op has been in existence since the 70's and is in excellent financial shape. All the units are wholly owned and there are no foreclosures. There are no age restrictions and it is a perfect location if you are just starting out or are slowing down!
-
2008-11-06$69,500
-
2008-07-03historical
-
2008-06-28$79,900
-
2007-12-05$79,900
ⓘ Source: listings_history table (triggers on properties + properties_extension) + one-shot
backfill from property_details.listing_events for pre-trigger history.
Tax reassessment forecast FL · Resets to sale price
- Current annual tax
- $1,686 · $140/mo
- Projected year-2 tax
- $1,686 · $140/mo
- Expected delta
- $0/yr ($0/mo · 0.0%)
ⓘ Screening estimate from a state-policy table — verify with the county assessor before closing.
Climate risk First Street
- Flood 1/10 Low FEMA zone X (unshaded) · 0% chance over 30 yrs
- Wildfire 1/10 Low
- Heat 10/10 Extreme 7 d/yr ≥107°F today · 24 d/yr by 30 yrs out
- Wind 10/10 Extreme 99% chance of damaging wind over 30 yrs
- Air quality 3/10 Moderate 2 unhealthy d/yr today · 3 by 30 yrs out
Nearby sold comps map
Loading sold comps map…
Walkable amenities ~0.75 mi
Loading nearby amenities…
Taxation est. · year 1
- Rental income
- $23,566
- − Mortgage interest
- −$5,546
- − Property taxes
- −$1,686
- − Insurance
- −$495
- − Repairs & maintenance
- −$1,885
- − Management
- −$1,885
- − HOA
- −$8,976
- − Depreciation
- −$2,880
- Taxable income
- $213
- Est. tax owed @ 24.0%
- −$51
- After-tax cash flow
- $1,179/yr
For passive investors: Depreciation is non-cash, so a rental often shows a tax loss while cash-flowing — sheltering income. Rental losses are passive: they offset passive income freely, and up to $25,000/yr can offset ordinary (W-2) income if you actively participate and your MAGI is under $100k (phasing out to $0 by $150k); unused losses carry forward. On sale, claimed depreciation is recaptured at up to 25%, and gains may owe capital-gains tax (a 1031 exchange can defer both). Figures are a year-1 estimate at your 24.0% rate — not tax advice; consult a CPA.
Schools (NCES district)
- District
- Pinellas
- NCES district ID
- 1201560
- Math proficiency
- 51% ▼ -5.00%
- Reading proficiency
- 51% ▼ -3.00%
- Median HH income
- $46,270
- Composite
- 43.27/100
- National rank
- #3046
- State rank
- #31 of 73 in FL
Livability — Clearwater
- Score
- 82/100
- State rank
- #60
- US rank
- #988
Category grades
Schools grade is shown separately in the Schools card above.
Census & demographics
- Census place
- Clearwater, FL
- County
- Pinellas County · 939,478 people
- City population
- 170,933
- Metro
- Tampa-St. Petersburg-Clearwater, FL
- Population (ZIP)
- 27,311
- Household income
- $67,256
- Rent vs Own
- Severe rent burden
- 1118.0
Population outlook (Pinellas County) Hauer SSP2
- Today (2025)
- 1,027,532 people
- By 2030
- 1,063,586 · +3.5%
- By 2040
- 1,125,020 · +9.5%
- By 2050
- 1,168,637 · +13.7%
- By 2075
- 1,265,188 · +23.1%
- By 2100
- 1,260,357 · +22.7%
Race, ethnicity, and origin ACS 2023
- Neighborhood character
- Predominantly White (76%)
- Race & ethnicity
- White 76% Hispanic / Latino 13% Two or more races 8% Asian 4% Black 2%
- Hispanic origin (detail)
- Mexican 2% Puerto Rican 3% Cuban 2%
- Common ancestry
- Romanian 4% Lithuanian 3% German 2%
- Foreign-born
- 14% · Canada, Jamaica, Vietnam
- Languages at home
- 80% English-only · Spanish 10% Russian/Polish/Slavic 4% Other Indo-European 2%
Political lean MEDSL · Pinellas
- 2024 margin
- Lean R (+5.2) · D 46.9% · R 52.1%
- 2008→2024 swing
- -13.5pp toward R · 2008: 8.3pp · 2024: -5.2pp
- All cycles
- 2024: R+5.2 2020: D+0.2 2016: R+1.1 2012: D+5.6 2008: D+8.3
Not yet ingested
- Civics
- —
Market trends
- HPI YoY
- ▼ -350.08%
- Current HPI
- 315.4133
- Rent YoY
- ▼ -5.24%
- Metro
- Tampa-St. Petersburg-Clearwater, FL
- State GDP YoY
- ▲ 3.28%
- F500 in state
- 36
Industry mix (Fortune 500 HQ in FL)
| Industry | F500 HQs | Revenue |
|---|---|---|
| Industrial Technology | 2 | $29B |
|
||
| Insurance | 2 | $17B |
|
||
| Retail | 1 | $60B |
|
||
| Technology Distribution | 1 | $58B |
|
||
| Homebuilding | 1 | $35B |
|
||
| Technology Manufacturing | 1 | $35B |
|
||
Price history
+24.5% since first listed12 events — show timeline
- 2026-05-11 Price Changed $99,500 Stellar MLS as Distributed by MLS Grid
- 2026-04-02 Relisted — Stellar MLS as Distributed by MLS Grid
- 2026-02-06 Pending — Stellar MLS as Distributed by MLS Grid
- 2025-11-04 Listed $99,900 Stellar MLS as Distributed by MLS Grid
- 2023-01-10 Listing Removed — Stellar MLS as Distributed by MLS Grid
- 2022-11-11 Listed $138,000 Stellar MLS as Distributed by MLS Grid
- 2011-02-18 Sold (MLS) $36,000 Stellar MLS as Distributed by MLS Grid
- 2010-10-21 Listed $49,000 Stellar MLS as Distributed by MLS Grid
- 2008-11-06 Listed $69,500 Stellar MLS as Distributed by MLS Grid
- 2008-07-03 Listing Removed — Stellar MLS as Distributed by MLS Grid
- 2008-06-28 Listed $79,900 Stellar MLS as Distributed by MLS Grid
- 2007-12-05 Listed $79,900 Stellar MLS as Distributed by MLS Grid
Property tax history
+9.4%/yrLatest (2025): $1,686 · +6.2% YoY. Source: county tax records.
Cash-flow waterfall
monthlySold comps — $/sqft
last 12 mo · ≤1 miLoading sold comps…