 Duplex
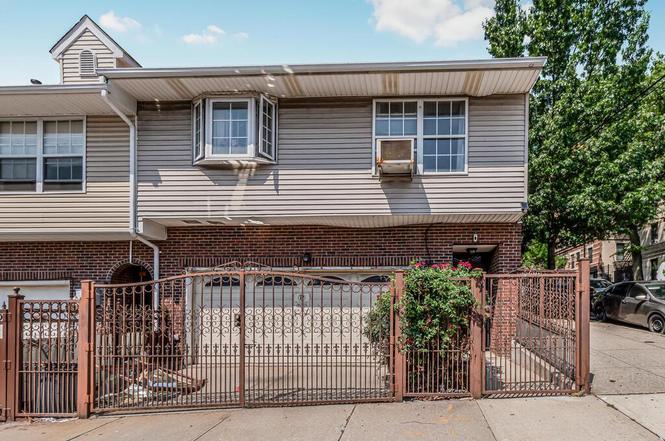
1567 Longfellow Ave · New York, NY
Flood risk 1/10 · Minimal
- FEMA flood zone
- X (unshaded)
- Chance of flooding over 30 yrs
- 0.0%
- Est. flood insurance / yr
- $507 – $1,088
Fire risk 1/10 · Minimal
- Est. fire insurance / yr
- $691 – $1,283
Heat risk 7/10 · Major
- Hot days now (above 99°F)
- 7 days/yr
- Hot days in 30 yrs
- 15 days/yr
Wind risk 6/10 · Moderate
- Chance of severe wind over 30 yrs
- 27.0%
Air-quality risk 4/10 · Minor
- Unhealthy air days now
- 5 days/yr
- Unhealthy air days in 30 yrs
- 6 days/yr
Risk factors via First Street. Map © Google.
Why this score? — see what drove the C grade
The composite is a weighted blend of 9 inputs, each scored 0–100. Each bar is that input's sub-score; the figure is the points it added to the 100-point composite (weight × sub-score).
- ARV discount +15.0/15.0
- Cash flow +14.4/30.0
- Appreciation +8.7/10.0
- Schools +5.0/10.0
- DSCR +4.4/10.0
- Livability +3.8/5.0
- 1% rule +3.4/10.0
- Rent growth +2.5/5.0
- Condition / age +2.5/5.0
$725,000
🖨 Deal sheet 📄 Offer letter ✓ Due diligence
Multi-family units
County records classify this as Multi-Family (2-4 Unit). Listing-text estimate: 2 units. confirmed
Listing remarks
BACK ON MARKET DEAL FEEL THROUGH- GREAT INVESTMENT OPPORTUNITY 2 FAMILY HOME SEMI-ATTACHED CORNER PROPERTY, LOCATED IN THE CLAREMONT VILLAGE SECTION OF THE BRONX. THIS PROPERTY IS FULLY VACANT THIS HOME WAS BUILT IN 1995 HAS ITS ORIGINAL OWNERS. THIS HOME FEATURES 1 BEDROOM WITH FULL BATH WITH WASHER AND DRYER HOOK UP IN THE FIRST UNIT. THE 2ND UNIT FEATURES A 3 BEDROOM 1 FULL BATH SPLIT LEVEL DUPLEX APARTMENT WITH SKLYLIGHTS IN THE KITCHEN AND BEDROOM , ALSO FEATURES WASHER AND DRYER HOOK UP. THERE IS A 2 CAR INDOOR ATTACHED GARAGE AND DRIVEWAY, WHICH IS FENCED OFF. THIS HOME ALSO FEATURES A LARGE BACK YARD WITH SIDE PRIVATE FENCED ENTRANCE FOR ENTERTAINMENT PURPOSES AND FAMILY GATHERING
Key facts
- 2 family home
- Skylights in kitchen
- Skylights in bedroom
Tags
Neighborhood map
What this means for you Summary
Snapshot
- This is a 2 × 2-bed/1.0-bath units multifamily listed at $725k.
Deal economics
- At list price, monthly cash flow is $145 ($2k/yr) — positive. Per door: $72/mo.
- The deal already cash-flows at list — no discount required.
- To meet the 1% rule (rent ≥ 1% of price), the offer needs to be $612k (15.6% below list).
- Recommended offer: $612k (15.6% below list) — sets the bar for 1% rule.
- Cap rate 6.5% vs local median 2.6% in New York — top-decile yield for the area; either an underpriced asset or a hidden risk that comps aren't pricing in. Stress-test before assuming the spread holds.
Location & tenants
- Location reads 75/100 on livability (#268 in NY, #4,188 nationally) — a middle-class / working-renter tenant base. Strengths: amenities A+, commute A+, health & safety A; Watch: crime F, cost of living F.
- Market conditions: 78 active listings in the ZIP; lower-income renter base — watch delinquency; 6,929 units permitted in Bronx County in 2024 (6,829 in 5+ unit buildings).
- At $6,118/mo this rent would consume 202% of the median local household income ($36k/yr) (locally 7852% of renters already pay >50% of income on rent) — very limited rent-growth headroom before tenants either downsize or default.
Forward outlook
- In year one you build about $59k of equity ($5k loan paydown + $54k appreciation (7.5% local appreciation)).
- Bronx County population projected at +21% by 2050 — long-run rental-demand tailwind backs the buy-and-hold thesis.
- At projected returns (7.5% appreciation + 3.0% rent growth), your $203k cash investment doubles in ~4 years — after that, you're playing with house money.
- By year 2, paydown + projected appreciation supports a ~$95k cash-out refi (75% LTV) — recoverable capital for the next deal without selling this one.
Negotiation context
- It's been on market 62 days — a 6% lower offer ($682k) is reasonable based on typical stale-listing flexibility.
- 4 sale attempts since 8y ago with the ask held roughly flat each time — persistent listings suggest the price (not the market) is what's stuck; bring a comps-based counter.
- Current owner paid $220k; list at $725k implies a 229% gain — meaningful room to come down on a strong offer.
Risks & watch-outs
- Climate carrying-cost: major wind risk, 27% chance of damaging wind over 30y; extreme-heat days projected 7→15/yr by 2055 (HVAC capex compounding) — expect insurance premiums to compound above CPI over the hold.
Questions for the listing agent
- It's been on market 62 days. Have you received any prior offers? Is the seller open to a 16% concession, seller financing, or rate buy-down credit?
- Can we see the unit-by-unit rent roll, current vacancy, and any below-market leases? What's the average tenancy length?
- What capital expenditures (roof, boiler, parking lot, exteriors) have been made in the last 5 years, and what's planned in the next 2?
- Why hasn't it sold? Are there any deal-killer items the seller is aware of (foundation, flood, title, zoning, code violations)?
- Is there a deadline driving the sale (1031 exchange, divorce, estate, relocation)? That informs how much negotiation room exists.
- Schools are B-rated — typically a magnet for longer-tenancy family renters. What's the average tenant stay here, and is there a school-zone premium baked into asking?
- Crime grade is F in this area — have there been break-ins, vandalism, or insurance claims at this property in the last 3 years? What carrier currently insures it and at what premium?
- What's the average days-on-market for RENTAL listings here right now (not sales)? A rising rental-DOM trend means longer vacancies and softer asking-rent achievability than the comps imply.
- What's the recent tenant-quality profile in this submarket — average credit score on applications, eviction rate, late-payment / NSF rate, and stable-employment percentage? A property-management company in the area should have these aggregated.
- How much new apartment / multifamily construction is in the pipeline within 1–3 miles? Heavy new supply (>2% of stock underway) typically softens rents 12–24 months out; light construction supports rent growth.
Investment metrics
- 1% rule
- 0.84% ✗
- Cap rate
- 6.53%
- Cash-on-cash
- 0.85%
- DSCR
- 1.04
- GRM
- 9.9
CMA / ARV
- ARV (on-the-fly)
- $943,600
- Comps found
- 6
Show comp detail 6 sales within ~0.75 mi
| Address | Dist | Beds/Ba | Sqft | Sold | Price | $/sf | Match |
|---|---|---|---|---|---|---|---|
| 1238 Colgate Ave | 0.38mi | 5/2.0 (+1) | 2,802 (+0%) | 2mo | $835,000 | $298 | 76 |
| 1333 Bronx River Ave | 0.26mi | 5/2.0 (+1) | 2,600 (-7%) | 4mo | $875,000 | $337 | 67 |
| 1012 E 172 St | 0.14mi | 4/2.0 | 2,400 (-14%) | 11mo | $795,000 | $331 | 61 |
| 1323 Elder Ave | 0.33mi | 5/3.0 (+1) | 2,560 (-9%) | 15mo | $526,000 | $205 | 49 |
| 1568 Longfellow Ave | 0.02mi | 5/3.0 (+1) | 2,400 (-14%) | 22mo | $840,000 | $350 | 48 |
| 818 E 179th St | 0.71mi | 5/4.0 (+1) | 2,725 (-3%) | 15mo | $950,000 | $349 | 37 |
Match score weights: distance 35% · size 25% · config 20% · recency 20%. Top-matched comps best support the ARV.
Projected returns pro-forma
7.46% appreciation · 3.0% rent growth · sell at horizon
- IRR
- 19.4%
- Equity multiple
- 2.39×
- Total profit
- $283,111
- Equity at exit
- $524,578
- IRR
- 18.3%
- Equity multiple
- 5.01×
- Total profit
- $814,318
- Equity at exit
- $1,017,221
Cash invested: $203,000 (down + closing). Projections, not guarantees.
Landlord ↔ Tenant lean methodology
- Overall (CITY)
- 0 Strongly Tenant-Friendly
- State New York
- 15 Strongly Tenant-Friendly · D+10
- County
- — inherits STATE
- City New York
- 0 Strongly Tenant-Friendly · D+34
ZIP-level market 10460
- Home prices YoY
- 3.5%
- Active inventory
- 78
- Price-to-rent
- 19.8×
Monthly cashflow live
- Estimated rent
- $6,118 medium interval (Pro) →
- Mortgage (P&I)
- −$3,802
- Tax from tax record
- −$585 /mo · $7,015/yr
- Insurance
- −$302
- HOA
- −$0
- Vacancy / Maint / Mgmt
- −$1,285
- Net cashflow
- $145
Break-even live
2-unit breakdown (identical units grouped — click to expand)
| Units | Beds | Baths | Est. rent |
|---|---|---|---|
| 2× units | 2 | 1 | $6,118 |
| #1 | 2 | 1 | $3,059 |
| #2 | 2 | 1 | $3,059 |
| Total (2 units) | $6,118 | ||
UW: 25.0% down · 7.5% · 30yr · 1.5% tax · 5.0% vac · 8.0% maint · 8.0% mgmt
Financing live
Cash to close
- Down payment
- $181,250
- Closing costs
- $21,750
- Reserves months
- —
- Total cash needed
- —
Loan-product check · same deal, 3 products live
Conventional
25% down · 7.5% · 30yr
- Down + closing
- —
- Monthly P&I
- —
- Monthly cashflow
- —
- DSCR
- —
- Eligible?
- —
Personal DTI + credit; lowest rate.
DSCR
20% down · 8.5% · 30yr
- Down + closing
- —
- Monthly P&I
- —
- Monthly cashflow
- —
- DSCR
- —
- Eligible?
- —
No personal income docs; deal must DSCR.
Hard money
10% down · 12.0% · 12mo
- Down + closing
- —
- Monthly P&I
- —
- Monthly cashflow
- —
- DSCR
- —
- Eligible?
- —
Short-term bridge; refi at stabilization.
Listing history 10 events
-
2026-03-25status Pending
-
2026-02-24price $725,000
-
2026-01-22$749,000 Active
-
2026-01-13status Active
-
2025-09-05status Pending
-
2025-08-18$789,000 Active
-
2019-01-24historical
-
2018-11-20$575,000 Active
-
1997-04-10soldstatus $220,500
-
1995-04-06soldstatus $450,000
ⓘ Source: listings_history table (triggers on properties + properties_extension) + one-shot
backfill from property_details.listing_events for pre-trigger history.
Tax reassessment forecast NY · Partial reset (capped growth)
- Current annual tax
- $7,015 · $585/mo
- Projected year-2 tax
- $9,634 · $803/mo
- Expected delta
- +$2,619/yr (+$218/mo · 37.3%)
ⓘ Screening estimate from a state-policy table — verify with the county assessor before closing.
Climate risk First Street
- Flood 1/10 Low FEMA zone X (unshaded) · 0% chance over 30 yrs
- Wildfire 1/10 Low
- Heat 7/10 Severe 7 d/yr ≥99°F today · 15 d/yr by 30 yrs out
- Wind 6/10 Major 27% chance of damaging wind over 30 yrs
- Air quality 4/10 Moderate 5 unhealthy d/yr today · 6 by 30 yrs out
Nearby sold comps map
Loading sold comps map…
Walkable amenities ~0.75 mi
Loading nearby amenities…
Taxation est. · year 1
- Rental income
- $73,416
- − Mortgage interest
- −$40,611
- − Property taxes
- −$7,015
- − Insurance
- −$3,625
- − Repairs & maintenance
- −$5,873
- − Management
- −$5,873
- − Depreciation
- −$21,091
- Taxable loss
- −$10,673
- Est. tax savings @ 24.0%
- +$2,561
- After-tax cash flow
- $4,296/yr
For passive investors: Depreciation is non-cash, so a rental often shows a tax loss while cash-flowing — sheltering income. Rental losses are passive: they offset passive income freely, and up to $25,000/yr can offset ordinary (W-2) income if you actively participate and your MAGI is under $100k (phasing out to $0 by $150k); unused losses carry forward. On sale, claimed depreciation is recaptured at up to 25%, and gains may owe capital-gains tax (a 1031 exchange can defer both). Figures are a year-1 estimate at your 24.0% rate — not tax advice; consult a CPA.
Schools (NCES district)
No district data.
Livability — New York
- Score
- 75/100
- State rank
- #268
- US rank
- #4188
Category grades
Schools grade is shown separately in the Schools card above.
Census & demographics
- Census place
- New York, NY
- County
- Bronx County · 1,197,324 people
- City population
- 7,731,280
- Metro
- New York-Newark-Jersey City, NY-NJ-PA
- Population (ZIP)
- 59,396
- Household income
- $36,309
- Rent vs Own
- Severe rent burden
- 7852.0
Population outlook (Bronx County) Hauer SSP2
- Today (2025)
- 1,607,353 people
- By 2030
- 1,681,852 · +4.6%
- By 2040
- 1,824,421 · +13.5%
- By 2050
- 1,945,470 · +21.0%
- By 2075
- 2,187,887 · +36.1%
- By 2100
- 2,244,136 · +39.6%
Race, ethnicity, and origin ACS 2023
- Neighborhood character
- Predominantly Hispanic (65%)
- Race & ethnicity
- Hispanic / Latino 65% Black 27% Two or more races 20% White 3% Native American 1%
- Hispanic origin (detail)
- Mexican 4% Puerto Rican 23% Dominican 28%
- Foreign-born
- 33% · Canada
- Languages at home
- 38% English-only · Spanish 54% French/Haitian/Cajun 2% Other Indo-European 1%
Political lean MEDSL · Bronx
- 2024 margin
- Solid D (+45.4) · D 72.7% · R 27.3%
- 2008→2024 swing
- -32.3pp toward R · 2008: 77.8pp · 2024: 45.4pp
- All cycles
- 2024: D+45.4 2020: D+67.6 2016: D+79.1 2012: D+82.9 2008: D+77.8
Not yet ingested
- Civics
- —
Market trends
- HPI YoY
- ▲ 7.46%
- Current HPI
- 224.0425
- Rent YoY
- —
- Metro
- New York-Newark-Jersey City, NY-NJ-PA
- State GDP YoY
- ▲ 2.60%
- F500 in state
- 92
Industry mix (Fortune 500 HQ in NY)
| Industry | F500 HQs | Revenue |
|---|---|---|
| Financial Services | 10 | $950B |
|
||
| Consumer Goods | 9 | $162B |
|
||
| Insurance | 4 | $225B |
|
||
| Telecommunications | 2 | $144B |
|
||
| Pharmaceuticals | 2 | $112B |
|
||
| Media / Entertainment | 2 | $69B |
|
||
Price history
+61.1% since first listed10 events — show timeline
- 2026-03-25 Pending — OneKey® MLS as Distributed by MLS Grid
- 2026-02-24 Price Changed $725,000 OneKey® MLS as Distributed by MLS Grid
- 2026-01-22 Listed $749,000 OneKey® MLS as Distributed by MLS Grid
- 2026-01-13 Relisted — OneKey® MLS as Distributed by MLS Grid
- 2025-09-05 Pending — OneKey® MLS as Distributed by MLS Grid
- 2025-08-18 Listed $789,000 OneKey® MLS as Distributed by MLS Grid
- 2019-01-24 Listing Removed — OneKey® MLS as Distributed by MLS Grid
- 2018-11-20 Listed $575,000 OneKey® MLS as Distributed by MLS Grid
- 1997-04-10 Sold (Public Records) $220,500 Public Records
- 1995-04-06 Sold (Public Records) $450,000 Public Records
Property tax history
+12.8%/yrLatest (2025): $7,015 · +6.2% YoY. Source: county tax records.
Cash-flow waterfall
monthlySold comps — $/sqft
last 12 mo · ≤1 miLoading sold comps…