 Multi-family
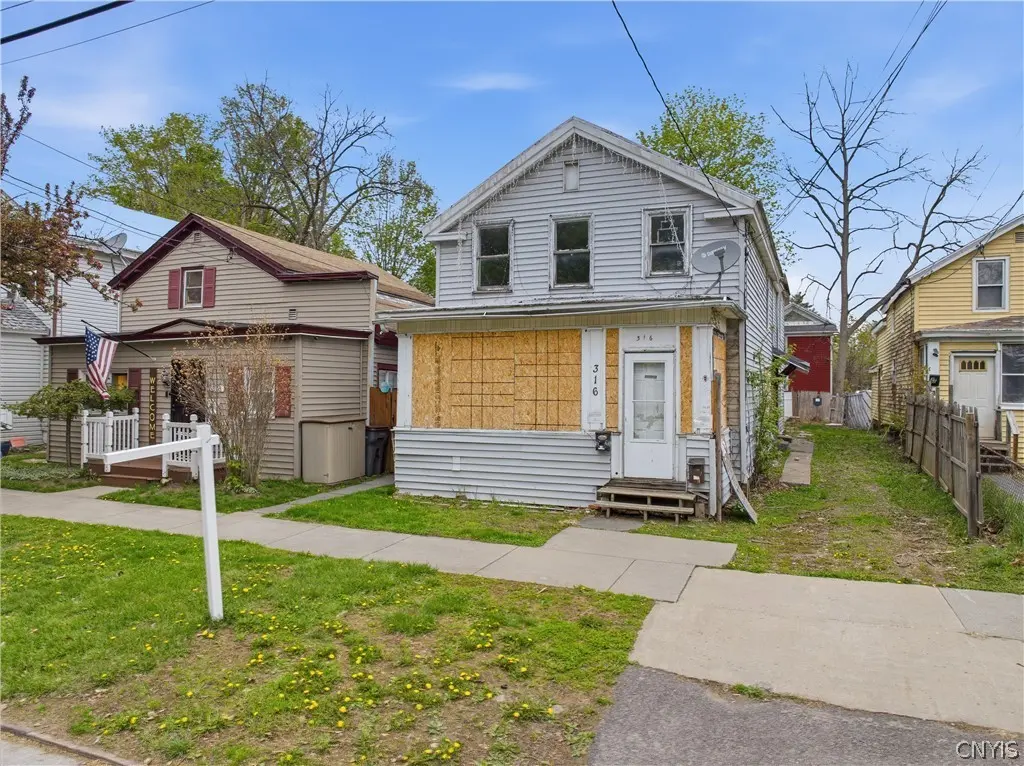
316 W Thomas St · Rome, NY
Flood risk 1/10 · Minimal
- FEMA flood zone
- X (unshaded)
- Chance of flooding over 30 yrs
- 0.0%
- Est. flood insurance / yr
- $473 – $860
Fire risk 3/10 · Minor
- Est. fire insurance / yr
- $691 – $1,283
Heat risk 3/10 · Minor
- Hot days now (above 94°F)
- 7 days/yr
- Hot days in 30 yrs
- 17 days/yr
Wind risk 1/10 · Minimal
- Chance of severe wind over 30 yrs
- —
Air-quality risk 2/10 · Minimal
- Unhealthy air days now
- 0 days/yr
- Unhealthy air days in 30 yrs
- 1 days/yr
Risk factors via First Street. Map © Google.
Why this score? — see what drove the B+ grade
The composite is a weighted blend of 9 inputs, each scored 0–100. Each bar is that input's sub-score; the figure is the points it added to the 100-point composite (weight × sub-score).
- Cash flow +30.0/30.0
- ARV discount +15.0/15.0
- DSCR +10.0/10.0
- 1% rule +9.1/10.0
- Schools +3.5/10.0
- Livability +3.2/5.0
- Rent growth +2.5/5.0
- Condition / age +2.5/5.0
- Appreciation +0.0/10.0
$125,000
🖨 Deal sheet 📄 Offer letter ✓ Due diligence
Multi-family units
County records classify this as Multi-Family (2-4 Unit). Listing-text estimate: 1 unit. estimate disagrees with records
Listing remarks
Investors and house flippers grab your gear and get in on the ground floor with this investment property in the city of Rome. With rent numbers sky high, the return on investment will be high and swift. Call to schedule your private showing today.
Key facts
- 3,485 sq ft lot
- Built 1920
- Listed 20 days
Property features AI
Finance
- Financial info: Property contains 3 total units with separate gas and electric meters for each unit; Tenants pay all utilities; Operating expense details: see remarks
Exterior
- Parking: Paved parking; Unpaved parking
- Utilities: Public water connected; Sewer connected
- Home design: 2-story multi-family building
- Construction: Vinyl siding; Shingle roof; Built (existing)
- Exterior features: Irregular residential lot; City street frontage; Lot dimensions approximately 33 x 102
Interior
- Kitchen: Eat-in kitchens in each unit
- Bedrooms: Three 2-bedroom units (each unit includes an eat-in kitchen and living room)
- Bathrooms: Three full bathrooms (one in each unit)
- Heating & cooling: Gas heating (see remarks)
- Interior features: Crawl space basement; Resale condition
- Laundry & utility: Gas water heater
Neighborhood map
What this means for you Summary
Snapshot
- This is a 6-bed/3.0-bath multifamily listed at $125k.
Deal economics
- At list price, monthly cash flow is $512 ($6k/yr) — positive.
- The deal already cash-flows at list — no discount required.
- Meets the 1% rule at list price ($2k rent vs $125k).
- Recommended offer: $123k (1.5% below list) — sets the bar for market timing.
- Cap rate 11.2% vs local median 5.6% in Rome — top-decile yield for the area; either an underpriced asset or a hidden risk that comps aren't pricing in. Stress-test before assuming the spread holds.
Location & tenants
- Location reads 64/100 on livability (#722 in NY) — a middle-class / working-renter tenant base. Strengths: cost of living A+, housing A+; Watch: health & safety C-, schools F, amenities F.
- Rome City School District (town): math 35% / reading 46% proficiency, ranked #516 of 590 in NY (top 88%) — families likely to look elsewhere, expect single-tenant / working-renter base with shorter leases.
- Market conditions: 272 active listings in the ZIP; 204 units permitted in Oneida County in 2024 (68 in 5+ unit buildings).
Forward outlook
- Local home prices are declining (-3.0%/yr); year-one equity from $864 of loan paydown is wiped out by about $4k of value loss. Plan a longer hold.
- Oneida County population projected at -12% by 2050 — secular population decline; favor cash flow + early exit over multi-decade hold.
- At projected returns (-3.0% appreciation + 3.0% rent growth), your $35k cash investment doubles in ~7 years — after that, you're playing with house money.
Negotiation context
- It's been on market 20 days — a 2% lower offer ($123k) is reasonable based on typical stale-listing flexibility.
- 4 sale attempts since 20y ago with the ask held roughly flat each time — persistent listings suggest the price (not the market) is what's stuck; bring a comps-based counter.
- Current owner paid $57k; list at $125k implies a 119% gain — meaningful room to come down on a strong offer.
Risks & watch-outs
- Watch-outs: built in 1920 — expect roof / HVAC / electrical / plumbing capex.
Questions for the listing agent
- Built in 1920 — when were the roof, HVAC, electrical panel, plumbing, and water heater last replaced?
- Is there a deadline driving the sale (1031 exchange, divorce, estate, relocation)? That informs how much negotiation room exists.
- Schools are F-rated, which usually means shorter tenancies and higher turnover. Who's the typical renter profile here, and what's been the actual vacancy rate?
- What's the average days-on-market for RENTAL listings here right now (not sales)? A rising rental-DOM trend means longer vacancies and softer asking-rent achievability than the comps imply.
- What's the recent tenant-quality profile in this submarket — average credit score on applications, eviction rate, late-payment / NSF rate, and stable-employment percentage? A property-management company in the area should have these aggregated.
- How much new apartment / multifamily construction is in the pipeline within 1–3 miles? Heavy new supply (>2% of stock underway) typically softens rents 12–24 months out; light construction supports rent growth.
Investment metrics
- 1% rule
- 1.41% ✓
- Cap rate
- 11.21%
- Cash-on-cash
- 17.56%
- DSCR
- 1.78
- GRM
- 5.9
CMA / ARV
- ARV (on-the-fly)
- $162,016
- Comps found
- 12
Show comp detail 12 sales within ~0.75 mi
| Address | Dist | Beds/Ba | Sqft | Sold | Price | $/sf | Match |
|---|---|---|---|---|---|---|---|
| 213 N Madison St | 0.25mi | 6/2.0 | 2,540 (-4%) | 9mo | $105,000 | $41 | 69 |
| 527 W Thomas St | 0.30mi | 7/3.0 (+1) | 2,560 (-4%) | 8mo | $184,500 | $72 | 69 |
| 206 Maple St | 0.46mi | 6/2.0 | 2,680 (+1%) | 8mo | $213,550 | $80 | 66 |
| 103 Stanwix St | 0.40mi | 5/2.0 (-1) | 2,569 (-3%) | 8mo | $92,700 | $36 | 60 |
| 510 Floyd Ave | 0.60mi | 6/2.0 | 2,596 (-2%) | 5mo | $154,900 | $60 | 60 |
| 121 E Bloomfield St | 0.44mi | 6/2.0 | 2,510 (-6%) | 11mo | $75,000 | $30 | 57 |
| 111 East Gdn | 0.48mi | 6/2.0 | 2,718 (+2%) | 19mo | $195,500 | $72 | 54 |
| 418 W Bloomfield St | 0.19mi | 5/2.0 (-1) | 2,378 (-10%) | 18mo | $144,000 | $61 | 49 |
| 149 River St | 0.59mi | 6/2.0 | 2,308 (-13%) | 8mo | $129,000 | $56 | 40 |
| 147 River St | 0.59mi | 6/2.0 | 2,259 (-15%) | 10mo | $25,000 | $11 | 35 |
| 504 Floyd Ave | 0.59mi | 5/2.0 (-1) | 2,366 (-11%) | 18mo | $169,950 | $72 | 30 |
| 223 E Bloomfield St | 0.58mi | 5/2.0 (-1) | 2,265 (-15%) | 18mo | $142,994 | $63 | 24 |
Match score weights: distance 35% · size 25% · config 20% · recency 20%. Top-matched comps best support the ARV.
Projected returns pro-forma
-3.0% appreciation · 3.0% rent growth · sell at horizon
- IRR
- 9.0%
- Equity multiple
- 1.35×
- Total profit
- $12,402
- Equity at exit
- $18,638
- IRR
- 18.2%
- Equity multiple
- 2.51×
- Total profit
- $52,960
- Equity at exit
- $10,808
Cash invested: $35,000 (down + closing). Projections, not guarantees.
Landlord ↔ Tenant lean methodology
- Overall (STATE)
- 15 Strongly Tenant-Friendly
- State New York
- 15 Strongly Tenant-Friendly · D+10
- County
- — inherits STATE
- City
- — inherits STATE
ZIP-level market 13440
- Home prices YoY
- -8.0%
- Active inventory
- 272
- Price-to-rent
- 5.9×
Monthly cashflow live
- Estimated rent
- $1,767 medium interval (Pro) →
- Mortgage (P&I)
- −$656
- Tax from tax record
- −$176 /mo · $2,114/yr
- Insurance
- −$52
- HOA
- −$0
- Vacancy / Maint / Mgmt
- −$371
- Net cashflow
- $512
Break-even live
UW: 25.0% down · 7.5% · 30yr · 1.5% tax · 5.0% vac · 8.0% maint · 8.0% mgmt
Financing live
Cash to close
- Down payment
- $31,250
- Closing costs
- $3,750
- Reserves months
- —
- Total cash needed
- —
Loan-product check · same deal, 3 products live
Conventional
25% down · 7.5% · 30yr
- Down + closing
- —
- Monthly P&I
- —
- Monthly cashflow
- —
- DSCR
- —
- Eligible?
- —
Personal DTI + credit; lowest rate.
DSCR
20% down · 8.5% · 30yr
- Down + closing
- —
- Monthly P&I
- —
- Monthly cashflow
- —
- DSCR
- —
- Eligible?
- —
No personal income docs; deal must DSCR.
Hard money
10% down · 12.0% · 12mo
- Down + closing
- —
- Monthly P&I
- —
- Monthly cashflow
- —
- DSCR
- —
- Eligible?
- —
Short-term bridge; refi at stabilization.
Listing history 26 events
-
2026-06-18days on market $125,000 Active 20 DOM
-
2026-06-17days on market $125,000 Active 19 DOM
-
2026-06-16days on market $125,000 Active 18 DOM
-
2026-06-15days on market $125,000 Active 17 DOM
-
2026-06-13days on market $125,000 Active 15 DOM
-
2026-06-12days on market $125,000 Active 14 DOM
-
2026-06-09days on market $125,000 Active 11 DOM
-
2026-06-08days on market $125,000 Active 10 DOM
-
2026-06-07days on market $125,000 Active 9 DOM
-
2026-06-07days on market $125,000 Active 8 DOM
-
2026-06-04days on market $125,000 Active 5 DOM
-
2026-06-02days on market $125,000 Active 4 DOM
-
2026-06-01days on market $125,000 Active 3 DOM
-
2026-05-31days on market $125,000 Active 2 DOM
-
2026-05-29$125,000 Active
-
2026-05-26historical
-
2026-04-30historical
-
2026-03-26$70,000 Active
-
2024-10-07soldstatus $57,000
-
2024-04-15historical
-
2024-03-29price $69,000
-
2024-03-26price $84,000
-
2024-03-18$99,000 Active
-
2006-09-08soldstatus $51,410
-
2006-09-07soldstatus $53,000
-
2006-04-05$54,900
ⓘ Source: listings_history table (triggers on properties + properties_extension) + one-shot
backfill from property_details.listing_events for pre-trigger history.
Tax reassessment forecast NY · Partial reset (capped growth)
- Current annual tax
- $2,114 · $176/mo
- Projected year-2 tax
- $2,114 · $176/mo
- Expected delta
- $0/yr ($0/mo · 0.0%)
ⓘ Screening estimate from a state-policy table — verify with the county assessor before closing.
Climate risk First Street
- Flood 1/10 Low FEMA zone X (unshaded) · 0% chance over 30 yrs
- Wildfire 3/10 Moderate
- Heat 3/10 Moderate 7 d/yr ≥94°F today · 17 d/yr by 30 yrs out
- Wind 1/10 Low
- Air quality 2/10 Low 0 unhealthy d/yr today · 1 by 30 yrs out
Nearby sold comps map
Loading sold comps map…
Walkable amenities ~0.75 mi
Loading nearby amenities…
Taxation est. · year 1
- Rental income
- $21,204
- − Mortgage interest
- −$7,002
- − Property taxes
- −$2,114
- − Insurance
- −$625
- − Repairs & maintenance
- −$1,696
- − Management
- −$1,696
- − Depreciation
- −$3,636
- Taxable income
- $4,434
- Est. tax owed @ 24.0%
- −$1,064
- After-tax cash flow
- $5,082/yr
For passive investors: Depreciation is non-cash, so a rental often shows a tax loss while cash-flowing — sheltering income. Rental losses are passive: they offset passive income freely, and up to $25,000/yr can offset ordinary (W-2) income if you actively participate and your MAGI is under $100k (phasing out to $0 by $150k); unused losses carry forward. On sale, claimed depreciation is recaptured at up to 25%, and gains may owe capital-gains tax (a 1031 exchange can defer both). Figures are a year-1 estimate at your 24.0% rate — not tax advice; consult a CPA.
Schools (NCES district)
- District
- Rome City School District
- NCES district ID
- 3624900
- Math proficiency
- 35% ▼ -4.00%
- Reading proficiency
- 46% ▲ 10.00%
- Median HH income
- $46,406
- Composite
- 34.52/100
- National rank
- #5178
- State rank
- #516 of 590 in NY
Livability — Rome
- Score
- 64/100
- State rank
- #722
- US rank
- #13676
Category grades
Schools grade is shown separately in the Schools card above.
Census & demographics
- Census place
- Rome, NY
- City population
- 41,418
- Population (ZIP)
- 41,273
Population outlook (Oneida County) Hauer SSP2
- Today (2025)
- 225,223 people
- By 2030
- 220,384 · -2.1%
- By 2040
- 209,071 · -7.2%
- By 2050
- 197,920 · -12.1%
- By 2075
- 175,541 · -22.1%
- By 2100
- 148,491 · -34.1%
Race, ethnicity, and origin ACS 2023
- Neighborhood character
- Predominantly White (82%)
- Race & ethnicity
- White 82% Hispanic / Latino 7% Two or more races 6% Black 4% Asian 1%
- Hispanic origin (detail)
- Mexican 1% Puerto Rican 4%
- Common ancestry
- Romanian 9% Lithuanian 4% Slovak 1%
- Foreign-born
- 3% · Canada, China
- Languages at home
- 94% English-only · Spanish 3% Other Indo-European 1%
Political lean MEDSL · Oneida
- 2024 margin
- Strong R (+21.3) · D 39.4% · R 60.6%
- 2008→2024 swing
- -15.2pp toward R · 2008: -6.1pp · 2024: -21.3pp
- All cycles
- 2024: R+21.3 2020: R+15.5 2016: R+21.1 2012: R+5.3 2008: R+6.1
Not yet ingested
- Civics
- —
Market trends
- HPI YoY
- ▼ -29.58%
- Current HPI
- 339.3589
- Rent YoY
- —
- Metro
- —
- State GDP YoY
- ▲ 2.60%
- F500 in state
- 92
Industry mix (Fortune 500 HQ in NY)
| Industry | F500 HQs | Revenue |
|---|---|---|
| Financial Services | 10 | $950B |
|
||
| Consumer Goods | 9 | $162B |
|
||
| Insurance | 4 | $225B |
|
||
| Telecommunications | 2 | $144B |
|
||
| Pharmaceuticals | 2 | $112B |
|
||
| Media / Entertainment | 2 | $69B |
|
||
Price history
+127.7% since first listed12 events — show timeline
- 2026-05-29 Listed $125,000 CNYIS
- 2026-05-26 Listing Removed — CNYIS
- 2026-04-30 Listing Removed — CNYIS
- 2026-03-26 Listed $70,000 CNYIS
- 2024-10-07 Sold (Public Records) $57,000 Public Records
- 2024-04-15 Listing Removed — WNYREIS
- 2024-03-29 Price Changed $69,000 WNYREIS
- 2024-03-26 Price Changed $84,000 WNYREIS
- 2024-03-18 Listed $99,000 WNYREIS
- 2006-09-08 Sold (MLS) $51,410 CNYIS
- 2006-09-07 Sold (Public Records) $53,000 Public Records
- 2006-04-05 Listed $54,900 CNYIS
Property tax history
+1.7%/yrLatest (2025): $2,114 · +0.3% YoY. Source: county tax records.
Cash-flow waterfall
monthlySold comps — $/sqft
last 12 mo · ≤1 miLoading sold comps…