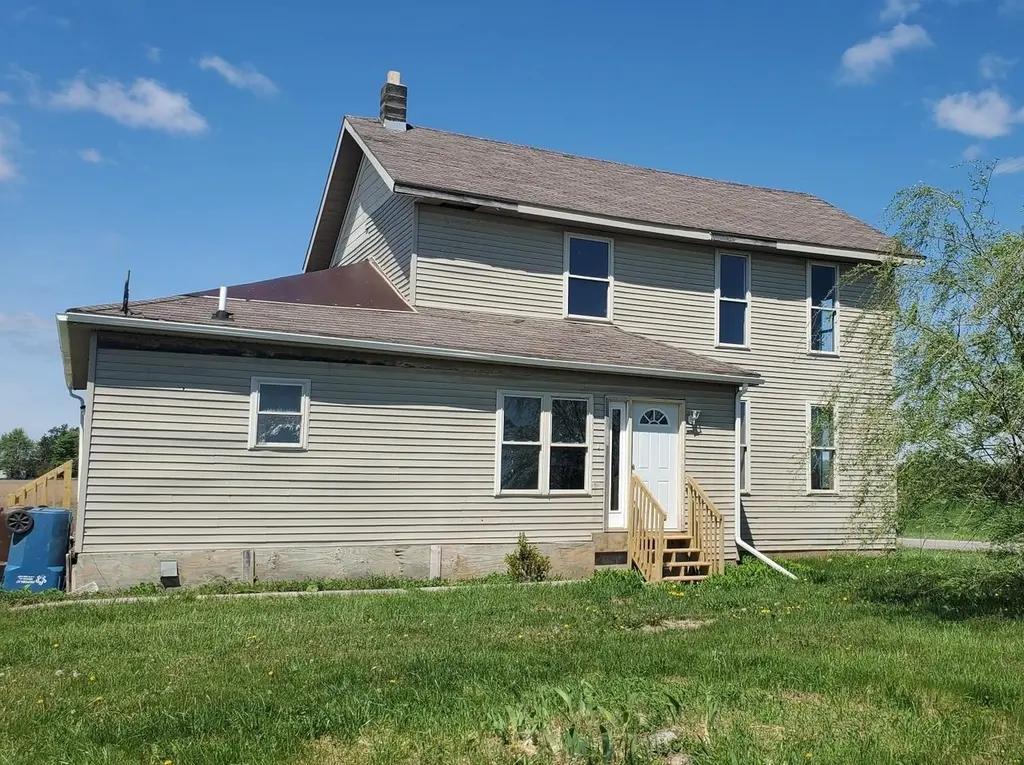
2989 N Vandecar Rd · Beal City, MI
Flood risk 1/10 · Minimal
- FEMA flood zone
- X (unshaded)
- Chance of flooding over 30 yrs
- 0.0%
- Est. flood insurance / yr
- $507 – $1,088
Fire risk 1/10 · Minimal
- Est. fire insurance / yr
- $784 – $1,456
Heat risk 2/10 · Minimal
- Hot days now (above 96°F)
- 7 days/yr
- Hot days in 30 yrs
- 14 days/yr
Wind risk 1/10 · Minimal
- Chance of severe wind over 30 yrs
- —
Air-quality risk 2/10 · Minimal
- Unhealthy air days now
- 1 days/yr
- Unhealthy air days in 30 yrs
- 2 days/yr
Risk factors via First Street. Map © Google.
Why this score? — see what drove the B grade
The composite is a weighted blend of 9 inputs, each scored 0–100. Each bar is that input's sub-score; the figure is the points it added to the 100-point composite (weight × sub-score).
- Cash flow +30.0/30.0
- 1% rule +10.0/10.0
- DSCR +10.0/10.0
- ARV discount +7.5/15.0
- Rent growth +5.0/5.0
- Schools +3.9/10.0
- Livability +3.2/5.0
- Condition / age +2.5/5.0
- Appreciation +0.0/10.0
$65,000
🖨 Deal sheet 📄 Offer letter ✓ Due diligence
Listing remarks MLS
Spacious home with great potential, situated on a desirable 1-acre corner lot in a peaceful country setting. The main level features a large kitchen, comfortable living room, inviting gathering room, primary bedroom, and a full bath - offering convenient main floor living. Upstairs, you'll find three additional bedrooms and a second full bath, providing plenty of space for family or guests. Located within the Beal City School District, this property is a fantastic opportunity to create your dream home with room to grow.
Key facts
- 1 acre corner lot
- Large kitchen
- Full bath
Tags
Property features AI
Exterior
- Utilities: Private well water; Septic sewer system; LP/Propane gas fuel; Forced air heating
- Home design: Residential 2-story home; Built in 1900; Below-grade finished area: none
- Construction: Vinyl siding exterior; Michigan basement foundation; Year built: 1900
- Exterior features: Vinyl siding; Corner lot; Cleared lot; Gravel road access
Interior
- Kitchen: Kitchen on main level (14 x 15)
- Bedrooms: One main-level bedroom (13 x 16); Three upper-level bedrooms (12 x 14; 13 wide; 9 x 18)
- Bathrooms: Two full bathrooms (one on main level, one on upper level)
- Heating & cooling: Forced air heating; LP/Propane gas fuel
- Interior features: Basement present (Michigan basement); Corner lot and cleared site
- Laundry & utility: Main-level laundry room (6 x 8)
Neighborhood map
What this means for you Summary
Snapshot
- This is a 4-bed/1.0-bath single-family listed at $65k.
Deal economics
- At list price, monthly cash flow is $640 ($8k/yr) — positive.
- The deal already cash-flows at list — no discount required.
- Meets the 1% rule at list price ($1k rent vs $65k).
- Recommended offer: $64k (1.5% below list) — sets the bar for market timing.
Location & tenants
- Location reads 65/100 on livability (#461 in MI) — a middle-class / working-renter tenant base. Strengths: cost of living A+, housing A+; Watch: schools C-, crime D+, employment D+.
- Beal City Public Schools (rural): math 40% / reading 50% proficiency, ranked #138 of 540 in MI (top 26%) — families likely to look elsewhere, expect single-tenant / working-renter base with shorter leases.
- Market conditions: Rents rising fast (+16.9%/yr); 249 active listings in the ZIP; 72 units permitted in Isabella County in 2024 (0 in 5+ unit buildings).
- This rent runs 35% of the median local income ($51k/yr) — at the standard rent-burdened threshold; future hikes will face affordability resistance.
Forward outlook
- Local home prices are declining (-3.0%/yr); year-one equity from $449 of loan paydown is wiped out by about $2k of value loss. Plan a longer hold.
- Isabella County population projected at +9% by 2050 — modest demand growth; plan on rents tracking national, not racing it.
- At projected returns (-3.0% appreciation + 8.0% rent growth), your $18k cash investment doubles in ~3 years — after that, you're playing with house money.
Negotiation context
- It's been on market 19 days — a 2% lower offer ($64k) is reasonable based on typical stale-listing flexibility.
- 2 sale attempts with the ask held roughly flat each time — persistent listings suggest the price (not the market) is what's stuck; bring a comps-based counter.
Risks & watch-outs
- Watch-outs: property tax is 3.2% of price; built in 1900 — expect roof / HVAC / electrical / plumbing capex.
Questions for the listing agent
- Built in 1900 — when were the roof, HVAC, electrical panel, plumbing, and water heater last replaced?
- Property tax is high relative to price — has the assessment been appealed recently, and will the sale trigger a re-assessment?
- Is there a deadline driving the sale (1031 exchange, divorce, estate, relocation)? That informs how much negotiation room exists.
- Crime grade is D in this area — have there been break-ins, vandalism, or insurance claims at this property in the last 3 years? What carrier currently insures it and at what premium?
- What's the average days-on-market for RENTAL listings here right now (not sales)? A rising rental-DOM trend means longer vacancies and softer asking-rent achievability than the comps imply.
- What's the recent tenant-quality profile in this submarket — average credit score on applications, eviction rate, late-payment / NSF rate, and stable-employment percentage? A property-management company in the area should have these aggregated.
- How much new for-sale + rental construction is in the pipeline within 1–3 miles? Heavy new supply typically softens prices + rents 12–24 months out; constrained supply supports both.
Investment metrics
- 1% rule
- 2.30% ✓
- Cap rate
- 18.11%
- Cash-on-cash
- 42.19%
- DSCR
- 2.88
- GRM
- 3.6
CMA / ARV
No comps found within radius.
Projected returns pro-forma
-3.0% appreciation · 8.0% rent growth · sell at horizon
- IRR
- 45.0%
- Equity multiple
- 3.10×
- Total profit
- $38,210
- Equity at exit
- $9,692
- IRR
- 53.2%
- Equity multiple
- 7.71×
- Total profit
- $122,068
- Equity at exit
- $5,620
Cash invested: $18,200 (down + closing). Projections, not guarantees.
Landlord ↔ Tenant lean methodology
- Overall (STATE)
- 62 Landlord-Friendly
- State Michigan
- 62 Landlord-Friendly · EVEN
- County
- — inherits STATE
- City
- — inherits STATE
ZIP-level market 48858
- Home prices YoY
- -31.9%
- Rents YoY
- 16.9%
- Active inventory
- 249
- Price-to-rent
- 3.6×
Monthly cashflow live
- Estimated rent
- $1,496 medium interval (Pro) →
- Mortgage (P&I)
- −$341
- Tax from tax record
- −$174 /mo · $2,091/yr
- Insurance
- −$27
- HOA
- −$0
- Vacancy / Maint / Mgmt
- −$314
- Net cashflow
- $640
Break-even live
UW: 25.0% down · 7.5% · 30yr · 1.5% tax · 5.0% vac · 8.0% maint · 8.0% mgmt
Financing live
Cash to close
- Down payment
- $16,250
- Closing costs
- $1,950
- Reserves months
- —
- Total cash needed
- —
Loan-product check · same deal, 3 products live
Conventional
25% down · 7.5% · 30yr
- Down + closing
- —
- Monthly P&I
- —
- Monthly cashflow
- —
- DSCR
- —
- Eligible?
- —
Personal DTI + credit; lowest rate.
DSCR
20% down · 8.5% · 30yr
- Down + closing
- —
- Monthly P&I
- —
- Monthly cashflow
- —
- DSCR
- —
- Eligible?
- —
No personal income docs; deal must DSCR.
Hard money
10% down · 12.0% · 12mo
- Down + closing
- —
- Monthly P&I
- —
- Monthly cashflow
- —
- DSCR
- —
- Eligible?
- —
Short-term bridge; refi at stabilization.
Listing history 11 events
-
2026-06-12status $65,000 Pending 19 DOM
-
2026-06-09days on market $65,000 Active 19 DOM
-
2026-06-08days on market $65,000 Active 18 DOM
-
2026-06-07days on market $65,000 Active 17 DOM
-
2026-06-03days on market $65,000 Active 13 DOM
-
2026-06-02days on market $65,000 Active 12 DOM
-
2026-06-01days on market $65,000 Active 11 DOM
-
2026-05-31days on market $65,000 Active 10 DOM
-
2026-05-30days on market $65,000 Active 9 DOM
-
2026-05-20$65,000 Active 525-char remark
Show marketing remark (525 chars)
Spacious home with great potential, situated on a desirable 1-acre corner lot in a peaceful country setting. The main level features a large kitchen, comfortable living room, inviting gathering room, primary bedroom, and a full bath - offering convenient main floor living. Upstairs, you'll find three additional bedrooms and a second full bath, providing plenty of space for family or guests. Located within the Beal City School District, this property is a fantastic opportunity to create your dream home with room to grow.
-
2026-05-20$65,000 Active
Show marketing remark (525 chars)
Spacious home with great potential, situated on a desirable 1-acre corner lot in a peaceful country setting. The main level features a large kitchen, comfortable living room, inviting gathering room, primary bedroom, and a full bath - offering convenient main floor living. Upstairs, you'll find three additional bedrooms and a second full bath, providing plenty of space for family or guests. Located within the Beal City School District, this property is a fantastic opportunity to create your dream home with room to grow.
ⓘ Source: listings_history table (triggers on properties + properties_extension) + one-shot
backfill from property_details.listing_events for pre-trigger history.
Tax reassessment forecast MI · Partial reset (capped growth)
- Current annual tax
- $2,091 · $174/mo
- Projected year-2 tax
- $2,091 · $174/mo
- Expected delta
- $0/yr ($0/mo · 0.0%)
ⓘ Screening estimate from a state-policy table — verify with the county assessor before closing.
Climate risk First Street
- Flood 1/10 Low FEMA zone X (unshaded) · 0% chance over 30 yrs
- Wildfire 1/10 Low
- Heat 2/10 Low 7 d/yr ≥96°F today · 14 d/yr by 30 yrs out
- Wind 1/10 Low
- Air quality 2/10 Low 1 unhealthy d/yr today · 2 by 30 yrs out
Nearby sold comps map
Loading sold comps map…
Walkable amenities ~0.75 mi
Loading nearby amenities…
Taxation est. · year 1
- Rental income
- $17,956
- − Mortgage interest
- −$3,641
- − Property taxes
- −$2,091
- − Insurance
- −$325
- − Repairs & maintenance
- −$1,436
- − Management
- −$1,436
- − Depreciation
- −$1,891
- Taxable income
- $7,135
- Est. tax owed @ 24.0%
- −$1,712
- After-tax cash flow
- $5,966/yr
For passive investors: Depreciation is non-cash, so a rental often shows a tax loss while cash-flowing — sheltering income. Rental losses are passive: they offset passive income freely, and up to $25,000/yr can offset ordinary (W-2) income if you actively participate and your MAGI is under $100k (phasing out to $0 by $150k); unused losses carry forward. On sale, claimed depreciation is recaptured at up to 25%, and gains may owe capital-gains tax (a 1031 exchange can defer both). Figures are a year-1 estimate at your 24.0% rate — not tax advice; consult a CPA.
Schools (NCES district)
- District
- Beal City Public Schools
- NCES district ID
- 2604290
- Math proficiency
- 40% ▼ -2.00%
- Reading proficiency
- 50% ▼ -3.00%
- Median HH income
- $54,247
- Composite
- 39.01/100
- National rank
- #4068
- State rank
- #138 of 540 in MI
Livability — Beal City
- Score
- 65/100
- State rank
- #461
- US rank
- #12984
Category grades
Schools grade is shown separately in the Schools card above.
Census & demographics
- Census place
- Beal City, MI
- County
- Isabella County · 42,226 people
- Metro
- Mount Pleasant, MI
- Population (ZIP)
- 42,226
- Household income
- $51,267
- Rent vs Own
- Severe rent burden
- 2381.0
Population outlook (Isabella County) Hauer SSP2
- Today (2025)
- 75,111 people
- By 2030
- 77,600 · +3.3%
- By 2040
- 79,890 · +6.4%
- By 2050
- 81,568 · +8.6%
- By 2075
- 86,602 · +15.3%
- By 2100
- 92,201 · +22.8%
Race, ethnicity, and origin ACS 2023
- Neighborhood character
- Predominantly White (81%)
- Race & ethnicity
- White 81% Two or more races 6% Hispanic / Latino 5% Native American 4% Black 3% Asian 2%
- Hispanic origin (detail)
- Mexican 3%
- Common ancestry
- Romanian 6% Slovak 3% Iranian 3%
- Foreign-born
- 4% · Canada
- Languages at home
- 94% English-only · Spanish 2% Other Indo-European 1% German/W. Germanic 0%
Political lean MEDSL · Isabella
- 2024 margin
- Lean R (+7.5) · D 45.5% · R 53.0% · Other 1.6%
- 2008→2024 swing
- -26.7pp toward R · 2008: 19.2pp · 2024: -7.5pp
- All cycles
- 2024: R+7.5 2020: R+2.5 2016: R+3.7 2012: D+9.3 2008: D+19.2
Not yet ingested
- Civics
- —
Market trends
- HPI YoY
- ▼ -96.75%
- Current HPI
- 206.1153
- Rent YoY
- ▲ 16.89%
- Metro
- Mount Pleasant, MI
- State GDP YoY
- ▲ 1.37%
- F500 in state
- 28
Industry mix (Fortune 500 HQ in MI)
| Industry | F500 HQs | Revenue |
|---|---|---|
| Automotive Parts | 3 | $48B |
|
||
| Automotive | 2 | $372B |
|
||
| Chemicals | 1 | $45B |
|
||
| Automotive Retail | 1 | $29B |
|
||
| Healthcare / Medical Devices | 1 | $23B |
|
||
| Automotive Technology | 1 | $20B |
|
||
Price history
+0.0% since first listed2 events — show timeline
- 2026-05-20 Listed $65,000 MiRealSource-MiMLS
- 2026-05-20 Listed $65,000 REALCOMP
Property tax history
+7.4%/yrLatest (2023): $2,091 · +9.8% YoY. Source: county tax records.
Cash-flow waterfall
monthlySold comps — $/sqft
last 12 mo · ≤1 miLoading sold comps…