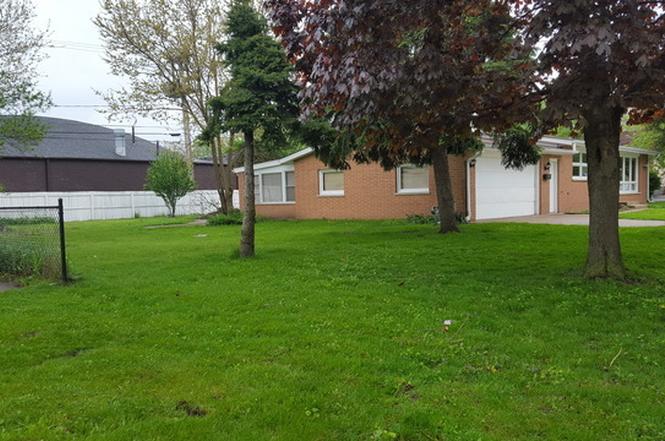
775 Greenbay Ave · Calumet City, IL
Flood risk 1/10 · Minimal
- FEMA flood zone
- X (unshaded)
- Chance of flooding over 30 yrs
- 0.0%
- Est. flood insurance / yr
- $473 – $860
Fire risk 1/10 · Minimal
- Est. fire insurance / yr
- $804 – $1,492
Heat risk 3/10 · Minor
- Hot days now (above 102°F)
- 7 days/yr
- Hot days in 30 yrs
- 15 days/yr
Wind risk 2/10 · Minimal
- Chance of severe wind over 30 yrs
- 0.0%
Air-quality risk 4/10 · Minor
- Unhealthy air days now
- 5 days/yr
- Unhealthy air days in 30 yrs
- 6 days/yr
Risk factors via First Street. Map © Google.
Why this score? — see what drove the B+ grade
The composite is a weighted blend of 9 inputs, each scored 0–100. Each bar is that input's sub-score; the figure is the points it added to the 100-point composite (weight × sub-score).
- Cash flow +30.0/30.0
- ARV discount +15.0/15.0
- 1% rule +10.0/10.0
- DSCR +10.0/10.0
- Rent growth +4.0/5.0
- Livability +3.6/5.0
- Condition / age +2.5/5.0
- Schools +1.0/10.0
- Appreciation +0.0/10.0
$119,000
🖨 Deal sheet (PDF) 📄 Offer letter ✓ Due diligence
Listing remarks MLS
Excellent, 3 Large Bedrooms Home, Well maintain, Living room W/ hardwood floors, Good size Kitchen, Additional enclosed room for your ideas, Finished basement with full bathroom, Laundry room with appliances included. Great space! Garage for 2 cars plus. Very nice size yard for gatherings, BBQ parties!!! Easy to show. 5 lots total.
Key facts
- 2 plus car garage
- Finished basement
- Total of 5 lots
Tags
Property features AI
Finance
- Other: Parcel information available for multiple parcels; Directions: Burnham to 156th St W to Greenbay (on the corner)
- HOA & community: No master association fee required
Exterior
- Parking: Attached garage (garage owned); Concrete driveway; Two parking spaces total
- Utilities: Water from Lake Michigan / public water; Public sewer (overhead sewers); Electric service available
- Home design: Detached single-family home; Split-level / bi-level design; Fee simple ownership
- Construction: Brick construction; Asphalt roof; Concrete perimeter foundation; Built approximately 41–50 years ago
- Exterior features: Patio with screened area; Corner lot; Sidewalks and street lights in neighborhood; Paved streets
Interior
- Kitchen: Kitchen on main level — 15 x 11, ceramic tile flooring, blinds and shades
- Bedrooms: Master bedroom (second level) — 13 x 11, hardwood floors, blinds and curtains/drapes; Bedroom 2 (second level) — 12 x 10, hardwood floors, blinds; Bedroom 3 (second level) — 11 x 10, hardwood floors, curtains/drapes
- Flooring: Hardwood throughout main living and bedrooms; Ceramic tile in kitchen; Other flooring in some lower-level rooms
- Bathrooms: Two full bathrooms
- Heating & cooling: Natural gas forced-air heating; Wall cooling units
- Interior features: Partially finished basement; Seven total rooms
- Laundry & utility: Laundry room (lower level) — 7 x 9
Neighborhood map
What this means for you Summary
Snapshot
- This is a 3-bed/1.5-bath single-family listed at $119k.
Deal economics
- At list price, monthly cash flow is $473 ($6k/yr) — positive.
- The deal already cash-flows at list — no discount required.
- Meets the 1% rule at list price ($2k rent vs $119k).
- Recommended offer: $108k (9.0% below list) — sets the bar for market timing.
- Cap rate 11.1% vs local median 8.3% in Calumet City — top-decile yield for the area; either an underpriced asset or a hidden risk that comps aren't pricing in. Stress-test before assuming the spread holds.
Location & tenants
- Location reads 71/100 on livability (#330 in IL) — a middle-class / working-renter tenant base. Strengths: commute A+, cost of living A+, housing A+; Watch: employment C-, schools F, crime D-.
- Thornton Fractional Twp Hsd 215 (suburban): math 9% / reading 13% proficiency, ranked #563 of 620 in IL (top 91%) — low school quality limits family demand, transient renter base, plan for 1-2y turnover.
- Market conditions: Rents rising fast (+6.2%/yr); 196 active listings in the ZIP; 7 comparable units currently listed for rent nearby; rentals leasing fast (median 12d on market — plan ~1-2 weeks tenant-placement turnaround); 6,272 units permitted in Cook County in 2024 (4,658 in 5+ unit buildings).
- This rent runs 43% of the median local income ($55k/yr) — at the standard rent-burdened threshold; future hikes will face affordability resistance.
Forward outlook
- Local home prices are declining (-3.0%/yr); year-one equity from $823 of loan paydown is wiped out by about $4k of value loss. Plan a longer hold.
- At projected returns (-3.0% appreciation + 6.2% rent growth), your $33k cash investment doubles in ~6 years — after that, you're playing with house money.
Negotiation context
- It's been on market 116 days — a 9% lower offer ($108k) is reasonable based on typical stale-listing flexibility.
- 10 sale attempts since 19y ago with the ask held roughly flat each time — persistent listings suggest the price (not the market) is what's stuck; bring a comps-based counter.
- Current owner paid $90k; 32% above their basis — modest negotiation headroom, anchor on the comps not their cost.
Risks & watch-outs
- Watch-outs: property tax is 4.2% of price.
Questions for the listing agent
- It's been on market 116 days. Have you received any prior offers? Is the seller open to a 9% concession, seller financing, or rate buy-down credit?
- Property tax is high relative to price — has the assessment been appealed recently, and will the sale trigger a re-assessment?
- Why hasn't it sold? Are there any deal-killer items the seller is aware of (foundation, flood, title, zoning, code violations)?
- Is there a deadline driving the sale (1031 exchange, divorce, estate, relocation)? That informs how much negotiation room exists.
- Schools are F-rated, which usually means shorter tenancies and higher turnover. Who's the typical renter profile here, and what's been the actual vacancy rate?
- Crime grade is D in this area — have there been break-ins, vandalism, or insurance claims at this property in the last 3 years? What carrier currently insures it and at what premium?
- What's the average days-on-market for RENTAL listings here right now (not sales)? A rising rental-DOM trend means longer vacancies and softer asking-rent achievability than the comps imply.
- What's the recent tenant-quality profile in this submarket — average credit score on applications, eviction rate, late-payment / NSF rate, and stable-employment percentage? A property-management company in the area should have these aggregated.
- How much new for-sale + rental construction is in the pipeline within 1–3 miles? Heavy new supply typically softens prices + rents 12–24 months out; constrained supply supports both.
Investment metrics
- 1% rule
- 1.66% ✓
- Cap rate
- 11.06%
- Cash-on-cash
- 17.04%
- DSCR
- 1.76
- GRM
- 5.0
CMA / ARV
- ARV (on-the-fly)
- $168,480
- Comps found
- 12
Show comp detail 12 sales within ~0.75 mi
| Address | Dist | Beds/Ba | Sqft | Sold | Price | $/sf | Match |
|---|---|---|---|---|---|---|---|
| 655 Hirsch Ave | 0.33mi | 4/1.5 (+1) | 1,686 (+4%) | 0mo | $191,000 | $113 | 72 |
| 207 156th Pl | 0.52mi | 4/2.5 (+1) | 1,625 (+0%) | 3mo | $200,000 | $123 | 64 |
| 737 Newell Ave | 0.14mi | 3/1.0 | 1,386 (-14%) | 6mo | $80,000 | $58 | 62 |
| 746 May St | 0.11mi | 3/2.0 | 1,840 (+14%) | 10mo | $192,000 | $104 | 62 |
| 616 Ingraham Ave | 0.71mi | 3/1.0 | 1,702 (+5%) | 0mo | $33,000 | $19 | 56 |
| 566 Hirsch Ave | 0.51mi | 4/2.0 (+1) | 1,734 (+7%) | 3mo | $92,500 | $53 | 55 |
| 642 Greenbay Ave | 0.34mi | 3/1.0 | 1,800 (+11%) | 11mo | $160,000 | $89 | 55 |
| 589 Superior Ave | 0.49mi | 3/1.5 | 1,439 (-11%) | 8mo | $112,500 | $78 | 52 |
| 525 Price Ave | 0.64mi | 2/1.0 (-1) | 1,684 (+4%) | 6mo | $57,754 | $34 | 51 |
| 658 Mackinaw Ave | 0.32mi | 4/2.0 (+1) | 1,383 (-15%) | 4mo | $183,000 | $132 | 50 |
| 943 Greenbay Ave | 0.36mi | 3/2.0 | 1,843 (+14%) | 12mo | $212,500 | $115 | 49 |
| 1051 Burnham Ave | 0.62mi | 3/2.0 | 1,824 (+13%) | 0mo | $230,000 | $126 | 48 |
Match score weights: distance 35% · size 25% · config 20% · recency 20%. Top-matched comps best support the ARV.
Projected returns pro-forma
-3.0% appreciation · 6.17% rent growth · sell at horizon
- IRR
- 12.7%
- Equity multiple
- 1.53×
- Total profit
- $17,566
- Equity at exit
- $17,743
- IRR
- 24.4%
- Equity multiple
- 3.50×
- Total profit
- $83,436
- Equity at exit
- $10,289
Cash invested: $33,320 (down + closing). Projections, not guarantees.
Landlord ↔ Tenant lean methodology
- Overall (STATE)
- 43 Moderately Tenant-Leaning
- State Illinois
- 43 Moderately Tenant-Leaning · D+7
- County
- — inherits STATE
- City
- — inherits STATE
ZIP-level market 60409
- Home prices YoY
- -27.6%
- Rents YoY
- 6.2%
- Active inventory
- 196
- Price-to-rent
- 5.0×
Monthly cashflow live
- Estimated rent
- $1,980 high interval (Pro) →
- Mortgage (P&I)
- −$624
- Tax from tax record
- −$418 /mo · $5,011/yr
- Insurance
- −$50
- HOA
- −$0
- Vacancy / Maint / Mgmt
- −$416
- Net cashflow
- $473
Break-even live
Sensitivity live
| Price | -10% $541 | -5% $507 | +0% $473 | +5% $440 | +10% $406 |
|---|---|---|---|---|---|
| Rent | -10% $317 | -5% $395 | +0% $473 | +5% $551 | +10% $630 |
| Rate | -1.0pp $533 | -0.5pp $503 | base $473 | +0.5pp $442 | +1.0pp $411 |
UW: 25.0% down · 7.5% · 30yr · 1.5% tax · 5.0% vac · 8.0% maint · 8.0% mgmt
Financing live
Cash to close
- Down payment
- $29,750
- Closing costs
- $3,570
- Reserves months
- —
- Total cash needed
- —
Loan-product check · same deal, 3 products live
Conventional
25% down · 7.5% · 30yr
- Down + closing
- —
- Monthly P&I
- —
- Monthly cashflow
- —
- DSCR
- —
- Eligible?
- —
Personal DTI + credit; lowest rate.
DSCR
20% down · 8.5% · 30yr
- Down + closing
- —
- Monthly P&I
- —
- Monthly cashflow
- —
- DSCR
- —
- Eligible?
- —
No personal income docs; deal must DSCR.
Hard money
10% down · 12.0% · 12mo
- Down + closing
- —
- Monthly P&I
- —
- Monthly cashflow
- —
- DSCR
- —
- Eligible?
- —
Short-term bridge; refi at stabilization.
Rent comps 7 comps
| Address | Beds | Baths | Sqft | Rent | $/sqft | DOM | Units | Dist |
|---|---|---|---|---|---|---|---|---|
| 34 Elizabeth St Calumet City, IL | 3.0 | 1.0 | 1246 | $2,400 | $1.93 | 0d | 1 | 0.82mi |
| 3 Waltham St Hammond, IN | 3.0 | 1.0 | 1200 | $1,095 | $0.91 | 26d | 1 | 0.87mi |
| 671 Saginaw Ave Calumet City, IL | 3.0 | 2.0 | 1250 | $2,276 | $1.82 | 11d | 1 | 0.95mi |
| 1312 Gordon Ave Calumet City, IL | 2.0 | 1.0 | 1134 | $1,600 | $1.41 | 8d | 1 | 1.07mi |
| 2790 E State St Apt 2E Burnham, IL | 3.0 | 2.0 | 1100 | $1,695 | $1.54 | 26d | 1 | 1.35mi |
| 617 Kane St Hammond, IN | 4.0 | 2.0 | 2146 | $2,300 | $1.07 | 0d | 1 | 1.42mi |
| 2605 E Martha Pl Chicago, IL | 2.0 | 2.0 | 1353 | $1,860 | $1.37 | 23d | 1 | 1.45mi |
Listing history 43 events
-
2026-06-08days on market $119,000 Active 116 DOM
-
2026-06-07days on market $119,000 Active 115 DOM
-
2026-06-04days on market $119,000 Active 112 DOM
-
2026-06-03days on market $119,000 Active 111 DOM
-
2026-06-02days on market $119,000 Active 110 DOM
-
2026-06-01days on market $119,000 Active 109 DOM
-
2026-05-31days on market $119,000 Active 108 DOM
-
2026-05-08status Active
-
2026-04-16historical Contingent - Continue to Show
-
2026-02-12$119,000 Active
-
2026-01-19historical
-
2026-01-06price
-
2025-11-13price
-
2025-11-13status Temporarily No Showings
-
2025-11-12historical
-
2025-10-22price
-
2025-08-03price
-
2025-07-02Active
-
2017-04-17soldstatus $90,000
-
2017-04-12soldstatus $90,000 Closed Sale 333-char remark
Show marketing remark (333 chars)
Excellent, 3 Large Bedrooms Home, Well maintain, Living room W/ hardwood floors, Good size Kitchen, Additional enclosed room for your ideas, Finished basement with full bathroom, Laundry room with appliances included. Great space! Garage for 2 cars plus. Very nice size yard for gatherings, BBQ parties!!! Easy to show. 5 lots total.
-
2017-02-14status Pending 333-char remark
Show marketing remark (333 chars)
Excellent, 3 Large Bedrooms Home, Well maintain, Living room W/ hardwood floors, Good size Kitchen, Additional enclosed room for your ideas, Finished basement with full bathroom, Laundry room with appliances included. Great space! Garage for 2 cars plus. Very nice size yard for gatherings, BBQ parties!!! Easy to show. 5 lots total.
-
2016-07-09price $89,900 333-char remark
Show marketing remark (333 chars)
Excellent, 3 Large Bedrooms Home, Well maintain, Living room W/ hardwood floors, Good size Kitchen, Additional enclosed room for your ideas, Finished basement with full bathroom, Laundry room with appliances included. Great space! Garage for 2 cars plus. Very nice size yard for gatherings, BBQ parties!!! Easy to show. 5 lots total.
-
2016-07-07price $84,900 333-char remark
Show marketing remark (333 chars)
Excellent, 3 Large Bedrooms Home, Well maintain, Living room W/ hardwood floors, Good size Kitchen, Additional enclosed room for your ideas, Finished basement with full bathroom, Laundry room with appliances included. Great space! Garage for 2 cars plus. Very nice size yard for gatherings, BBQ parties!!! Easy to show. 5 lots total.
-
2016-07-07status Reactivated 333-char remark
Show marketing remark (333 chars)
Excellent, 3 Large Bedrooms Home, Well maintain, Living room W/ hardwood floors, Good size Kitchen, Additional enclosed room for your ideas, Finished basement with full bathroom, Laundry room with appliances included. Great space! Garage for 2 cars plus. Very nice size yard for gatherings, BBQ parties!!! Easy to show. 5 lots total.
-
2016-06-10historical Contingent 333-char remark
Show marketing remark (333 chars)
Excellent, 3 Large Bedrooms Home, Well maintain, Living room W/ hardwood floors, Good size Kitchen, Additional enclosed room for your ideas, Finished basement with full bathroom, Laundry room with appliances included. Great space! Garage for 2 cars plus. Very nice size yard for gatherings, BBQ parties!!! Easy to show. 5 lots total.
-
2016-05-25$90,000 New 333-char remark
Show marketing remark (333 chars)
Excellent, 3 Large Bedrooms Home, Well maintain, Living room W/ hardwood floors, Good size Kitchen, Additional enclosed room for your ideas, Finished basement with full bathroom, Laundry room with appliances included. Great space! Garage for 2 cars plus. Very nice size yard for gatherings, BBQ parties!!! Easy to show. 5 lots total.
-
2012-03-12soldstatus $28,500
-
2012-02-28soldstatus $28,199 Closed Sale
-
2012-01-27status Pending
-
2012-01-17price $31,100 Price Change
-
2012-01-17status Price Change
-
2012-01-06status Pending
-
2011-12-14price $35,340 Price Change
-
2011-11-15price $38,000 Price Change
-
2011-11-07price $42,687 Price Change
-
2011-10-12price $45,900 Price Change
-
2011-09-15price $51,150 Price Change
-
2011-08-17$55,000 New
-
2007-10-19historical
-
2007-07-16historical
-
2007-06-27
-
2007-04-19
-
1995-10-18soldstatus $85,500
ⓘ Source: listings_history table (triggers on properties + properties_extension) + one-shot
backfill from property_details.listing_events for pre-trigger history.
Tax reassessment forecast IL · Partial reset (capped growth)
- Current annual tax
- $5,011 · $418/mo
- Projected year-2 tax
- $5,011 · $418/mo
- Expected delta
- $0/yr ($0/mo · 0.0%)
ⓘ Screening estimate from a state-policy table — verify with the county assessor before closing.
Climate risk First Street
- Flood 1/10 Low FEMA zone X (unshaded) · 0% chance over 30 yrs
- Wildfire 1/10 Low
- Heat 3/10 Moderate 7 d/yr ≥102°F today · 15 d/yr by 30 yrs out
- Wind 2/10 Low 0% chance of damaging wind over 30 yrs
- Air quality 4/10 Moderate 5 unhealthy d/yr today · 6 by 30 yrs out
Nearby sold comps map
Loading sold comps map…
Walkable amenities ~0.75 mi
Loading nearby amenities…
Taxation est. · year 1
- Rental income
- $23,763
- − Mortgage interest
- −$6,666
- − Property taxes
- −$5,011
- − Insurance
- −$595
- − Repairs & maintenance
- −$1,901
- − Management
- −$1,901
- − Depreciation
- −$3,462
- Taxable income
- $4,227
- Est. tax owed @ 24.0%
- −$1,015
- After-tax cash flow
- $4,664/yr
For passive investors: Depreciation is non-cash, so a rental often shows a tax loss while cash-flowing — sheltering income. Rental losses are passive: they offset passive income freely, and up to $25,000/yr can offset ordinary (W-2) income if you actively participate and your MAGI is under $100k (phasing out to $0 by $150k); unused losses carry forward. On sale, claimed depreciation is recaptured at up to 25%, and gains may owe capital-gains tax (a 1031 exchange can defer both). Figures are a year-1 estimate at your 24.0% rate — not tax advice; consult a CPA.
Schools (NCES district)
- District
- Thornton Fractional Twp Hsd 215
- NCES district ID
- 1738940
- Math proficiency
- 9% ▼ -3.00%
- Reading proficiency
- 13% ▼ -3.00%
- Median HH income
- $48,207
- Composite
- 10.27/100
- National rank
- #9793
- State rank
- #563 of 620 in IL
Livability — Calumet City
- Score
- 71/100
- State rank
- #330
- US rank
- #6552
Category grades
Schools grade is shown separately in the Schools card above.
Census & demographics
- Census place
- Calumet City, IL
- County
- Cook County · 4,486,803 people
- City population
- 35,100
- Metro
- Chicago-Naperville-Elgin, IL-IN-WI
- Population (ZIP)
- 35,100
- Household income
- $55,369
- Rent vs Own
- Severe rent burden
- 2415.0
Population outlook (Cook County) Hauer SSP2
- Today (2025)
- 5,347,519 people
- By 2030
- 5,357,703 · +0.2%
- By 2040
- 5,324,924 · -0.4%
- By 2050
- 5,230,762 · -2.2%
- By 2075
- 4,785,735 · -10.5%
- By 2100
- 4,188,836 · -21.7%
Race, ethnicity, and origin ACS 2023
- Neighborhood character
- Predominantly Black (74%)
- Race & ethnicity
- Black 74% Hispanic / Latino 15% White 7% Two or more races 4%
- Hispanic origin (detail)
- Mexican 14%
- Common ancestry
- Romanian 2%
- Foreign-born
- 9% · Canada
- Languages at home
- 83% English-only · Spanish 14%
Political lean MEDSL · Cook
- 2024 margin
- Solid D (+42.0) · D 70.4% · R 28.4% · Other 1.2%
- 2008→2024 swing
- -11.4pp toward R · 2008: 53.4pp · 2024: 42.0pp
- All cycles
- 2024: D+42.0 2020: D+50.3 2016: D+53.0 2012: D+49.4 2008: D+53.4
Not yet ingested
- Civics
- —
Market trends
- HPI YoY
- ▼ -75.01%
- Current HPI
- 197.2137
- Rent YoY
- ▲ 6.17%
- Metro
- Chicago-Naperville-Elgin, IL-IN-WI
- State GDP YoY
- ▲ 1.59%
- F500 in state
- 60
Industry mix (Fortune 500 HQ in IL)
| Industry | F500 HQs | Revenue |
|---|---|---|
| Insurance | 4 | $201B |
|
||
| Consumer Goods | 4 | $87B |
|
||
| Industrial Machinery | 3 | $64B |
|
||
| Healthcare | 2 | $55B |
|
||
| Retail / Pharmacy | 1 | $148B |
|
||
| Agriculture / Food | 1 | $86B |
|
||
Price history
+39.2% since first listed36 events — show timeline
- 2026-05-08 Relisted — MRED as Distributed by MLS Grid
- 2026-04-16 Contingent — MRED as Distributed by MLS Grid
- 2026-02-12 Listed $119,000 MRED as Distributed by MLS Grid
- 2026-01-19 Listing Removed — MRED as Distributed by MLS Grid
- 2026-01-06 Price Changed — MRED as Distributed by MLS Grid
- 2025-11-13 Price Changed — MRED as Distributed by MLS Grid
- 2025-11-13 Relisted — MRED as Distributed by MLS Grid
- 2025-11-12 Listing Removed — MRED as Distributed by MLS Grid
- 2025-10-22 Price Changed — MRED as Distributed by MLS Grid
- 2025-08-03 Price Changed — MRED as Distributed by MLS Grid
- 2025-07-02 Listed — MRED as Distributed by MLS Grid
- 2017-04-17 Sold (Public Records) $90,000 Public Records
- 2017-04-12 Sold (MLS) $90,000 MRED as Distributed by MLS Grid
- 2017-02-14 Pending — MRED as Distributed by MLS Grid
- 2016-07-09 Price Changed $89,900 MRED as Distributed by MLS Grid
- 2016-07-07 Price Changed $84,900 MRED as Distributed by MLS Grid
- 2016-07-07 Relisted — MRED as Distributed by MLS Grid
- 2016-06-10 Contingent — MRED as Distributed by MLS Grid
- 2016-05-25 Listed $90,000 MRED as Distributed by MLS Grid
- 2012-03-12 Sold (Public Records) $28,500 Public Records
- 2012-02-28 Sold (MLS) $28,199 MRED as Distributed by MLS Grid
- 2012-01-27 Pending — MRED as Distributed by MLS Grid
- 2012-01-17 Relisted — MRED as Distributed by MLS Grid
- 2012-01-17 Price Changed $31,100 MRED as Distributed by MLS Grid
- 2012-01-06 Pending — MRED as Distributed by MLS Grid
- 2011-12-14 Price Changed $35,340 MRED as Distributed by MLS Grid
- 2011-11-15 Price Changed $38,000 MRED as Distributed by MLS Grid
- 2011-11-07 Price Changed $42,687 MRED as Distributed by MLS Grid
- 2011-10-12 Price Changed $45,900 MRED as Distributed by MLS Grid
- 2011-09-15 Price Changed $51,150 MRED as Distributed by MLS Grid
- 2011-08-17 Listed $55,000 MRED as Distributed by MLS Grid
- 2007-10-19 Listing Removed — MRED as Distributed by MLS Grid
- 2007-07-16 Listing Removed — MRED as Distributed by MLS Grid
- 2007-06-27 Listed — MRED as Distributed by MLS Grid
- 2007-04-19 Listed — MRED as Distributed by MLS Grid
- 1995-10-18 Sold (Public Records) $85,500 Public Records
Property tax history
+0.9%/yrLatest (2023): $5,011 · +9.4% YoY. Source: county tax records.
Cash-flow waterfall
monthlySold comps — $/sqft
last 12 mo · ≤1 miLoading sold comps…