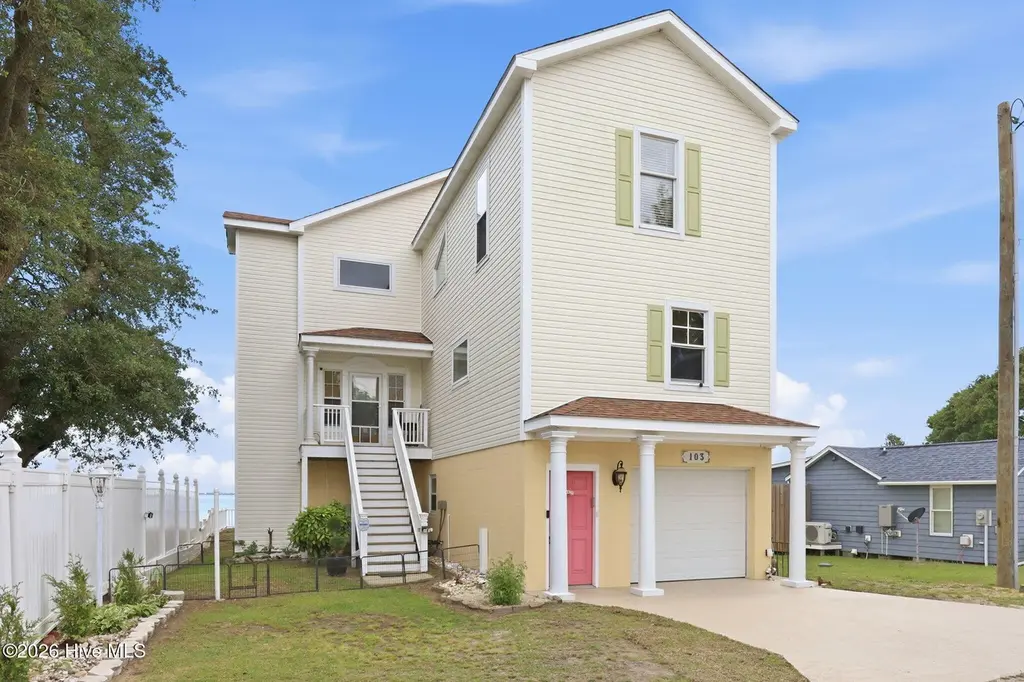
103 Waterfront Ave · Broad Creek, NC
Flood risk 8/10 · Major
- FEMA flood zone
- X (unshaded)
- Chance of flooding over 30 yrs
- 0.99%
- Est. flood insurance / yr
- $507 – $1,088
Fire risk 2/10 · Minimal
- Est. fire insurance / yr
- $906 – $1,684
Heat risk 9/10 · Severe
- Hot days now (above 102°F)
- 7 days/yr
- Hot days in 30 yrs
- 19 days/yr
Wind risk 9/10 · Severe
- Chance of severe wind over 30 yrs
- 99.0%
Air-quality risk 2/10 · Minimal
- Unhealthy air days now
- 2 days/yr
- Unhealthy air days in 30 yrs
- 2 days/yr
Risk factors via First Street. Map © Google.
Why this score? — see what drove the D+ grade
The composite is a weighted blend of 9 inputs, each scored 0–100. Each bar is that input's sub-score; the figure is the points it added to the 100-point composite (weight × sub-score).
- Cash flow +17.6/30.0
- ARV discount +7.5/15.0
- DSCR +5.5/10.0
- Schools +5.1/10.0
- 1% rule +4.7/10.0
- Livability +3.2/5.0
- Rent growth +2.5/5.0
- Condition / age +2.5/5.0
- Appreciation +0.0/10.0
$1,279,000
🖨 Deal sheet 📄 Offer letter ✓ Due diligence
Listing remarks
Welcome to this elegantly appointed 3-bedroom, 4.5-bath waterfront retreat, where timeless sophistication meets coastal charm and modern comfort. Perfectly positioned along the Intracoastal Waterway, this exceptional residence offers breathtaking water views, refined finishes, and thoughtfully designed living spaces throughout. Rich hardwood floors flow seamlessly throughout the home, complemented by upscale finishes, marble accents, imported vanities, hard-surface countertops, and an abundance of natural light that creates a warm and inviting atmosphere. The ground level features a spacious two-car garage with beautiful epoxy-coated floors, ample storage, and a finished bonus living area c
Key facts
- Open concept kitchen
- Elevator
- Walk-in closets
Tags
Property features AI
Exterior
- Parking: Attached 2-car garage; Garage faces front
- Utilities: Public water; Water connected; Septic sewer
- Home design: Single-family residence; Three or more levels; Entry level is level 2
- Construction: Built with block, wood siding and frame construction; Shingle roof; Block and concrete perimeter foundation; Property is residentially zoned (Res)
- Exterior features: Covered patio/porch; Deck; Partial vinyl fencing; On waterfront
Interior
- Kitchen: Refrigerator; Dishwasher; Electric range; Kitchen island
- Bedrooms: 5 total rooms (includes bedrooms and living spaces)
- Bathrooms: 4 full bathrooms; 1 half bathroom
- Heating & cooling: Central air conditioning; Electric heating; Heat pump
- Interior features: Walk-in closets; Vaulted ceilings; Kitchen island; Ceiling fans; Elevator
- Laundry & utility: Dedicated laundry room
Neighborhood map
What this means for you Summary
Snapshot
- This is a 3-bed/3.0-bath other listed at $1.28M.
Deal economics
- At list price, monthly cash flow is $934 ($11k/yr) — positive.
- The deal already cash-flows at list — no discount required.
- To meet the 1% rule (rent ≥ 1% of price), the offer needs to be $1.25M (2.6% below list).
- Recommended offer: $1.25M (2.6% below list) — sets the bar for 1% rule.
- Cap rate 7.2% vs local median 22.6% in Broad Creek — below-typical yield; the buyer is paying a premium for something (appreciation thesis, condition, location) that the cap rate doesn't capture.
Location & tenants
- Location reads 64/100 on livability (#340 in NC) — a middle-class / working-renter tenant base. Strengths: crime A+, cost of living A+, housing A+; Watch: amenities F, commute F, health & safety D-.
- Carteret County Public Schools (rural): math 59% / reading 61% proficiency, ranked #31 of 178 in NC (top 17%) — acceptable for families but not a draw, mixed tenant base, ~2y average lease.
- Zoned schools: Bogue Sound Elementary (math 63% / reading 63%, grade B, #168 of 1,410 statewide, top 12%, 467 students, 99% FRL); Broad Creek Middle (math 63% / reading 68%, grade A-, #28 of 475 statewide, top 6%, 710 students, 100% FRL); Croatan High (math 82% / reading 78%, grade A, #73 of 535 statewide, top 13%, 974 students, 26% FRL) — zoned schools average 75% FRL vs 39% district-wide (36 pts higher); higher-poverty schools than district average — tighter screening recommended.
- Market conditions: 216 active listings in the ZIP; 935 units permitted in Carteret County in 2024 (360 in 5+ unit buildings).
- At $12,455/mo this rent would consume 213% of the median local household income ($70k/yr) (locally 461% of renters already pay >50% of income on rent) — very limited rent-growth headroom before tenants either downsize or default.
Forward outlook
- Local home prices are declining (-3.0%/yr); year-one equity from $9k of loan paydown is wiped out by about $38k of value loss. Plan a longer hold.
- Carteret County population projected at +9% by 2050 — modest demand growth; plan on rents tracking national, not racing it.
Negotiation context
- It's been on market 21 days — a 2% lower offer ($1.26M) is reasonable based on typical stale-listing flexibility.
- Current owner paid $175k; list at $1.28M implies a 631% gain — meaningful room to come down on a strong offer.
Risks & watch-outs
- Watch-outs: flood insurance adds $66/mo.
- Climate carrying-cost: severe flood risk; severe wind risk, 99% chance of damaging wind over 30y; extreme-heat days projected 7→19/yr by 2055 (HVAC capex compounding) — expect insurance premiums to compound above CPI over the hold.
Questions for the listing agent
- What's the actual annual flood-insurance premium (NFIP or private), and is the property in a SFHA with mandatory coverage?
- Is there a deadline driving the sale (1031 exchange, divorce, estate, relocation)? That informs how much negotiation room exists.
- Schools are F-rated, which usually means shorter tenancies and higher turnover. Who's the typical renter profile here, and what's been the actual vacancy rate?
- The area grade is low — what's the realistic commute time and amenity access for the typical tenant pool here? Any planned neighborhood developments (good or bad) we should know about?
- What's the average days-on-market for RENTAL listings here right now (not sales)? A rising rental-DOM trend means longer vacancies and softer asking-rent achievability than the comps imply.
- What's the recent tenant-quality profile in this submarket — average credit score on applications, eviction rate, late-payment / NSF rate, and stable-employment percentage? A property-management company in the area should have these aggregated.
- How much new for-sale + rental construction is in the pipeline within 1–3 miles? Heavy new supply typically softens prices + rents 12–24 months out; constrained supply supports both.
Investment metrics
- 1% rule
- 0.97% ✗
- Cap rate
- 7.23%
- Cash-on-cash
- 3.35%
- DSCR
- 1.15
- GRM
- 8.6
CMA / ARV
No comps found within radius.
Projected returns pro-forma
-3.0% appreciation · 3.0% rent growth · sell at horizon
- IRR
- -11.3%
- Equity multiple
- 0.59×
- Total profit
- $-147,526
- Equity at exit
- $190,703
- IRR
- -2.1%
- Equity multiple
- 0.86×
- Total profit
- $-50,919
- Equity at exit
- $110,585
Cash invested: $358,120 (down + closing). Projections, not guarantees.
Landlord ↔ Tenant lean methodology
- Overall (STATE)
- 85 Strongly Landlord-Friendly
- State North Carolina
- 85 Strongly Landlord-Friendly · R+3
- County
- — inherits STATE
- City
- — inherits STATE
ZIP-level market 28570
- Home prices YoY
- -16.2%
- Active inventory
- 216
- Price-to-rent
- 8.6×
Monthly cashflow live
- Estimated rent
- $12,455 medium interval (Pro) →
- Mortgage (P&I)
- −$6,707
- Tax est. 1.5%
- −$1,599 /mo · $19,185/yr
- Insurance
- −$533
- Flood insurance flood zone
- −$66 /mo · $798/yr
- HOA
- −$0
- Vacancy / Maint / Mgmt
- −$2,616
- Net cashflow
- $934
Break-even live
UW: 25.0% down · 7.5% · 30yr · 1.5% tax · 5.0% vac · 8.0% maint · 8.0% mgmt
Financing live
Cash to close
- Down payment
- $319,750
- Closing costs
- $38,370
- Reserves months
- —
- Total cash needed
- —
Loan-product check · same deal, 3 products live
Conventional
25% down · 7.5% · 30yr
- Down + closing
- —
- Monthly P&I
- —
- Monthly cashflow
- —
- DSCR
- —
- Eligible?
- —
Personal DTI + credit; lowest rate.
DSCR
20% down · 8.5% · 30yr
- Down + closing
- —
- Monthly P&I
- —
- Monthly cashflow
- —
- DSCR
- —
- Eligible?
- —
No personal income docs; deal must DSCR.
Hard money
10% down · 12.0% · 12mo
- Down + closing
- —
- Monthly P&I
- —
- Monthly cashflow
- —
- DSCR
- —
- Eligible?
- —
Short-term bridge; refi at stabilization.
Listing history 17 events
-
2026-06-19days on market $1,279,000 Active 21 DOM
-
2026-06-18days on market $1,279,000 Active 20 DOM
-
2026-06-17days on market $1,279,000 Active 19 DOM
-
2026-06-16days on market $1,279,000 Active 18 DOM
-
2026-06-15days on market $1,279,000 Active 17 DOM
-
2026-06-14days on market $1,279,000 Active 15 DOM
-
2026-06-12days on market $1,279,000 Active 14 DOM
-
2026-06-09days on market $1,279,000 Active 11 DOM
-
2026-06-08days on market $1,279,000 Active 10 DOM
-
2026-06-07days on market $1,279,000 Active 9 DOM
-
2026-06-05days on market $1,279,000 Active 6 DOM
-
2026-06-03days on market $1,279,000 Active 5 DOM
-
2026-06-02days on market $1,279,000 Active 4 DOM
-
2026-06-01days on market $1,279,000 Active 3 DOM
-
2026-05-31days on market $1,279,000 Active 2 DOM
-
2026-05-29$1,279,000 Active
-
2009-08-11soldstatus $175,000
ⓘ Source: listings_history table (triggers on properties + properties_extension) + one-shot
backfill from property_details.listing_events for pre-trigger history.
Climate risk First Street
- Flood 8/10 Severe FEMA zone X (unshaded) · 99% chance over 30 yrs
- Wildfire 2/10 Low
- Heat 9/10 Extreme 7 d/yr ≥102°F today · 19 d/yr by 30 yrs out
- Wind 9/10 Extreme 99% chance of damaging wind over 30 yrs
- Air quality 2/10 Low 2 unhealthy d/yr today · 2 by 30 yrs out
Nearby sold comps map
Loading sold comps map…
Walkable amenities ~0.75 mi
Loading nearby amenities…
Taxation est. · year 1
- Rental income
- $149,461
- − Mortgage interest
- −$71,644
- − Property taxes
- −$19,185
- − Insurance
- −$7,192
- − Repairs & maintenance
- −$11,957
- − Management
- −$11,957
- − Depreciation
- −$37,207
- Taxable loss
- −$9,681
- Est. tax savings @ 24.0%
- +$2,324
- After-tax cash flow
- $13,534/yr
For passive investors: Depreciation is non-cash, so a rental often shows a tax loss while cash-flowing — sheltering income. Rental losses are passive: they offset passive income freely, and up to $25,000/yr can offset ordinary (W-2) income if you actively participate and your MAGI is under $100k (phasing out to $0 by $150k); unused losses carry forward. On sale, claimed depreciation is recaptured at up to 25%, and gains may owe capital-gains tax (a 1031 exchange can defer both). Figures are a year-1 estimate at your 24.0% rate — not tax advice; consult a CPA.
Schools (NCES district)
- District
- Carteret County Public Schools
- NCES district ID
- 3700630
- Math proficiency
- 59% ▲ 5.00%
- Reading proficiency
- 61% ▲ 2.00%
- Median HH income
- $48,330
- Composite
- 50.92/100
- National rank
- #1786
- State rank
- #31 of 178 in NC
Livability — Broad Creek
- Score
- 64/100
- State rank
- #340
- US rank
- #13718
Category grades
Schools grade is shown separately in the Schools card above.
Census & demographics
- Census place
- Broad Creek, NC
- County
- Carteret County · 52,389 people
- Metro
- Morehead City, NC
- Population (ZIP)
- 22,197
- Household income
- $70,229
- Rent vs Own
- Severe rent burden
- 461.0
Population outlook (Carteret County) Hauer SSP2
- Today (2025)
- 73,443 people
- By 2030
- 75,344 · +2.6%
- By 2040
- 78,142 · +6.4%
- By 2050
- 80,091 · +9.1%
- By 2075
- 86,120 · +17.3%
- By 2100
- 89,408 · +21.7%
Race, ethnicity, and origin ACS 2023
- Neighborhood character
- Predominantly White (82%)
- Race & ethnicity
- White 82% Hispanic / Latino 7% Two or more races 6% Black 3% Asian 1%
- Hispanic origin (detail)
- Mexican 4%
- Common ancestry
- Slovak 3% Romanian 3% Lithuanian 2%
- Foreign-born
- 5% · Canada, Dominican Republic
- Languages at home
- 92% English-only · Spanish 6% German/W. Germanic 1%
Political lean MEDSL · Carteret
- 2024 margin
- Solid R (+43.1) · D 28.0% · R 71.1%
- 2008→2024 swing
- -8.4pp toward R · 2008: -34.7pp · 2024: -43.1pp
- All cycles
- 2024: R+43.1 2020: R+42.0 2016: R+44.5 2012: R+41.0 2008: R+34.7
Not yet ingested
- Civics
- —
Market trends
- HPI YoY
- ▼ -53.54%
- Current HPI
- 276.6589
- Rent YoY
- —
- Metro
- Morehead City, NC
- State GDP YoY
- ▲ 3.28%
- F500 in state
- 26
Industry mix (Fortune 500 HQ in NC)
| Industry | F500 HQs | Revenue |
|---|---|---|
| Financial Services | 2 | $213B |
|
||
| Retail | 2 | $95B |
|
||
| Industrial Conglomerate | 1 | $38B |
|
||
| Metals / Steel | 1 | $35B |
|
||
| Utilities | 1 | $30B |
|
||
| Industrial Machinery | 1 | $19B |
|
||
Price history
+630.9% since first listed2 events — show timeline
- 2026-05-29 Listed $1,279,000 Hive MLS
- 2009-08-11 Sold (Public Records) $175,000 Public Records
Property tax history
+0.1%/yrLatest (2023): $1,777 · +2.1% YoY. Source: county tax records.
Cash-flow waterfall
monthlySold comps — $/sqft
last 12 mo · ≤1 miLoading sold comps…