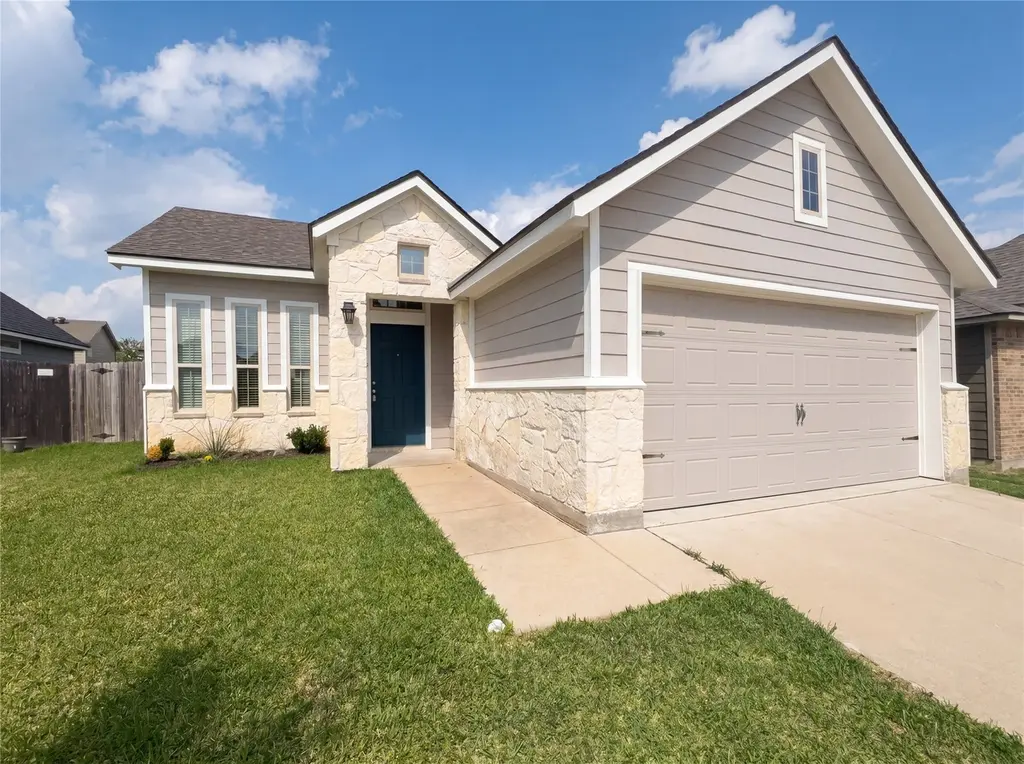
2132 Markley Dr · Bryan, TX
Flood risk 1/10 · Minimal
- FEMA flood zone
- X (unshaded)
- Chance of flooding over 30 yrs
- 0.0%
- Est. flood insurance / yr
- $507 – $1,088
Fire risk 4/10 · Minor
- Est. fire insurance / yr
- $1,222 – $2,270
Heat risk 8/10 · Major
- Hot days now (above 110°F)
- 7 days/yr
- Hot days in 30 yrs
- 25 days/yr
Wind risk 8/10 · Major
- Chance of severe wind over 30 yrs
- 80.0%
Air-quality risk 1/10 · Minimal
- Unhealthy air days now
- 0 days/yr
- Unhealthy air days in 30 yrs
- 0 days/yr
Risk factors via First Street. Map © Google.
Why this score? — see what drove the D- grade
The composite is a weighted blend of 9 inputs, each scored 0–100. Each bar is that input's sub-score; the figure is the points it added to the 100-point composite (weight × sub-score).
- ARV discount +11.5/15.0
- Cash flow +9.7/30.0
- Livability +3.8/5.0
- 1% rule +3.6/10.0
- DSCR +2.7/10.0
- Schools +2.6/10.0
- Rent growth +2.5/5.0
- Condition / age +2.5/5.0
- Appreciation +0.0/10.0
$255,000
🖨 Deal sheet (PDF) 📄 Offer letter ✓ Due diligence
Listing remarks
Welcome to 2132 Markley Dr, featuring fresh interior paint throughout. The kitchen includes all stainless steel appliances and an accent backsplash. A walk in closet is located in the primary bedroom, complemented by a separate tub and shower in the primary bathroom. A patio extends to the fenced in backyard. This home blends updates and functionality. Included 100-Day Home Warranty with buyer activation
Key facts
- Fenced in backyard
- Walk in closet
- Patio
Tags
Property features AI
Finance
- HOA & community: Association: BHHS Caliber Realty; Association fee of $200 annually
Exterior
- Parking: Attached garage with 1 garage space
- Security: Owned security system
- Utilities: Public water; Public sewer
- Home design: Residential property; Built in 2018; Slab foundation
- Construction: Composition roof
- Exterior features: Lot with other features
Interior
- Kitchen: Dishwasher
- Bedrooms: Primary bedroom on the first floor (approx. 14 x 14); Bedroom on the first floor (approx. 12 x 10); Bedroom on the first floor (approx. 12 x 10)
- Flooring: Carpet; Vinyl
- Bathrooms: 2 full bathrooms
- Heating & cooling: Central heating (electric); Central air conditioning (electric)
- Interior features: Security system (owned)
Neighborhood map
What this means for you Summary
Snapshot
- This is a 3-bed/2.0-bath single-family listed at $255k.
Deal economics
- At list price, monthly cash flow is $-168 ($-2k/yr) — negative.
- To cash-flow at today's rent, offer at most $225k (11.6% below list).
- To meet the 1% rule (rent ≥ 1% of price), the offer needs to be $219k (14.2% below list).
- Recommended offer: $219k (14.2% below list) — sets the bar for 1% rule.
- Cap rate 5.5% vs local median 4.0% in Bryan — top-decile yield for the area; either an underpriced asset or a hidden risk that comps aren't pricing in. Stress-test before assuming the spread holds.
Location & tenants
- Location reads 76/100 on livability (#99 in TX, #3,341 nationally) — a middle-class / working-renter tenant base. Strengths: cost of living A+, housing A+, health & safety A+; Watch: crime C-, amenities C-, employment D+.
- Bryan ISD (urban): math 30% / reading 32% proficiency, ranked #608 of 826 in TX (top 74%) — families likely to look elsewhere, expect single-tenant / working-renter base with shorter leases; 68% free/reduced lunch — lower-income household profile, screen leases tightly.
- Zoned schools: Mary Branch El (math 32% / reading 17%, grade F, #3,052 of 4,322 statewide, top 74%, 617 students, 83% FRL); Stephen F Austin (math 25% / reading 36%, grade F, #1,036 of 1,662 statewide, top 63%, 1,206 students, 76% FRL); Travis B Bryan H S (math 22% / reading 34%, grade F, #1,170 of 1,632 statewide, top 72%, 2,419 students, 67% FRL).
- Market conditions: 304 active listings in the ZIP; 18 comparable units currently listed for rent nearby; rentals at typical pace (median 15d on market — plan ~3-4 weeks tenant-placement turnaround); 2,211 units permitted in Brazos County in 2024 (768 in 5+ unit buildings).
- This rent runs 35% of the median local income ($74k/yr) — at the standard rent-burdened threshold; future hikes will face affordability resistance.
Forward outlook
- Local home prices are declining (-3.0%/yr); year-one equity from $2k of loan paydown is wiped out by about $8k of value loss. Plan a longer hold.
- Brazos County population projected at +55% by 2050 — long-run rental-demand tailwind backs the buy-and-hold thesis.
Negotiation context
- It's been on market 51 days — a 3% lower offer ($247k) is reasonable based on typical stale-listing flexibility.
Risks & watch-outs
- Climate carrying-cost: severe wind risk, 80% chance of damaging wind over 30y; extreme-heat days projected 7→25/yr by 2055 (HVAC capex compounding) — expect insurance premiums to compound above CPI over the hold.
Questions for the listing agent
- What do current leases actually rent for vs. the listed asking? Can we see a recent rent roll and the last 12 months of T-12 income?
- It's been on market 51 days. Have you received any prior offers? Is the seller open to a 14% concession, seller financing, or rate buy-down credit?
- What does the HOA fee cover, when was the last increase, and are there any pending special assessments or reserve-fund shortfalls?
- Is there a deadline driving the sale (1031 exchange, divorce, estate, relocation)? That informs how much negotiation room exists.
- The area grade is low — what's the realistic commute time and amenity access for the typical tenant pool here? Any planned neighborhood developments (good or bad) we should know about?
- What's the average days-on-market for RENTAL listings here right now (not sales)? A rising rental-DOM trend means longer vacancies and softer asking-rent achievability than the comps imply.
- What's the recent tenant-quality profile in this submarket — average credit score on applications, eviction rate, late-payment / NSF rate, and stable-employment percentage? A property-management company in the area should have these aggregated.
- How much new for-sale + rental construction is in the pipeline within 1–3 miles? Heavy new supply typically softens prices + rents 12–24 months out; constrained supply supports both.
Investment metrics
- 1% rule
- 0.86% ✗
- Cap rate
- 5.50%
- Cash-on-cash
- -2.82%
- DSCR
- 0.87
- GRM
- 9.7
CMA / ARV
- ARV (median comp)
- $279,925
- List price
- $255,000
- Delta
- -8.90%
- Verdict
- FAIR
- Comps
- 20 within 1.0 mi
Show comp detail 4 sales within ~0.75 mi
| Address | Dist | Beds/Ba | Sqft | Sold | Price | $/sf | Match |
|---|---|---|---|---|---|---|---|
| 2009 Kathryn Dr | 0.17mi | 3/2.0 | 1,375 (+4%) | 14mo | $275,000 | $200 | 73 |
| 2041 Mountain Wind Loop | 0.48mi | 3/2.0 | 1,289 (-2%) | 2mo | $249,900 | $194 | 72 |
| 2016 Snowy Brook Trl | 0.53mi | 3/2.0 | 1,144 (-13%) | 21mo | $237,400 | $208 | 35 |
| 2007 Kimmy Dr | 0.70mi | 3/2.0 | 1,481 (+12%) | 14mo | $279,900 | $189 | 35 |
Match score weights: distance 35% · size 25% · config 20% · recency 20%. Top-matched comps best support the ARV.
Projected returns pro-forma
-3.0% appreciation · 3.0% rent growth · sell at horizon
- IRR
- -20.9%
- Equity multiple
- 0.27×
- Total profit
- $-51,910
- Equity at exit
- $38,021
- IRR
- -14.2%
- Equity multiple
- 0.18×
- Total profit
- $-58,518
- Equity at exit
- $22,048
Cash invested: $71,400 (down + closing). Projections, not guarantees.
Landlord ↔ Tenant lean methodology
- Overall (STATE)
- 87 Strongly Landlord-Friendly
- State Texas
- 87 Strongly Landlord-Friendly · R+5
- County
- — inherits STATE
- City
- — inherits STATE
ZIP-level market 77807
- Active inventory
- 304
- Price-to-rent
- 9.7×
Monthly cashflow live
- Estimated rent
- $2,187 high interval (Pro) →
- Mortgage (P&I)
- −$1,337
- Tax from tax record
- −$436 /mo · $5,227/yr
- Insurance
- −$106
- HOA
- −$17
- Vacancy / Maint / Mgmt
- −$459
- Net cashflow
- $-168
Break-even live
Sensitivity live
| Price | -10% $-24 | -5% $-96 | +0% $-168 | +5% $-240 | +10% $-312 |
|---|---|---|---|---|---|
| Rent | -10% $-341 | -5% $-254 | +0% $-168 | +5% $-82 | +10% $5 |
| Rate | -1.0pp $-40 | -0.5pp $-103 | base $-168 | +0.5pp $-234 | +1.0pp $-301 |
UW: 25.0% down · 7.5% · 30yr · 1.5% tax · 5.0% vac · 8.0% maint · 8.0% mgmt
Financing live
Cash to close
- Down payment
- $63,750
- Closing costs
- $7,650
- Reserves months
- —
- Total cash needed
- —
Loan-product check · same deal, 3 products live
Conventional
25% down · 7.5% · 30yr
- Down + closing
- —
- Monthly P&I
- —
- Monthly cashflow
- —
- DSCR
- —
- Eligible?
- —
Personal DTI + credit; lowest rate.
DSCR
20% down · 8.5% · 30yr
- Down + closing
- —
- Monthly P&I
- —
- Monthly cashflow
- —
- DSCR
- —
- Eligible?
- —
No personal income docs; deal must DSCR.
Hard money
10% down · 12.0% · 12mo
- Down + closing
- —
- Monthly P&I
- —
- Monthly cashflow
- —
- DSCR
- —
- Eligible?
- —
Short-term bridge; refi at stabilization.
Rent comps 18 comps
| Address | Beds | Baths | Sqft | Rent | $/sqft | DOM | Units | Dist |
|---|---|---|---|---|---|---|---|---|
| 2136 Markley Dr Bryan, TX | 4.0 | 2.0 | 1648 | $2,200 | $1.33 | 22d | 1 | 0.01mi |
| 2136 Markley Dr Bryan, TX | 4.0 | 2.0 | 1648 | $2,300 | $1.40 | 45d | 1 | 0.01mi |
| 2206 Hall of Fame Ct Bryan, TX | 3.0 | 2.0 | 1517 | $2,150 | $1.42 | 45d | 1 | 0.16mi |
| 1937 Viva Rd Bryan, TX | 3.0 | 2.0 | 1869 | $2,500 | $1.34 | 15d | 1 | 0.21mi |
| 2023 Mountain Wind Loop Bryan, TX | 3.0 | 2.0 | 1319 | $2,000 | $1.52 | 15d | 1 | 0.58mi |
| 2020 Turning Leaf Dr Bryan, TX | 3.0 | 2.0 | 1417 | $2,000 | $1.41 | 15d | 1 | 0.60mi |
| 2010 Turning Leaf Dr Bryan, TX | 3.0 | 2.0 | 1423 | $2,000 | $1.41 | 15d | 1 | 0.63mi |
| 5822 Leonard Rd Unit 1 Bryan, TX | 3.0 | 2.0 | 1250 | $1,400 | $1.12 | 15d | 1 | 0.95mi |
| 6021 Toby Bnd Bryan, TX | 4.0 | 2.0 | 1620 | $2,175 | $1.34 | 15d | 1 | 1.00mi |
| 1708 Beaver Pond Ct Unit 1328061P Bryan, TX | 3.0 | 2.0 | 1550 | $3,973 | $2.56 | 22d | 1 | 1.07mi |
| 1803 Beaver Pond Ct Bryan, TX | 4.0 | 2.0 | 1403 | $2,100 | $1.50 | 45d | 1 | 1.19mi |
| 2511 Westwood Main Dr Bryan, TX | 3.0 | 2.0 | 1421 | $2,100 | $1.48 | 15d | 1 | 1.19mi |
| 1735 Rock Hollow Loop Bryan, TX | 3.0 | 2.0 | 1209 | $1,500 | $1.24 | 45d | 1 | 1.25mi |
| 6000 Jones Rd Bryan, TX | 1.0–3.0 | 1.0–2.0 | 1001 | $2,305 | $2.30 | 15d | 52 | 1.26mi |
| 2406 Toro Ln Unit D Bryan, TX | 2.0 | 1.0 | 918 | $975 | $1.06 | 15d | 1 | 1.42mi |
| 852 N Harvey Mitchell Pkwy Bryan, TX | 1.0–2.0 | 1.0–2.0 | 857 | $1,555 | $1.81 | 15d | 1 | 1.47mi |
| 2003 Rockwood Dr Bryan, TX | 3.0 | 2.0 | 1468 | $1,850 | $1.26 | 45d | 1 | 1.48mi |
| 3105 Leonard Rd Bryan, TX | 1.0–2.0 | 1.0–2.0 | 857 | $1,555 | $1.81 | 15d | 1 | 1.50mi |
HOA detail
- Monthly dues
- $17 · $204/yr
Listing history 19 events
-
2026-06-21days on market $255,000 Active 51 DOM
-
2026-06-18days on market $255,000 Active 48 DOM
-
2026-06-17days on market $255,000 Active 47 DOM
-
2026-06-16days on market $255,000 Active 46 DOM
-
2026-06-15days on market $255,000 Active 45 DOM
-
2026-06-14days on market $255,000 Active 43 DOM
-
2026-06-13days on market $255,000 Active 42 DOM
-
2026-06-10days on market $255,000 Active 40 DOM
-
2026-06-09days on market $255,000 Active 39 DOM
-
2026-06-08days on market $255,000 Active 38 DOM
-
2026-06-07days on market $255,000 Active 37 DOM
-
2026-06-03days on market $255,000 Active 33 DOM
-
2026-06-02days on market $255,000 Active 32 DOM
-
2026-06-01days on market $255,000 Active 31 DOM
-
2026-05-31days on market $255,000 Active 30 DOM
-
2026-05-30days on market $255,000 Active 29 DOM
-
2026-05-14price $255,000 407-char remark
-
2026-05-01$260,000 Active 407-char remark
-
2026-04-07soldstatus
ⓘ Source: listings_history table (triggers on properties + properties_extension) + one-shot
backfill from property_details.listing_events for pre-trigger history.
Tax reassessment forecast TX · Resets to sale price
- Current annual tax
- $5,227 · $436/mo
- Projected year-2 tax
- $5,227 · $436/mo
- Expected delta
- $0/yr ($0/mo · 0.0%)
ⓘ Screening estimate from a state-policy table — verify with the county assessor before closing.
Climate risk First Street
- Flood 1/10 Low FEMA zone X (unshaded) · 0% chance over 30 yrs
- Wildfire 4/10 Moderate
- Heat 8/10 Severe 7 d/yr ≥110°F today · 25 d/yr by 30 yrs out
- Wind 8/10 Severe 80% chance of damaging wind over 30 yrs
- Air quality 1/10 Low 0 unhealthy d/yr today · 0 by 30 yrs out
Nearby sold comps map
Loading sold comps map…
Walkable amenities ~0.75 mi
Loading nearby amenities…
Taxation est. · year 1
- Rental income
- $26,248
- − Mortgage interest
- −$14,284
- − Property taxes
- −$5,227
- − Insurance
- −$1,275
- − Repairs & maintenance
- −$2,100
- − Management
- −$2,100
- − HOA
- −$204
- − Depreciation
- −$7,418
- Taxable loss
- −$6,360
- Est. tax savings @ 24.0%
- +$1,526
- After-tax cash flow
- $-491/yr
For passive investors: Depreciation is non-cash, so a rental often shows a tax loss while cash-flowing — sheltering income. Rental losses are passive: they offset passive income freely, and up to $25,000/yr can offset ordinary (W-2) income if you actively participate and your MAGI is under $100k (phasing out to $0 by $150k); unused losses carry forward. On sale, claimed depreciation is recaptured at up to 25%, and gains may owe capital-gains tax (a 1031 exchange can defer both). Figures are a year-1 estimate at your 24.0% rate — not tax advice; consult a CPA.
Schools (NCES district)
- District
- Bryan ISD
- NCES district ID
- 4811790
- Math proficiency
- 30% ▼ -8.00%
- Reading proficiency
- 32% ▼ -3.00%
- Median HH income
- $41,895
- Composite
- 26.26/100
- National rank
- #7253
- State rank
- #608 of 826 in TX
Livability — Bryan
- Score
- 76/100
- State rank
- #99
- US rank
- #3341
Category grades
Schools grade is shown separately in the Schools card above.
Census & demographics
- Census place
- Bryan, TX
- County
- Brazos County · 233,400 people
- City population
- 101,772
- Metro
- College Station-Bryan, TX
- Population (ZIP)
- 13,227
- Household income
- $74,375
- Rent vs Own
- Severe rent burden
- 629.0
Population outlook (Brazos County) Hauer SSP2
- Today (2025)
- 267,942 people
- By 2030
- 296,630 · +10.7%
- By 2040
- 354,560 · +32.3%
- By 2050
- 414,616 · +54.7%
- By 2075
- 562,158 · +109.8%
- By 2100
- 678,828 · +153.3%
Race, ethnicity, and origin ACS 2023
- Neighborhood character
- Diverse neighborhood (Simpson 0.67)
- Race & ethnicity
- White 45% Hispanic / Latino 32% Two or more races 18% Black 14% Native American 3% Asian 2%
- Hispanic origin (detail)
- Mexican 29%
- Common ancestry
- Romanian 2% Lithuanian 2% Italian 2%
- Foreign-born
- 16% · Canada, Guatemala, Vietnam
- Languages at home
- 71% English-only · Spanish 24% Other Asian/Pacific 1% French/Haitian/Cajun 1%
Political lean MEDSL · Brazos
- 2024 margin
- Strong R (+24.9) · D 36.9% · R 61.7% · Other 1.4%
- 2008→2024 swing
- +4.1pp toward D · 2008: -28.9pp · 2024: -24.9pp
- All cycles
- 2024: R+24.9 2020: R+14.3 2016: R+23.7 2012: R+35.3 2008: R+28.9
Not yet ingested
- Civics
- —
Market trends
- HPI YoY
- ▼ -114.38%
- Current HPI
- 186.1387
- Rent YoY
- —
- Metro
- College Station-Bryan, TX
- State GDP YoY
- ▲ 3.95%
- F500 in state
- 110
Industry mix (Fortune 500 HQ in TX)
| Industry | F500 HQs | Revenue |
|---|---|---|
| Energy | 16 | $1,198B |
|
||
| Technology | 5 | $198B |
|
||
| Engineering / Construction | 4 | $72B |
|
||
| Energy Services | 3 | $60B |
|
||
| Utilities | 3 | $41B |
|
||
| Healthcare | 2 | $330B |
|
||
Price history
-1.9% since first listed3 events — show timeline
- 2026-05-14 Price Changed $255,000 HARMLS
- 2026-05-01 Listed $260,000 HARMLS
- 2026-04-07 Sold (Public Records) — Public Records
Property tax history
+44.8%/yrLatest (2025): $5,227 · -2.9% YoY. Source: county tax records.
Cash-flow waterfall
monthlySold comps — $/sqft
last 12 mo · ≤1 miLoading sold comps…