29 Elizabeth St · Gaylordsville, CT
Flood risk 1/10 · Minimal
- FEMA flood zone
- X
- Chance of flooding over 30 yrs
- 0.0%
- Est. flood insurance / yr
- $507 – $1,088
Fire risk 4/10 · Minor
- Est. fire insurance / yr
- $829 – $1,539
Heat risk 4/10 · Minor
- Hot days now (above 95°F)
- 8 days/yr
- Hot days in 30 yrs
- 17 days/yr
Wind risk 4/10 · Minor
- Chance of severe wind over 30 yrs
- 18.0%
Air-quality risk 2/10 · Minimal
- Unhealthy air days now
- 2 days/yr
- Unhealthy air days in 30 yrs
- 2 days/yr
Risk factors via First Street. Map © Google.
Why this score? — see what drove the D+ grade
The composite is a weighted blend of 9 inputs, each scored 0–100. Each bar is that input's sub-score; the figure is the points it added to the 100-point composite (weight × sub-score).
- ARV discount +15.0/15.0
- Cash flow +11.6/30.0
- Appreciation +5.2/10.0
- Schools +4.2/10.0
- DSCR +3.4/10.0
- 1% rule +2.5/10.0
- Rent growth +2.5/5.0
- Livability +2.5/5.0
- Condition / age +2.5/5.0
$339,900
🖨 Deal sheet 📄 Offer letter ✓ Due diligence
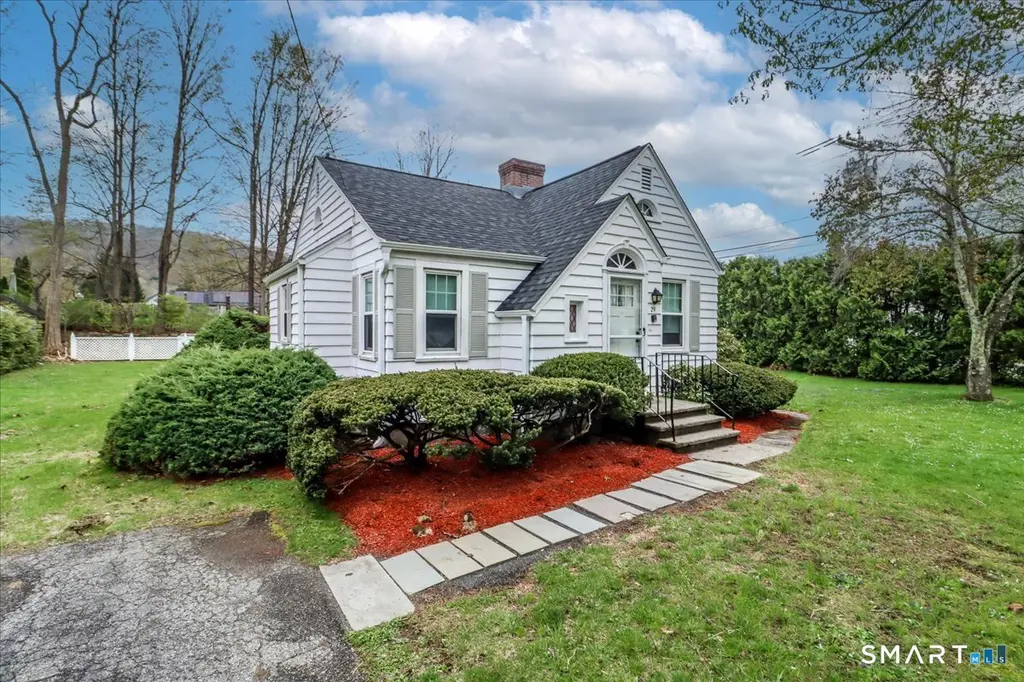
Listing remarks
Picture-perfect and full of character, this adorable 2-bedroom, 1-bath Cape is ideally located in the heart of downtown Kent! Set on a level . 36-acre corner lot, this 1940 home is brimming with timeless charm and curb appeal. Step outside to a generously sized back deck, perfect for morning coffee, weekend entertaining, or quiet evenings overlooking the level yard. Inside, the home features a cozy, inviting layout full of warmth and personality, while the full unfinished basement provides ample storage. Recent improvements include a 1-year-old roof for peace of mind. Additional highlights include oil heat, public sewer and water, and a prime location close to shops, dining, and everything
Key facts
- 0.36 acre lot
- Built 1940
- Listed 6 days
Neighborhood map
What this means for you Summary
Snapshot
- This is a 2-bed/1.0-bath single-family listed at $340k.
Deal economics
- At list price, monthly cash flow is $-104 ($-1k/yr) — negative.
- To cash-flow at today's rent, offer at most $322k (5.4% below list).
- To meet the 1% rule (rent ≥ 1% of price), the offer needs to be $254k (25.2% below list).
- Recommended offer: $254k (25.2% below list) — sets the bar for 1% rule.
- Cap rate 5.9% vs local median 2.8% in Gaylordsville — top-decile yield for the area; either an underpriced asset or a hidden risk that comps aren't pricing in. Stress-test before assuming the spread holds.
Location & tenants
- Location reads: area grade D — affects rentability + tenant quality, not the cash-flow math above.
- Regional School District 01 (rural): math 30% / reading 60% proficiency, ranked #147 of 192 in CT (top 77%) — families likely to look elsewhere, expect single-tenant / working-renter base with shorter leases.
- Market conditions: 26 active listings in the ZIP; 154 units permitted in Northwest Hills Planning Region in 2024 (6 in 5+ unit buildings).
Forward outlook
- In year one you build about $4k of equity ($2k loan paydown + $1k appreciation (0.4% local appreciation)).
- By year 8, paydown + projected appreciation supports a ~$33k cash-out refi (75% LTV) — recoverable capital for the next deal without selling this one.
Negotiation context
- Only 6 days on market — expect competitive offers; lowballing is unlikely to land.
- Current owner paid $135k; list at $340k implies a 152% gain — meaningful room to come down on a strong offer.
Risks & watch-outs
- Watch-outs: built in 1940 — expect roof / HVAC / electrical / plumbing capex.
Questions for the listing agent
- What do current leases actually rent for vs. the listed asking? Can we see a recent rent roll and the last 12 months of T-12 income?
- Built in 1940 — when were the roof, HVAC, electrical panel, plumbing, and water heater last replaced?
- Is there a deadline driving the sale (1031 exchange, divorce, estate, relocation)? That informs how much negotiation room exists.
- The area grade is low — what's the realistic commute time and amenity access for the typical tenant pool here? Any planned neighborhood developments (good or bad) we should know about?
- What's the average days-on-market for RENTAL listings here right now (not sales)? A rising rental-DOM trend means longer vacancies and softer asking-rent achievability than the comps imply.
- What's the recent tenant-quality profile in this submarket — average credit score on applications, eviction rate, late-payment / NSF rate, and stable-employment percentage? A property-management company in the area should have these aggregated.
- How much new for-sale + rental construction is in the pipeline within 1–3 miles? Heavy new supply typically softens prices + rents 12–24 months out; constrained supply supports both.
Investment metrics
- 1% rule
- 0.75% ✗
- Cap rate
- 5.93%
- Cash-on-cash
- -1.31%
- DSCR
- 0.94
- GRM
- 11.1
CMA / ARV
- ARV (on-the-fly)
- $416,346
- Comps found
- 1
Show comp detail 1 sale within ~0.75 mi
| Address | Dist | Beds/Ba | Sqft | Sold | Price | $/sf | Match |
|---|---|---|---|---|---|---|---|
| 29 Elizabeth St | 0.00mi | 2/1.0 | 862 (0%) | 1mo | $416,000 | $483 | 99 |
Match score weights: distance 35% · size 25% · config 20% · recency 20%. Top-matched comps best support the ARV.
Projected returns pro-forma
0.39% appreciation · 3.0% rent growth · sell at horizon
- IRR
- -2.3%
- Equity multiple
- 0.89×
- Total profit
- $-10,408
- Equity at exit
- $105,364
- IRR
- 3.1%
- Equity multiple
- 1.35×
- Total profit
- $33,765
- Equity at exit
- $132,104
Cash invested: $95,172 (down + closing). Projections, not guarantees.
Landlord ↔ Tenant lean methodology
- Overall (STATE)
- 27 Tenant-Leaning
- State Connecticut
- 27 Tenant-Leaning · D+7
- County
- — inherits STATE
- City
- — inherits STATE
ZIP-level market 06757
- Home prices YoY
- 0.1%
- Active inventory
- 26
- Price-to-rent
- 11.1×
Monthly cashflow live
- Estimated rent
- $2,544 medium interval (Pro) →
- Mortgage (P&I)
- −$1,782
- Tax from tax record
- −$189 /mo · $2,272/yr
- Insurance
- −$142
- HOA
- −$0
- Vacancy / Maint / Mgmt
- −$534
- Net cashflow
- $-104
Break-even live
UW: 25.0% down · 7.5% · 30yr · 1.5% tax · 5.0% vac · 8.0% maint · 8.0% mgmt
Financing live
Cash to close
- Down payment
- $84,975
- Closing costs
- $10,197
- Reserves months
- —
- Total cash needed
- —
Loan-product check · same deal, 3 products live
Conventional
25% down · 7.5% · 30yr
- Down + closing
- —
- Monthly P&I
- —
- Monthly cashflow
- —
- DSCR
- —
- Eligible?
- —
Personal DTI + credit; lowest rate.
DSCR
20% down · 8.5% · 30yr
- Down + closing
- —
- Monthly P&I
- —
- Monthly cashflow
- —
- DSCR
- —
- Eligible?
- —
No personal income docs; deal must DSCR.
Hard money
10% down · 12.0% · 12mo
- Down + closing
- —
- Monthly P&I
- —
- Monthly cashflow
- —
- DSCR
- —
- Eligible?
- —
Short-term bridge; refi at stabilization.
Listing history 4 events
-
2026-04-28status Under Contract
-
2026-04-23$339,900 Active
-
2026-04-20historical $339,900
-
2016-09-15soldstatus $135,000
ⓘ Source: listings_history table (triggers on properties + properties_extension) + one-shot
backfill from property_details.listing_events for pre-trigger history.
Tax reassessment forecast CT · Partial reset (capped growth)
- Current annual tax
- $2,272 · $189/mo
- Projected year-2 tax
- $4,773 · $398/mo
- Expected delta
- +$2,501/yr (+$208/mo · 110.1%)
ⓘ Screening estimate from a state-policy table — verify with the county assessor before closing.
Climate risk First Street
- Flood 1/10 Low FEMA zone X · 0% chance over 30 yrs
- Wildfire 4/10 Moderate
- Heat 4/10 Moderate 8 d/yr ≥95°F today · 17 d/yr by 30 yrs out
- Wind 4/10 Moderate 18% chance of damaging wind over 30 yrs
- Air quality 2/10 Low 2 unhealthy d/yr today · 2 by 30 yrs out
Nearby sold comps map
Loading sold comps map…
Walkable amenities ~0.75 mi
Loading nearby amenities…
Taxation est. · year 1
- Rental income
- $30,522
- − Mortgage interest
- −$19,040
- − Property taxes
- −$2,272
- − Insurance
- −$1,700
- − Repairs & maintenance
- −$2,442
- − Management
- −$2,442
- − Depreciation
- −$9,888
- Taxable loss
- −$7,260
- Est. tax savings @ 24.0%
- +$1,742
- After-tax cash flow
- $494/yr
For passive investors: Depreciation is non-cash, so a rental often shows a tax loss while cash-flowing — sheltering income. Rental losses are passive: they offset passive income freely, and up to $25,000/yr can offset ordinary (W-2) income if you actively participate and your MAGI is under $100k (phasing out to $0 by $150k); unused losses carry forward. On sale, claimed depreciation is recaptured at up to 25%, and gains may owe capital-gains tax (a 1031 exchange can defer both). Figures are a year-1 estimate at your 24.0% rate — not tax advice; consult a CPA.
Schools (NCES district)
- District
- Regional School District 01
- NCES district ID
- 0903600
- Math proficiency
- 30% ▬ 0.00%
- Reading proficiency
- 60% ▬ 0.00%
- Median HH income
- $66,599
- Composite
- 42.38/100
- National rank
- #6926
- State rank
- #147 of 192 in CT
Livability — Gaylordsville
No livability data for this city. (Only ~50 U.S. cities are tracked.)
Census & demographics
- City population
- 975
- Population (ZIP)
- 1,987
Population outlook (Northwest Hills County) Hauer SSP2
- By 2040
- 118,998
Race, ethnicity, and origin ACS 2023
- Neighborhood character
- Predominantly White (86%)
- Race & ethnicity
- White 86% Two or more races 8% Hispanic / Latino 4% Asian 3%
- Common ancestry
- Romanian 5% Lithuanian 4% Iranian 4%
- Foreign-born
- 11% · Canada, Jamaica, South Korea
- Languages at home
- 91% English-only · Other Indo-European 4% Spanish 2% Russian/Polish/Slavic 1%
Political lean MEDSL · Northwest Hills
- 2024 margin
- Toss-up / Even · D 48.6% · R 49.9% · Other 1.6%
- All cycles
- 2024: R+1.3
Not yet ingested
- Civics
- —
Market trends
- HPI YoY
- ▲ 0.39%
- Current HPI
- 299.2094
- Rent YoY
- —
- Metro
- —
- State GDP YoY
- ▲ 1.06%
- F500 in state
- 38
Industry mix (Fortune 500 HQ in CT)
| Industry | F500 HQs | Revenue |
|---|---|---|
| Industrial Machinery | 4 | $38B |
|
||
| Insurance | 3 | $71B |
|
||
| Financial Services | 2 | $25B |
|
||
| Transportation / Logistics | 2 | $18B |
|
||
| Healthcare | 1 | $247B |
|
||
| Telecommunications | 1 | $55B |
|
||
Price history
+151.8% since first listed4 events — show timeline
- 2026-04-28 Pending — Smart MLS
- 2026-04-23 Listed $339,900 Smart MLS
- 2026-04-20 Coming Soon $339,900 Smart MLS
- 2016-09-15 Sold (Public Records) $135,000 Public Records
Property tax history
+2.9%/yrLatest (2023): $2,272 · +1.0% YoY. Source: county tax records.
Cash-flow waterfall
monthlySold comps — $/sqft
last 12 mo · ≤1 miLoading sold comps…