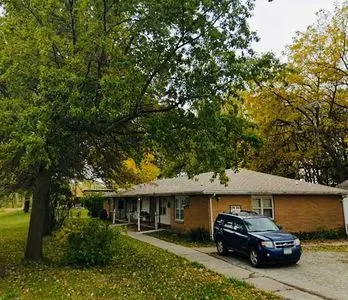
 Fourplex
504 Main St · Coin, IA
Flood risk 1/10 · Minimal
- FEMA flood zone
- X (unshaded)
- Chance of flooding over 30 yrs
- 0.0%
- Est. flood insurance / yr
- $507 – $1,088
Fire risk 2/10 · Minimal
- Est. fire insurance / yr
- $902 – $1,676
Heat risk 3/10 · Minor
- Hot days now (above 106°F)
- 7 days/yr
- Hot days in 30 yrs
- 15 days/yr
Wind risk 2/10 · Minimal
- Chance of severe wind over 30 yrs
- —
Air-quality risk 1/10 · Minimal
- Unhealthy air days now
- 0 days/yr
- Unhealthy air days in 30 yrs
- 0 days/yr
Risk factors via First Street. Map © Google.
Why this score? — see what drove the B+ grade
The composite is a weighted blend of 9 inputs, each scored 0–100. Each bar is that input's sub-score; the figure is the points it added to the 100-point composite (weight × sub-score).
- Cash flow +30.0/30.0
- 1% rule +10.0/10.0
- DSCR +10.0/10.0
- ARV discount +7.5/15.0
- Appreciation +6.9/10.0
- Schools +4.8/10.0
- Livability +2.9/5.0
- Rent growth +2.5/5.0
- Condition / age +2.5/5.0
$199,000
🖨 Deal sheet (PDF) 📄 Offer letter ✓ Due diligence
Multi-family units
County records classify this as Multi-Family (5+ Unit). Listing-text estimate: 4 units. estimate disagrees with records
5+ unit building — per-unit beds/baths from public records are typically unavailable; the breakdown below (if shown) is an estimate from the listing text.
Listing remarks
FOR SALE!! 4 Plex multi-family rental property located in Coin Iowa. 2729 sq ft. With garage that could bring extra income. All units rented and making monthly profits. Total Monthly income on this property is $2,265 per month. Monthly expenses are $293.00. Property has 3 one bed units and 1 two bed unit. Coin op laundry on site that produces additional revenue! Long term tenants. All of the hard work is done just step into making money!
Key facts
- Built 1977
Neighborhood map
What this means for you Summary
Snapshot
- This is a 3×1bd/1ba + 1×2bd/1ba units multifamily listed at $199k.
Deal economics
- At list price, monthly cash flow is $1k ($16k/yr) — positive. Per door: $325/mo.
- The deal already cash-flows at list — no discount required.
- Meets the 1% rule at list price ($3k rent vs $199k).
Location & tenants
- Location reads 58/100 on livability (#888 in IA) — a working-class tenant base; expect higher turnover. Strengths: cost of living A+, housing A+; Watch: crime D+, amenities F, commute F.
- South Page Community School District (rural): math 55% / reading 55% proficiency, ranked #310 of 330 in IA (top 94%) — acceptable for families but not a draw, mixed tenant base, ~2y average lease.
- Zoned schools: South Page Elementary School (math 70% / reading 70%, grade A-, #224 of 616 statewide, top 42%, 57 students, 70% FRL); South Page Senior High School (math 54% / reading 64%, grade C+, #263 of 336 statewide, top 81%, 56 students, 71% FRL) — zoned schools average 71% FRL vs 51% district-wide (20 pts higher); higher-poverty schools than district average — tighter screening recommended.
- Market conditions: 1 active listings in the ZIP; 25 units permitted in Page County in 2024 (0 in 5+ unit buildings).
Forward outlook
- In year one you build about $9k of equity ($1k loan paydown + $8k appreciation (3.8% local appreciation)).
- Page County population projected at -12% by 2050 — secular population decline; favor cash flow + early exit over multi-decade hold.
- At projected returns (3.8% appreciation + 3.0% rent growth), your $56k cash investment doubles in ~3 years — after that, you're playing with house money.
- By year 4, paydown + projected appreciation supports a ~$30k cash-out refi (75% LTV) — recoverable capital for the next deal without selling this one.
Negotiation context
- Only 1 days on market — expect competitive offers; lowballing is unlikely to land.
- 2 sale attempts with the ask held roughly flat each time — persistent listings suggest the price (not the market) is what's stuck; bring a comps-based counter.
- Current owner paid $58k; list at $199k implies a 243% gain — meaningful room to come down on a strong offer.
Questions for the listing agent
- Can we see the unit-by-unit rent roll, current vacancy, and any below-market leases? What's the average tenancy length?
- What capital expenditures (roof, boiler, parking lot, exteriors) have been made in the last 5 years, and what's planned in the next 2?
- Built in 1977 — when were the roof, HVAC, electrical panel, plumbing, and water heater last replaced?
- Is there a deadline driving the sale (1031 exchange, divorce, estate, relocation)? That informs how much negotiation room exists.
- Schools are F-rated, which usually means shorter tenancies and higher turnover. Who's the typical renter profile here, and what's been the actual vacancy rate?
- Crime grade is D in this area — have there been break-ins, vandalism, or insurance claims at this property in the last 3 years? What carrier currently insures it and at what premium?
- What's the average days-on-market for RENTAL listings here right now (not sales)? A rising rental-DOM trend means longer vacancies and softer asking-rent achievability than the comps imply.
- What's the recent tenant-quality profile in this submarket — average credit score on applications, eviction rate, late-payment / NSF rate, and stable-employment percentage? A property-management company in the area should have these aggregated.
- How much new apartment / multifamily construction is in the pipeline within 1–3 miles? Heavy new supply (>2% of stock underway) typically softens rents 12–24 months out; light construction supports rent growth.
Investment metrics
- 1% rule
- 1.61% ✓
- Cap rate
- 14.14%
- Cash-on-cash
- 28.03%
- DSCR
- 2.25
- GRM
- 5.2
CMA / ARV
No comps found within radius.
Projected returns pro-forma
3.79% appreciation · 3.0% rent growth · sell at horizon
- IRR
- 35.3%
- Equity multiple
- 3.07×
- Total profit
- $115,259
- Equity at exit
- $98,451
- IRR
- 34.7%
- Equity multiple
- 6.10×
- Total profit
- $284,017
- Equity at exit
- $159,105
Cash invested: $55,720 (down + closing). Projections, not guarantees.
Landlord ↔ Tenant lean methodology
- Overall (STATE)
- 83 Strongly Landlord-Friendly
- State Iowa
- 83 Strongly Landlord-Friendly · R+6
- County
- — inherits STATE
- City
- — inherits STATE
ZIP-level market 51636
- Home prices YoY
- 3.3%
- Active inventory
- 1
- Price-to-rent
- 20.8×
Monthly cashflow live
- Estimated rent
- $3,199 medium interval (Pro) →
- Mortgage (P&I)
- −$1,044
- Tax from tax record
- −$99 /mo · $1,190/yr
- Insurance
- −$83
- HOA
- −$0
- Vacancy / Maint / Mgmt
- −$672
- Net cashflow
- $1,302
Break-even live
Sensitivity live
| Price | -10% $1,414 | -5% $1,358 | +0% $1,302 | +5% $1,245 | +10% $1,189 |
|---|---|---|---|---|---|
| Rent | -10% $1,049 | -5% $1,175 | +0% $1,302 | +5% $1,428 | +10% $1,554 |
| Rate | -1.0pp $1,402 | -0.5pp $1,352 | base $1,302 | +0.5pp $1,250 | +1.0pp $1,198 |
4-unit breakdown (identical units grouped — click to expand)
| Units | Beds | Baths | Est. rent |
|---|---|---|---|
| 3× units | 1 | 1 | $2,385 |
| #1 | 1 | 1 | $795 |
| #2 | 1 | 1 | $795 |
| #3 | 1 | 1 | $795 |
| 1× unit | 2 | 1 | $813 |
| Total (4 units) | $3,199 | ||
UW: 25.0% down · 7.5% · 30yr · 1.5% tax · 5.0% vac · 8.0% maint · 8.0% mgmt
Financing live
Cash to close
- Down payment
- $49,750
- Closing costs
- $5,970
- Reserves months
- —
- Total cash needed
- —
Loan-product check · same deal, 3 products live
Conventional
25% down · 7.5% · 30yr
- Down + closing
- —
- Monthly P&I
- —
- Monthly cashflow
- —
- DSCR
- —
- Eligible?
- —
Personal DTI + credit; lowest rate.
DSCR
20% down · 8.5% · 30yr
- Down + closing
- —
- Monthly P&I
- —
- Monthly cashflow
- —
- DSCR
- —
- Eligible?
- —
No personal income docs; deal must DSCR.
Hard money
10% down · 12.0% · 12mo
- Down + closing
- —
- Monthly P&I
- —
- Monthly cashflow
- —
- DSCR
- —
- Eligible?
- —
Short-term bridge; refi at stabilization.
Listing history 6 events
-
2026-05-26$199,000 Active
-
2026-02-26historical $550
-
2026-02-06$550
-
2022-04-13price $465
-
2021-07-16soldstatus $58,000
-
2003-11-09soldstatus $36,000
ⓘ Source: listings_history table (triggers on properties + properties_extension) + one-shot
backfill from property_details.listing_events for pre-trigger history.
Tax reassessment forecast IA · Partial reset (capped growth)
- Current annual tax
- $1,190 · $99/mo
- Projected year-2 tax
- $2,157 · $180/mo
- Expected delta
- +$967/yr (+$81/mo · 81.3%)
ⓘ Screening estimate from a state-policy table — verify with the county assessor before closing.
Climate risk First Street
- Flood 1/10 Low FEMA zone X (unshaded) · 0% chance over 30 yrs
- Wildfire 2/10 Low
- Heat 3/10 Moderate 7 d/yr ≥106°F today · 15 d/yr by 30 yrs out
- Wind 2/10 Low
- Air quality 1/10 Low 0 unhealthy d/yr today · 0 by 30 yrs out
Nearby sold comps map
Loading sold comps map…
Walkable amenities ~0.75 mi
Loading nearby amenities…
Taxation est. · year 1
- Rental income
- $38,388
- − Mortgage interest
- −$11,147
- − Property taxes
- −$1,190
- − Insurance
- −$995
- − Repairs & maintenance
- −$3,071
- − Management
- −$3,071
- − Depreciation
- −$5,789
- Taxable income
- $13,125
- Est. tax owed @ 24.0%
- −$3,150
- After-tax cash flow
- $12,469/yr
For passive investors: Depreciation is non-cash, so a rental often shows a tax loss while cash-flowing — sheltering income. Rental losses are passive: they offset passive income freely, and up to $25,000/yr can offset ordinary (W-2) income if you actively participate and your MAGI is under $100k (phasing out to $0 by $150k); unused losses carry forward. On sale, claimed depreciation is recaptured at up to 25%, and gains may owe capital-gains tax (a 1031 exchange can defer both). Figures are a year-1 estimate at your 24.0% rate — not tax advice; consult a CPA.
Schools (NCES district)
- District
- South Page Community School District
- NCES district ID
- 1926670
- Math proficiency
- 55% ▼ -5.00%
- Reading proficiency
- 55% ▼ -10.00%
- Median HH income
- $43,201
- Composite
- 48.1/100
- National rank
- #4754
- State rank
- #310 of 330 in IA
Livability — Coin
- Score
- 58/100
- State rank
- #888
- US rank
- #20761
Category grades
Schools grade is shown separately in the Schools card above.
Census & demographics
- Census place
- Coin, IA
- Population (ZIP)
- 497
Population outlook (Page County) Hauer SSP2
- Today (2025)
- 15,052 people
- By 2030
- 14,709 · -2.3%
- By 2040
- 13,981 · -7.1%
- By 2050
- 13,302 · -11.6%
- By 2075
- 11,678 · -22.4%
- By 2100
- 9,213 · -38.8%
Race, ethnicity, and origin ACS 2023
- Neighborhood character
- Predominantly White (98%)
- Race & ethnicity
- White 98% Hispanic / Latino 2%
- Common ancestry
- Slovak 4% Portuguese 3% Romanian 1%
Political lean MEDSL · Page
- 2024 margin
- Solid R (+42.4) · D 28.2% · R 70.6% · Other 1.1%
- 2008→2024 swing
- -22.7pp toward R · 2008: -19.7pp · 2024: -42.4pp
- All cycles
- 2024: R+42.4 2020: R+43.0 2016: R+44.1 2012: R+24.9 2008: R+19.7
Not yet ingested
- Civics
- —
Market trends
- HPI YoY
- ▲ 3.79%
- Current HPI
- 119.5625
- Rent YoY
- —
- Metro
- —
- State GDP YoY
- ▲ 2.48%
- F500 in state
- 4
Industry mix (Fortune 500 HQ in IA)
| Industry | F500 HQs | Revenue |
|---|---|---|
| Financial Services | 1 | $16B |
|
||
| Retail / Convenience | 1 | $15B |
|
||
Price history
+452.8% since first listed6 events — show timeline
- 2026-05-26 Listed $199,000 FSBO.com
- 2026-02-26 Rental Removed $550 TURBOTENANT
- 2026-02-06 Listed for Rent $550 TURBOTENANT
- 2022-04-13 Price Changed $465 RENT.
- 2021-07-16 Sold (Public Records) $58,000 Public Records
- 2003-11-09 Sold (Public Records) $36,000 Public Records
Property tax history
-3.7%/yrLatest (2025): $1,190 · -2.1% YoY. Source: county tax records.
Cash-flow waterfall
monthlySold comps — $/sqft
last 12 mo · ≤1 miLoading sold comps…