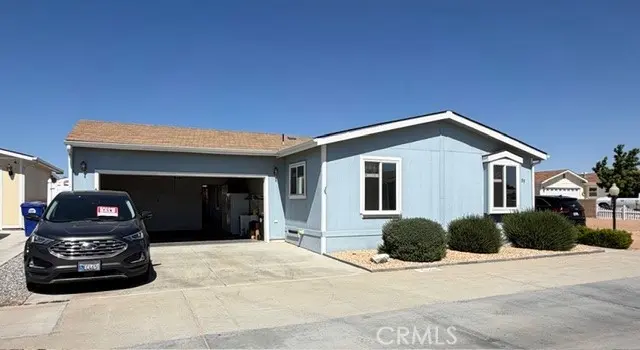
22241 Nisqually #89 · Apple Valley, CA
Flood risk 1/10 · Minimal
- FEMA flood zone
- D
- Chance of flooding over 30 yrs
- 0.0%
- Est. flood insurance / yr
- $544 – $1,084
Fire risk 6/10 · Moderate
- Est. fire insurance / yr
- $659 – $1,223
Heat risk 7/10 · Major
- Hot days now (above 100°F)
- 4 days/yr
- Hot days in 30 yrs
- 11 days/yr
Wind risk 1/10 · Minimal
- Chance of severe wind over 30 yrs
- —
Air-quality risk 10/10 · Severe
- Unhealthy air days now
- 25 days/yr
- Unhealthy air days in 30 yrs
- 30 days/yr
Risk factors via First Street. Map © Google.
Why this score? — see what drove the B- grade
The composite is a weighted blend of 9 inputs, each scored 0–100. Each bar is that input's sub-score; the figure is the points it added to the 100-point composite (weight × sub-score).
- Cash flow +30.0/30.0
- DSCR +10.0/10.0
- ARV discount +8.8/15.0
- 1% rule +8.2/10.0
- Rent growth +3.6/5.0
- Schools +3.1/10.0
- Livability +3.1/5.0
- Condition / age +2.5/5.0
- Appreciation +0.0/10.0
$170,000
🖨 Deal sheet 📄 Offer letter ✓ Due diligence
Listing remarks MLS
Located in beautiful Vista del Rosa, formerly Indian Village Estates, a prestigious five star gated community, this home offers 3 bedrooms and 2 full bathrooms with a double car garage, custom patio and walkway, garden, fruit trees, superior construction, upgraded appliances and much more. Don't miss your chance to own this beautiful home. Vista del Rosa is definitely Apple Valley's Best Kept Secret! # of RV Spaces: 0 Special Features: Breakfast Nook, Garage Door Opener, SkylightAUTS FireplaceFeatures: None Pool Features: Common Pool Zoning: Residential 1 # of Attached Spaces: 0 # of Detached Spaces: 0 # of RV Spaces: 0
Key facts
- Gated community
- Open floor plan
- Private retreat area
Tags
Property features AI
Finance
- Other: Manager approval required for multi-unit / double body; Pets: contact manager
- Financial info: Land lease: $845 per month (park)
- HOA & community: Senior community; Park name: Vista Del Rosa; Community features: rural setting, dog park, suburban area, park
Exterior
- Parking: Attached garage; 2 garage spaces; Driveway (concrete); Garage with single door and front entry; 2 total parking spaces
- Security: Smoke detector; Gated community; Resident manager
- Utilities: Public/district water; Public sewer / sewer connected; Natural gas connected; Standard electric; Telephone in street
- Home design: Single-story home; Entry level: 1; Mobile home model: INFINITI II; Mobile home remains on site; Has a view; Access via city streets; Paved road frontage
- Construction: Mobile home width 26 ft, length 60 ft; Year built source: public records
- Exterior features: Block wall and vinyl fencing; Back yard; Garden; Yard; In-ground community pool (fenced)
Interior
- Kitchen: Stone counters; Kitchen island; Gas range; Gas oven; Microwave; Dishwasher; Gas water heater; Water heater unit
- Bedrooms: All bedrooms on one level
- Flooring: Vinyl; Carpet; Laminate
- Bathrooms: Two full bathrooms; Soaking tub; Separate tub and shower; Walk-in shower; Shower in tub; Bathtub; Double sinks in master bath; Linen closet/storage
- Heating & cooling: Central air conditioning; Central furnace
- Interior features: Ceiling fan; Stone counters; Cathedral/vaulted ceilings; Smoke detector; Gated community; Resident manager
- Laundry & utility: In-unit laundry room; Washer included; Dryer included; Washer hookup; Gas dryer hookup; Individual laundry room
Neighborhood map
What this means for you Summary
Snapshot
- This is a 3-bed/2.0-bath manufactured listed at $170k.
Deal economics
- At list price, monthly cash flow is $738 ($9k/yr) — positive.
- The deal already cash-flows at list — no discount required.
- Meets the 1% rule at list price ($2k rent vs $170k).
- Recommended offer: $165k (3.0% below list) — sets the bar for market timing.
- Cap rate 11.5% vs local median 3.5% in Apple Valley — top-decile yield for the area; either an underpriced asset or a hidden risk that comps aren't pricing in. Stress-test before assuming the spread holds.
Location & tenants
- Location reads 61/100 on livability (#532 in CA) — a middle-class / working-renter tenant base. Strengths: housing A+, commute B+; Watch: employment D+, schools F, crime D-.
- Apple Valley Unified (suburban): math 25% / reading 40% proficiency, ranked #955 of 1,400 in CA (top 68%) — families likely to look elsewhere, expect single-tenant / working-renter base with shorter leases; 60% free/reduced lunch — lower-income household profile, screen leases tightly.
- Market conditions: Rents rising fast (+4.3%/yr); 417 active listings in the ZIP; 8 comparable units currently listed for rent nearby; rentals at typical pace (median 22d on market — plan ~3-4 weeks tenant-placement turnaround); 5,458 units permitted in San Bernardino County in 2024 (1,500 in 5+ unit buildings).
- This rent runs 40% of the median local income ($67k/yr) — at the standard rent-burdened threshold; future hikes will face affordability resistance.
Forward outlook
- Local home prices are declining (-3.0%/yr); year-one equity from $1k of loan paydown is wiped out by about $5k of value loss. Plan a longer hold.
- San Bernardino County population projected at +15% by 2050 — modest demand growth; plan on rents tracking national, not racing it.
- At projected returns (-3.0% appreciation + 4.3% rent growth), your $48k cash investment doubles in ~7 years — after that, you're playing with house money.
Negotiation context
- It's been on market 31 days — a 3% lower offer ($165k) is reasonable based on typical stale-listing flexibility.
- 2 sale attempts since 13y ago with the ask held roughly flat each time — persistent listings suggest the price (not the market) is what's stuck; bring a comps-based counter.
- Current owner paid $56k; list at $170k implies a 204% gain — meaningful room to come down on a strong offer.
Risks & watch-outs
- Climate carrying-cost: major wildfire risk; extreme-heat days projected 4→11/yr by 2055 (HVAC capex compounding) — expect insurance premiums to compound above CPI over the hold.
Questions for the listing agent
- It's been on market 31 days. Have you received any prior offers? Is the seller open to a 3% concession, seller financing, or rate buy-down credit?
- Is there a deadline driving the sale (1031 exchange, divorce, estate, relocation)? That informs how much negotiation room exists.
- Schools are F-rated, which usually means shorter tenancies and higher turnover. Who's the typical renter profile here, and what's been the actual vacancy rate?
- Crime grade is D in this area — have there been break-ins, vandalism, or insurance claims at this property in the last 3 years? What carrier currently insures it and at what premium?
- What's the average days-on-market for RENTAL listings here right now (not sales)? A rising rental-DOM trend means longer vacancies and softer asking-rent achievability than the comps imply.
- What's the recent tenant-quality profile in this submarket — average credit score on applications, eviction rate, late-payment / NSF rate, and stable-employment percentage? A property-management company in the area should have these aggregated.
- How much new for-sale + rental construction is in the pipeline within 1–3 miles? Heavy new supply typically softens prices + rents 12–24 months out; constrained supply supports both.
Investment metrics
- 1% rule
- 1.32% ✓
- Cap rate
- 11.50%
- Cash-on-cash
- 18.61%
- DSCR
- 1.83
- GRM
- 6.3
CMA / ARV
- ARV (on-the-fly)
- $174,960
- Comps found
- 12
Show comp detail 12 sales within ~0.75 mi
| Address | Dist | Beds/Ba | Sqft | Sold | Price | $/sf | Match |
|---|---|---|---|---|---|---|---|
| 22241 Nisqually #124 | 0.00mi | 3/2.0 | 1,563 (-4%) | 2mo | $175,000 | $112 | 92 |
| 22241 Nisqually Rd #71 | 0.00mi | 3/2.0 | 1,593 (-2%) | 9mo | $165,000 | $104 | 89 |
| 22241 Nisqually Rd #106 | 0.00mi | 3/2.0 | 1,620 (0%) | 15mo | $175,000 | $108 | 88 |
| 22241 Nisqually Rd #54 | 0.00mi | 3/2.0 | 1,620 (0%) | 16mo | $161,000 | $99 | 87 |
| 22241 Nisqually Rd #153 | 0.00mi | 3/2.0 | 1,512 (-7%) | 4mo | $176,000 | $116 | 86 |
| 22241 Nisqually Rd #158 | 0.00mi | 3/2.0 | 1,542 (-5%) | 11mo | $203,200 | $132 | 83 |
| 22241 Nisqually Rd #33 | 0.00mi | 3/2.0 | 1,530 (-6%) | 10mo | $198,000 | $129 | 82 |
| 22241 Nisqually Rd #24 | 0.00mi | 3/2.0 | 1,591 (-2%) | 18mo | $160,000 | $101 | 82 |
| 22241 Nisqually Rd #98 | 0.00mi | 4/2.0 (+1) | 1,723 (+6%) | 8mo | $195,000 | $113 | 78 |
| 22241 Nisqually Rd #169 | 0.00mi | 3/2.0 | 1,392 (-14%) | 3mo | $140,000 | $101 | 74 |
| 22241 Nisqually Rd #27 | 0.00mi | 3/2.0 | 1,782 (+10%) | 14mo | $175,000 | $98 | 72 |
| 22241 Nisqually Rd #139 | 0.00mi | 3/2.0 | 1,834 (+13%) | 14mo | $178,900 | $98 | 66 |
Match score weights: distance 35% · size 25% · config 20% · recency 20%. Top-matched comps best support the ARV.
Projected returns pro-forma
-3.0% appreciation · 4.3% rent growth · sell at horizon
- IRR
- 11.7%
- Equity multiple
- 1.47×
- Total profit
- $22,383
- Equity at exit
- $25,348
- IRR
- 21.6%
- Equity multiple
- 2.94×
- Total profit
- $92,317
- Equity at exit
- $14,698
Cash invested: $47,600 (down + closing). Projections, not guarantees.
Landlord ↔ Tenant lean methodology
- Overall (STATE)
- 18 Strongly Tenant-Friendly
- State California
- 18 Strongly Tenant-Friendly · D+13
- County
- — inherits STATE
- City
- — inherits STATE
ZIP-level market 92308
- Home prices YoY
- -28.8%
- Rents YoY
- 4.3%
- Active inventory
- 417
- Price-to-rent
- 6.3×
Monthly cashflow live
- Estimated rent
- $2,240 high interval (Pro) →
- Mortgage (P&I)
- −$891
- Tax from tax record
- −$69 /mo · $829/yr
- Insurance
- −$71
- HOA
- −$0
- Vacancy / Maint / Mgmt
- −$470
- Net cashflow
- $738
Break-even live
UW: 25.0% down · 7.5% · 30yr · 1.5% tax · 5.0% vac · 8.0% maint · 8.0% mgmt
Financing live
Cash to close
- Down payment
- $42,500
- Closing costs
- $5,100
- Reserves months
- —
- Total cash needed
- —
Loan-product check · same deal, 3 products live
Conventional
25% down · 7.5% · 30yr
- Down + closing
- —
- Monthly P&I
- —
- Monthly cashflow
- —
- DSCR
- —
- Eligible?
- —
Personal DTI + credit; lowest rate.
DSCR
20% down · 8.5% · 30yr
- Down + closing
- —
- Monthly P&I
- —
- Monthly cashflow
- —
- DSCR
- —
- Eligible?
- —
No personal income docs; deal must DSCR.
Hard money
10% down · 12.0% · 12mo
- Down + closing
- —
- Monthly P&I
- —
- Monthly cashflow
- —
- DSCR
- —
- Eligible?
- —
Short-term bridge; refi at stabilization.
Rent comps 8 comps
| Address | Beds | Baths | Sqft | Rent | $/sqft | DOM | Units | Dist |
|---|---|---|---|---|---|---|---|---|
| 12406 Pawnee Rd Apple Valley, CA | 3.0 | 1.5 | 1488 | $2,200 | $1.48 | 16d | 1 | 0.68mi |
| 22544 Sioux Rd Unit 31 Apple Valley, CA | 3.0 | 2.0 | 1236 | $1,795 | $1.45 | 20d | 1 | 0.78mi |
| 22873 Ottawa Rd Apple Valley, CA | 3.0 | 2.0 | 1542 | $2,000 | $1.30 | 43d | 1 | 1.00mi |
| 13207 Franceska Rd Apple Valley, CA | 3.0 | 1.0 | 1440 | $2,200 | $1.53 | 1d | 1 | 1.18mi |
| 21256 Vidal Ct Apple Valley, CA | 3.0 | 2.0 | 1543 | $2,550 | $1.65 | 43d | 1 | 1.21mi |
| 22854 Itasca Rd Apple Valley, CA | 4.0 | 2.0 | 1814 | $1,995 | $1.10 | 21d | 1 | 1.28mi |
| 22039 Biloxi Ave Unit 2-3 Apple Valley, CA | 3.0 | 2.0 | 1250 | $2,200 | $1.76 | 43d | 1 | 1.30mi |
| 21018 Little Beaver Rd Apple Valley, CA | 3.0 | 2.0 | 1144 | $2,800 | $2.45 | 5d | 1 | 1.50mi |
Listing history 18 events
-
2026-06-18days on market $170,000 Active 31 DOM
-
2026-06-17days on market $170,000 Active 30 DOM
-
2026-06-16days on market $170,000 Active 29 DOM
-
2026-06-15days on market $170,000 Active 28 DOM
-
2026-06-13days on market $170,000 Active 26 DOM
-
2026-06-13days on market $170,000 Active 25 DOM
-
2026-06-09days on market $170,000 Active 22 DOM
-
2026-06-08days on market $170,000 Active 21 DOM
-
2026-06-07days on market $170,000 Active 20 DOM
-
2026-06-04days on market $170,000 Active 17 DOM
-
2026-06-03days on market $170,000 Active 16 DOM
-
2026-06-02days on market $170,000 Active 15 DOM
-
2026-06-01days on market $170,000 Active 14 DOM
-
2026-05-31days on market $170,000 Active 13 DOM
-
2026-05-18$170,000 Active
-
2013-11-08soldstatus $56,000 628-char remark
Show marketing remark (628 chars)
Located in beautiful Vista del Rosa, formerly Indian Village Estates, a prestigious five star gated community, this home offers 3 bedrooms and 2 full bathrooms with a double car garage, custom patio and walkway, garden, fruit trees, superior construction, upgraded appliances and much more. Don't miss your chance to own this beautiful home. Vista del Rosa is definitely Apple Valley's Best Kept Secret! # of RV Spaces: 0 Special Features: Breakfast Nook, Garage Door Opener, SkylightAUTS FireplaceFeatures: None Pool Features: Common Pool Zoning: Residential 1 # of Attached Spaces: 0 # of Detached Spaces: 0 # of RV Spaces: 0
-
2013-05-08$57,500 628-char remark
Show marketing remark (628 chars)
Located in beautiful Vista del Rosa, formerly Indian Village Estates, a prestigious five star gated community, this home offers 3 bedrooms and 2 full bathrooms with a double car garage, custom patio and walkway, garden, fruit trees, superior construction, upgraded appliances and much more. Don't miss your chance to own this beautiful home. Vista del Rosa is definitely Apple Valley's Best Kept Secret! # of RV Spaces: 0 Special Features: Breakfast Nook, Garage Door Opener, SkylightAUTS FireplaceFeatures: None Pool Features: Common Pool Zoning: Residential 1 # of Attached Spaces: 0 # of Detached Spaces: 0 # of RV Spaces: 0
-
2007-09-13soldstatus $161,500 382-char remark
Show marketing remark (382 chars)
Located in beautiful Vista del Rosa, formerly Indian Village Estates, a prestigious five star gated community, this home offers 3 bedrooms and 2 full bathrooms with a double car garage, custom patio and walkway, superior construction, upgraded appliances and much more. Don't miss your chance to own this beautiful home. Vista del Rosa is definitely Apple Valley's Best Kept Secret!
ⓘ Source: listings_history table (triggers on properties + properties_extension) + one-shot
backfill from property_details.listing_events for pre-trigger history.
Tax reassessment forecast CA · Resets to sale price
- Current annual tax
- $829 · $69/mo
- Projected year-2 tax
- $1,292 · $108/mo
- Expected delta
- +$463/yr (+$39/mo · 55.9%)
ⓘ Screening estimate from a state-policy table — verify with the county assessor before closing.
Climate risk First Street
- Flood 1/10 Low FEMA zone D · 0% chance over 30 yrs
- Wildfire 6/10 Major
- Heat 7/10 Severe 4 d/yr ≥100°F today · 11 d/yr by 30 yrs out
- Wind 1/10 Low
- Air quality 10/10 Extreme 25 unhealthy d/yr today · 30 by 30 yrs out
Nearby sold comps map
Loading sold comps map…
Walkable amenities ~0.75 mi
Loading nearby amenities…
Taxation est. · year 1
- Rental income
- $26,880
- − Mortgage interest
- −$9,523
- − Property taxes
- −$829
- − Insurance
- −$850
- − Repairs & maintenance
- −$2,150
- − Management
- −$2,150
- − Depreciation
- −$4,945
- Taxable income
- $6,432
- Est. tax owed @ 24.0%
- −$1,544
- After-tax cash flow
- $7,315/yr
For passive investors: Depreciation is non-cash, so a rental often shows a tax loss while cash-flowing — sheltering income. Rental losses are passive: they offset passive income freely, and up to $25,000/yr can offset ordinary (W-2) income if you actively participate and your MAGI is under $100k (phasing out to $0 by $150k); unused losses carry forward. On sale, claimed depreciation is recaptured at up to 25%, and gains may owe capital-gains tax (a 1031 exchange can defer both). Figures are a year-1 estimate at your 24.0% rate — not tax advice; consult a CPA.
Schools (NCES district)
- District
- Apple Valley Unified
- NCES district ID
- 0600017
- Math proficiency
- 25% ▬ 0.00%
- Reading proficiency
- 40% ▬ 0.00%
- Median HH income
- $49,264
- Composite
- 30.91/100
- National rank
- #11351
- State rank
- #955 of 1400 in CA
Livability — Apple Valley
- Score
- 61/100
- State rank
- #532
- US rank
- #17800
Category grades
Schools grade is shown separately in the Schools card above.
Census & demographics
- Census place
- Apple Valley, CA
- County
- San Bernardino County · 2,030,291 people
- City population
- 83,889
- Metro
- Riverside-San Bernardino-Ontario, CA
- Population (ZIP)
- 42,709
- Household income
- $66,568
- Rent vs Own
- Severe rent burden
- 1389.0
Population outlook (San Bernardino County) Hauer SSP2
- Today (2025)
- 2,300,329 people
- By 2030
- 2,378,907 · +3.4%
- By 2040
- 2,523,137 · +9.7%
- By 2050
- 2,642,388 · +14.9%
- By 2075
- 2,880,769 · +25.2%
- By 2100
- 2,909,436 · +26.5%
Race, ethnicity, and origin ACS 2023
- Neighborhood character
- Diverse neighborhood (Simpson 0.65)
- Race & ethnicity
- White 44% Hispanic / Latino 38% Two or more races 19% Black 9% Asian 3%
- Hispanic origin (detail)
- Mexican 34%
- Common ancestry
- Italian 1% Iranian 1% Slovak 1%
- Foreign-born
- 11% · Canada, South Korea
- Languages at home
- 75% English-only · Spanish 20% Tagalog/Filipino 1% Other Asian/Pacific 1%
Political lean MEDSL · San Bernardino
- 2024 margin
- Toss-up / Even · D 47.5% · R 49.7% · Other 2.8%
- 2008→2024 swing
- -8.5pp toward R · 2008: 6.3pp · 2024: -2.1pp
- All cycles
- 2024: R+2.1 2020: D+10.7 2016: D+9.8 2012: D+5.4 2008: D+6.3
Not yet ingested
- Civics
- —
Market trends
- HPI YoY
- ▼ -145.60%
- Current HPI
- 359.2305
- Rent YoY
- ▲ 4.30%
- Metro
- Riverside-San Bernardino-Ontario, CA
- State GDP YoY
- ▲ 3.21%
- F500 in state
- 116
Industry mix (Fortune 500 HQ in CA)
| Industry | F500 HQs | Revenue |
|---|---|---|
| Technology | 27 | $1,492B |
|
||
| Financial Services | 3 | $174B |
|
||
| Retail | 3 | $44B |
|
||
| Insurance | 3 | $26B |
|
||
| Media / Entertainment | 2 | $115B |
|
||
| Pharmaceuticals / Biotech | 2 | $62B |
|
||
Price history
+5.3% since first listed4 events — show timeline
- 2026-05-18 Listed $170,000 CRMLS
- 2013-11-08 Sold (MLS) $56,000 CRMLS
- 2013-05-08 Listed $57,500 CRMLS
- 2007-09-13 Sold (MLS) $161,500 CRMLS
Property tax history
-2.5%/yrLatest (2025): $829 · -24.4% YoY. Source: county tax records.
Cash-flow waterfall
monthlySold comps — $/sqft
last 12 mo · ≤1 miLoading sold comps…