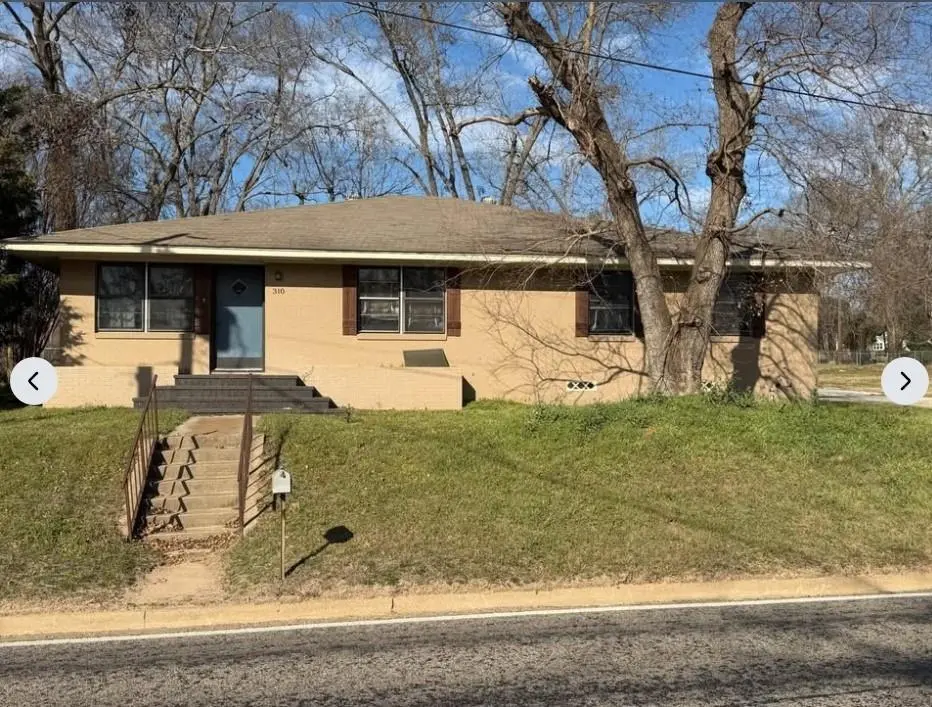
310 W Pine St · Frankston, TX
Flood risk 1/10 · Minimal
- FEMA flood zone
- X (unshaded)
- Chance of flooding over 30 yrs
- 0.0%
- Est. flood insurance / yr
- $507 – $1,088
Fire risk 4/10 · Minor
- Est. fire insurance / yr
- $1,222 – $2,270
Heat risk 7/10 · Major
- Hot days now (above 109°F)
- 7 days/yr
- Hot days in 30 yrs
- 26 days/yr
Wind risk 6/10 · Moderate
- Chance of severe wind over 30 yrs
- 68.0%
Air-quality risk 1/10 · Minimal
- Unhealthy air days now
- 0 days/yr
- Unhealthy air days in 30 yrs
- 0 days/yr
Risk factors via First Street. Map © Google.
Why this score? — see what drove the B grade
The composite is a weighted blend of 9 inputs, each scored 0–100. Each bar is that input's sub-score; the figure is the points it added to the 100-point composite (weight × sub-score).
- Cash flow +25.8/30.0
- Appreciation +10.0/10.0
- 1% rule +9.3/10.0
- DSCR +8.6/10.0
- ARV discount +7.5/15.0
- Schools +4.4/10.0
- Livability +3.1/5.0
- Rent growth +2.5/5.0
- Condition / age +2.5/5.0
$115,000
🖨 Deal sheet (PDF) 📄 Offer letter ✓ Due diligence
Listing remarks
Opportunity in Frankston! This home has experienced fire damage to the interior and is being sold as is. The property offers a chance for renovation and restoration, with potential to bring it back to life. Situated on a spacious lot in an established area with convenient access to local amenities, schools, and major roadways. Ideal for buyers ready to take on a project and customize a home to their vision.
Key facts
- 0.61 acre lot
- Built 1900
- Listed 28 days
Property features AI
Finance
- Other: Parcel/Tax: HOLCOMB BLOCK 1 LOT 3B
- Financial info: Treat as clear loan type; No second mortgage
- HOA & community: No association (no HOA)
Exterior
- Parking: No covered or carport spaces listed; Parking described as: Other
- Security: No security features provided
- Utilities: Utilities: Other; Not in a municipal utility district
- Home design: Single-family residence; Residential property; Entry level: main level; Built in 1900
- Construction: Year built: 1900; No construction materials, roof, or foundation details provided
- Exterior features: Approximately 0.606-acre lot; Located in the Holcomb subdivision; Directions: From US Highway 175, turn onto FM 837 heading into town. Continue straight, then turn onto W Pine St. The property will be on your left.
Interior
- Kitchen: Other appliances
- Bedrooms: 4 bedrooms (all on the main level, including a primary bedroom)
- Flooring: No flooring information provided
- Bathrooms: 2 full bathrooms
- Heating & cooling: No heating or cooling information provided
- Interior features: One-level layout; Dining area; Other interior features
- Laundry & utility: No specific laundry details provided
Neighborhood map
What this means for you Summary
Snapshot
- This is a 4-bed/2.0-bath single-family listed at $115k.
Deal economics
- At list price, monthly cash flow is $279 ($3k/yr) — positive.
- The deal already cash-flows at list — no discount required.
- Meets the 1% rule at list price ($2k rent vs $115k).
- Recommended offer: $113k (1.5% below list) — sets the bar for market timing.
Location & tenants
- Location reads 62/100 on livability (#918 in TX) — a middle-class / working-renter tenant base. Strengths: cost of living A+; Watch: employment D+, amenities F, commute F.
- Frankston ISD (rural): math 54% / reading 49% proficiency, ranked #155 of 826 in TX (top 19%) — acceptable for families but not a draw, mixed tenant base, ~2y average lease.
- Zoned schools: Frankston El (math 57% / reading 52%, grade C, #621 of 4,322 statewide, top 15%, 373 students, 63% FRL); Frankston Middle (math 57% / reading 42%, grade C, #356 of 1,662 statewide, top 23%, 184 students, 62% FRL); Frankston H S (math 24% / reading 62%, grade F, #708 of 1,632 statewide, top 44%, 245 students, 50% FRL).
- Market conditions: 191 active listings in the ZIP; 29 units permitted in Anderson County in 2024 (0 in 5+ unit buildings).
Forward outlook
- In year one you build about $12k of equity ($795 loan paydown + $12k appreciation (10.0% local appreciation)).
- Anderson County population projected at +4% by 2050 — modest demand growth; plan on rents tracking national, not racing it.
- At projected returns (10.0% appreciation + 3.0% rent growth), your $32k cash investment doubles in ~2 years — after that, you're playing with house money.
- By year 3, paydown + projected appreciation supports a ~$31k cash-out refi (75% LTV) — recoverable capital for the next deal without selling this one.
Negotiation context
- It's been on market 29 days — a 2% lower offer ($113k) is reasonable based on typical stale-listing flexibility.
Risks & watch-outs
- Watch-outs: property tax is 3.8% of price; built in 1900 — expect roof / HVAC / electrical / plumbing capex.
- Climate carrying-cost: major wind risk, 68% chance of damaging wind over 30y; extreme-heat days projected 7→26/yr by 2055 (HVAC capex compounding) — expect insurance premiums to compound above CPI over the hold.
Questions for the listing agent
- Built in 1900 — when were the roof, HVAC, electrical panel, plumbing, and water heater last replaced?
- Property tax is high relative to price — has the assessment been appealed recently, and will the sale trigger a re-assessment?
- Is there a deadline driving the sale (1031 exchange, divorce, estate, relocation)? That informs how much negotiation room exists.
- What's the average days-on-market for RENTAL listings here right now (not sales)? A rising rental-DOM trend means longer vacancies and softer asking-rent achievability than the comps imply.
- What's the recent tenant-quality profile in this submarket — average credit score on applications, eviction rate, late-payment / NSF rate, and stable-employment percentage? A property-management company in the area should have these aggregated.
- How much new for-sale + rental construction is in the pipeline within 1–3 miles? Heavy new supply typically softens prices + rents 12–24 months out; constrained supply supports both.
Investment metrics
- 1% rule
- 1.43% ✓
- Cap rate
- 9.21%
- Cash-on-cash
- 10.41%
- DSCR
- 1.46
- GRM
- 5.8
CMA / ARV
- ARV (median comp)
- $260,188
- List price
- $115,000
- Delta
- -55.80%
- Verdict
- UNDERPRICED
- Comps
- 8 within 1.0 mi
Show comp detail 5 sales within ~0.75 mi
| Address | Dist | Beds/Ba | Sqft | Sold | Price | $/sf | Match |
|---|---|---|---|---|---|---|---|
| 190 N Commerce St | 0.21mi | 4/2.0 | 2,256 (+6%) | 11mo | $195,000 | $86 | 71 |
| 409 N Elm St | 0.52mi | 4/2.0 | 2,407 (+14%) | 1mo | $344,900 | $143 | 53 |
| 104 W Perry St | 0.66mi | 4/2.0 | 1,990 (-6%) | 10mo | $285,000 | $143 | 51 |
| 149 Pecan St | 0.57mi | 4/3.5 | 2,340 (+10%) | 1mo | $270,000 | $115 | 49 |
| 812 Walters St | 0.63mi | 4/2.0 | 1,956 (-8%) | 11mo | $255,000 | $130 | 48 |
Match score weights: distance 35% · size 25% · config 20% · recency 20%. Top-matched comps best support the ARV.
Projected returns pro-forma
10.0% appreciation · 3.0% rent growth · sell at horizon
- IRR
- 32.0%
- Equity multiple
- 3.50×
- Total profit
- $80,591
- Equity at exit
- $103,601
- IRR
- 27.6%
- Equity multiple
- 7.95×
- Total profit
- $223,654
- Equity at exit
- $223,420
Cash invested: $32,200 (down + closing). Projections, not guarantees.
Landlord ↔ Tenant lean methodology
- Overall (STATE)
- 87 Strongly Landlord-Friendly
- State Texas
- 87 Strongly Landlord-Friendly · R+5
- County
- — inherits STATE
- City
- — inherits STATE
ZIP-level market 75763
- Home prices YoY
- 22.2%
- Active inventory
- 191
- Price-to-rent
- 5.8×
Monthly cashflow live
- Estimated rent
- $1,642 medium interval (Pro) →
- Mortgage (P&I)
- −$603
- Tax from tax record
- −$367 /mo · $4,399/yr
- Insurance
- −$48
- HOA
- −$0
- Vacancy / Maint / Mgmt
- −$345
- Net cashflow
- $279
Break-even live
Sensitivity live
| Price | -10% $345 | -5% $312 | +0% $279 | +5% $247 | +10% $214 |
|---|---|---|---|---|---|
| Rent | -10% $150 | -5% $215 | +0% $279 | +5% $344 | +10% $409 |
| Rate | -1.0pp $337 | -0.5pp $309 | base $279 | +0.5pp $250 | +1.0pp $219 |
UW: 25.0% down · 7.5% · 30yr · 1.5% tax · 5.0% vac · 8.0% maint · 8.0% mgmt
Financing live
Cash to close
- Down payment
- $28,750
- Closing costs
- $3,450
- Reserves months
- —
- Total cash needed
- —
Loan-product check · same deal, 3 products live
Conventional
25% down · 7.5% · 30yr
- Down + closing
- —
- Monthly P&I
- —
- Monthly cashflow
- —
- DSCR
- —
- Eligible?
- —
Personal DTI + credit; lowest rate.
DSCR
20% down · 8.5% · 30yr
- Down + closing
- —
- Monthly P&I
- —
- Monthly cashflow
- —
- DSCR
- —
- Eligible?
- —
No personal income docs; deal must DSCR.
Hard money
10% down · 12.0% · 12mo
- Down + closing
- —
- Monthly P&I
- —
- Monthly cashflow
- —
- DSCR
- —
- Eligible?
- —
Short-term bridge; refi at stabilization.
Listing history 4 events
-
2026-05-12price $115,000 410-char remark
-
2026-04-28$125,000 Active 410-char remark
-
2013-07-17soldstatus
-
2004-01-26soldstatus
ⓘ Source: listings_history table (triggers on properties + properties_extension) + one-shot
backfill from property_details.listing_events for pre-trigger history.
Tax reassessment forecast TX · Resets to sale price
- Current annual tax
- $4,399 · $367/mo
- Projected year-2 tax
- $4,399 · $367/mo
- Expected delta
- $0/yr ($0/mo · 0.0%)
ⓘ Screening estimate from a state-policy table — verify with the county assessor before closing.
Climate risk First Street
- Flood 1/10 Low FEMA zone X (unshaded) · 0% chance over 30 yrs
- Wildfire 4/10 Moderate
- Heat 7/10 Severe 7 d/yr ≥109°F today · 26 d/yr by 30 yrs out
- Wind 6/10 Major 68% chance of damaging wind over 30 yrs
- Air quality 1/10 Low 0 unhealthy d/yr today · 0 by 30 yrs out
Nearby sold comps map
Loading sold comps map…
Walkable amenities ~0.75 mi
Loading nearby amenities…
Taxation est. · year 1
- Rental income
- $19,701
- − Mortgage interest
- −$6,442
- − Property taxes
- −$4,399
- − Insurance
- −$575
- − Repairs & maintenance
- −$1,576
- − Management
- −$1,576
- − Depreciation
- −$3,345
- Taxable income
- $1,788
- Est. tax owed @ 24.0%
- −$429
- After-tax cash flow
- $2,924/yr
For passive investors: Depreciation is non-cash, so a rental often shows a tax loss while cash-flowing — sheltering income. Rental losses are passive: they offset passive income freely, and up to $25,000/yr can offset ordinary (W-2) income if you actively participate and your MAGI is under $100k (phasing out to $0 by $150k); unused losses carry forward. On sale, claimed depreciation is recaptured at up to 25%, and gains may owe capital-gains tax (a 1031 exchange can defer both). Figures are a year-1 estimate at your 24.0% rate — not tax advice; consult a CPA.
Schools (NCES district)
- District
- Frankston ISD
- NCES district ID
- 4819770
- Math proficiency
- 54% ▼ -1.00%
- Reading proficiency
- 49% ▲ 2.00%
- Median HH income
- $48,226
- Composite
- 43.89/100
- National rank
- #2916
- State rank
- #155 of 826 in TX
Livability — Frankston
- Score
- 62/100
- State rank
- #918
- US rank
- #16383
Category grades
Schools grade is shown separately in the Schools card above.
Census & demographics
- Census place
- Frankston, TX
- Population (ZIP)
- 6,319
Population outlook (Anderson County) Hauer SSP2
- Today (2025)
- 56,663 people
- By 2030
- 57,373 · +1.3%
- By 2040
- 58,960 · +4.1%
- By 2050
- 59,073 · +4.3%
- By 2075
- 53,737 · -5.2%
- By 2100
- 42,516 · -25.0%
Race, ethnicity, and origin ACS 2023
- Neighborhood character
- Predominantly White (79%)
- Race & ethnicity
- White 79% Two or more races 10% Hispanic / Latino 8% Black 5%
- Hispanic origin (detail)
- Mexican 7%
- Common ancestry
- Lithuanian 3% Iranian 2% Slovak 1%
- Foreign-born
- 3% · Canada
- Languages at home
- 94% English-only · Spanish 6%
Political lean MEDSL · Anderson
- 2024 margin
- Solid R (+61.8) · D 18.8% · R 80.6%
- 2008→2024 swing
- -18.3pp toward R · 2008: -43.5pp · 2024: -61.8pp
- All cycles
- 2024: R+61.8 2020: R+58.0 2016: R+58.1 2012: R+52.2 2008: R+43.5
Not yet ingested
- Civics
- —
Market trends
- HPI YoY
- ▲ 53.53%
- Current HPI
- 295.14
- Rent YoY
- —
- Metro
- —
- State GDP YoY
- ▲ 3.95%
- F500 in state
- 110
Industry mix (Fortune 500 HQ in TX)
| Industry | F500 HQs | Revenue |
|---|---|---|
| Energy | 16 | $1,198B |
|
||
| Technology | 5 | $198B |
|
||
| Engineering / Construction | 4 | $72B |
|
||
| Energy Services | 3 | $60B |
|
||
| Utilities | 3 | $41B |
|
||
| Healthcare | 2 | $330B |
|
||
Price history
-8.0% since first listed5 events — show timeline
- 2026-05-29 Listing Removed — NTREIS
- 2026-05-12 Price Changed $115,000 NTREIS
- 2026-04-28 Listed $125,000 NTREIS
- 2013-07-17 Sold (Public Records) — Public Records
- 2004-01-26 Sold (Public Records) — Public Records
Property tax history
+4.1%/yrLatest (2025): $4,399 · +5.0% YoY. Source: county tax records.
Cash-flow waterfall
monthlySold comps — $/sqft
last 12 mo · ≤1 miLoading sold comps…