 🏷️ Likely Rental
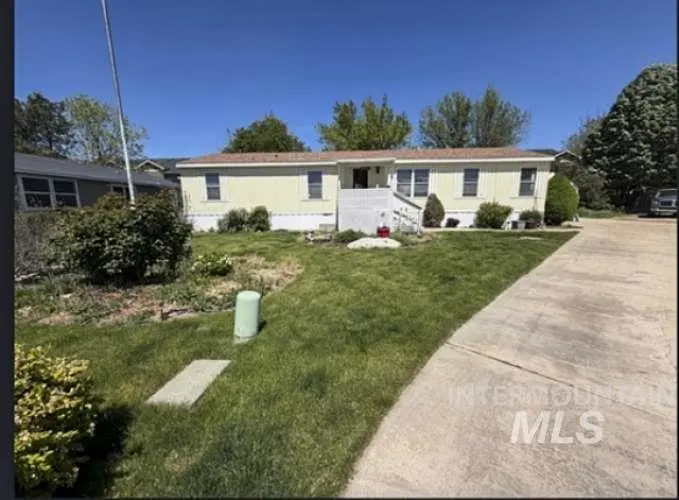
11228 W Azure Ln · Boise City, ID
Flood risk No data
- FEMA flood zone
- —
- Chance of flooding over 30 yrs
- —
- Est. flood insurance / yr
- —
Fire risk No data
- Est. fire insurance / yr
- —
Heat risk No data
- Hot days now (above threshold)
- —
- Hot days in 30 yrs
- —
Wind risk No data
- Chance of severe wind over 30 yrs
- —
Air-quality risk No data
- Unhealthy air days now
- —
- Unhealthy air days in 30 yrs
- —
Risk factors via First Street. Map © Google.
Why this score? — see what drove the B grade
The composite is a weighted blend of 9 inputs, each scored 0–100. Each bar is that input's sub-score; the figure is the points it added to the 100-point composite (weight × sub-score).
- Cash flow +30.0/30.0
- 1% rule +10.0/10.0
- DSCR +10.0/10.0
- ARV discount +7.5/15.0
- Schools +5.2/10.0
- Rent growth +3.5/5.0
- Livability +2.5/5.0
- Condition / age +2.2/5.0
- Appreciation +0.0/10.0
$59,900
🖨 Deal sheet 📄 Offer letter ✓ Due diligence
Listing remarks
Well-maintained double-wide manufactured home offering approximately 1,440 sq ft, built in 2000 . Features a functional split-bedroom layout, new furnace, and new central HVAC system, with a roof approximately 7–8 years old. Located on a desirable corner lot with a covered patio and driveway for up to two vehicles. Lot rent is $895/month. Property is vacant and ready for showings. Conveniently located near shopping, dining, and major roadways. Needs TLC.
Key facts
- New furnace
- Covered patio
- Corner lot
Tags
Property features AI
Finance
- Other: Located in Boise W-Garden City area
- Financial info: Annual taxes listed as $346
- HOA & community: Located in the Rustic Acres subdivision
Exterior
- Parking: Covered carport with 2 spaces
- Home design: Mobile/manufactured home on a rented lot; Single-story (main level entry)
- Construction: Built in 2000; Frame construction; Crawl space foundation
- Exterior features: Paved road access
Interior
- Kitchen: Kitchen on main level (approx. 10 x 12)
- Bedrooms: 3 bedrooms, all on the main level (Primary bedroom approx. 12 x 14; Bedroom 2 approx. 10 x 11; Bedroom 3 approx. 9 x 10)
- Bathrooms: 3 bathrooms
- Heating & cooling: No heating; No cooling
- Interior features: Living room on main level
Neighborhood map
What this means for you Summary
Snapshot
- This is a 3-bed/3.0-bath single-family listed at $60k. Condition is rated fair.
Deal economics
- At list price, monthly cash flow is $1k ($12k/yr) — positive.
- The deal already cash-flows at list — no discount required.
- Meets the 1% rule at list price ($2k rent vs $60k).
- Recommended offer: $59k (1.5% below list) — sets the bar for market timing.
- Cap rate 26.7% vs local median 2.6% in Boise City — top-decile yield for the area; either an underpriced asset or a hidden risk that comps aren't pricing in. Stress-test before assuming the spread holds.
Location & tenants
- Location reads: area grade B — affects rentability + tenant quality, not the cash-flow math above.
- Joint School District No. 2 (suburban): math 53% / reading 67% proficiency, ranked #11 of 92 in ID (top 12%) — acceptable for families but not a draw, mixed tenant base, ~2y average lease.
- Zoned schools: Ustick Elementary School (math 32% / reading 37%, grade F, #272 of 357 statewide, top 80%, 357 students, 60% FRL); Centennial High School (math 53% / reading 76%, grade B-, #10 of 169 statewide, top 7%, 1,931 students, 22% FRL) — zoned schools average 41% FRL vs 23% district-wide (18 pts higher); higher-poverty schools than district average — tighter screening recommended.
- Market conditions: Rents rising fast (+4.0%/yr); 135 active listings in the ZIP; 10 comparable units currently listed for rent nearby; rentals at typical pace (median 15d on market — plan ~3-4 weeks tenant-placement turnaround); solid renter incomes; 5,129 units permitted in Ada County in 2024 (414 in 5+ unit buildings).
Forward outlook
- Local home prices are declining (-3.0%/yr); year-one equity from $414 of loan paydown is wiped out by about $2k of value loss. Plan a longer hold.
- Ada County population projected at +45% by 2050 — long-run rental-demand tailwind backs the buy-and-hold thesis.
- At projected returns (-3.0% appreciation + 4.0% rent growth), your $17k cash investment doubles in ~2 years — after that, you're playing with house money.
Negotiation context
- It's been on market 24 days — a 2% lower offer ($59k) is reasonable based on typical stale-listing flexibility.
Questions for the listing agent
- Have any recent inspections been done? Can we get a copy of the seller's disclosures and any deferred-maintenance estimates?
- Is there a deadline driving the sale (1031 exchange, divorce, estate, relocation)? That informs how much negotiation room exists.
- What's the average days-on-market for RENTAL listings here right now (not sales)? A rising rental-DOM trend means longer vacancies and softer asking-rent achievability than the comps imply.
- What's the recent tenant-quality profile in this submarket — average credit score on applications, eviction rate, late-payment / NSF rate, and stable-employment percentage? A property-management company in the area should have these aggregated.
- How much new for-sale + rental construction is in the pipeline within 1–3 miles? Heavy new supply typically softens prices + rents 12–24 months out; constrained supply supports both.
Investment metrics
- 1% rule
- 3.03% ✓
- Cap rate
- 26.75%
- Cash-on-cash
- 73.05%
- DSCR
- 4.25
- GRM
- 2.7
CMA / ARV
- ARV (on-the-fly)
- $481,376
- Comps found
- 12
Show comp detail 12 sales within ~0.75 mi
| Address | Dist | Beds/Ba | Sqft | Sold | Price | $/sf | Match |
|---|---|---|---|---|---|---|---|
| 1118 N Dawn Dr | 0.28mi | 4/2.0 (+1) | 1,584 (+1%) | 2mo | $679,900 | $429 | 74 |
| 11956 W Driftwood Ct | 0.56mi | 3/2.0 | 1,574 (+0%) | 5mo | $475,000 | $302 | 65 |
| 1890 N Bryson Rd | 0.37mi | 4/2.0 (+1) | 1,487 (-5%) | 5mo | $430,000 | $289 | 61 |
| 2145 N Shamrock Ave | 0.50mi | 4/2.0 (+1) | 1,626 (+4%) | 2mo | $484,900 | $298 | 60 |
| 10747 W Irving Ct | 0.33mi | 3/2.0 | 1,357 (-14%) | 0mo | $419,900 | $309 | 58 |
| 10838 W Tidewater Ct | 0.42mi | 4/2.0 (+1) | 1,684 (+7%) | 3mo | $489,000 | $290 | 56 |
| 11716 W W Irving St | 0.30mi | 3/2.0 | 1,332 (-15%) | 2mo | $430,000 | $323 | 55 |
| 12068 W Tidewater Dr | 0.68mi | 3/2.5 | 1,669 (+6%) | 3mo | $439,900 | $264 | 53 |
| 11078 W Tidewater Ct | 0.36mi | 3/2.0 | 1,348 (-14%) | 4mo | $435,654 | $323 | 53 |
| 10411 W Rifleman St | 0.62mi | 3/2.0 | 1,384 (-12%) | 1mo | $424,900 | $307 | 46 |
| 10532 W Greenleaf St | 0.51mi | 3/2.0 | 1,366 (-13%) | 5mo | $449,900 | $329 | 46 |
| 10103 W Irving St | 0.73mi | 3/2.0 | 1,401 (-11%) | 4mo | $409,900 | $293 | 40 |
Match score weights: distance 35% · size 25% · config 20% · recency 20%. Top-matched comps best support the ARV.
Projected returns pro-forma
-3.0% appreciation · 4.01% rent growth · sell at horizon
- IRR
- 73.9%
- Equity multiple
- 4.41×
- Total profit
- $57,215
- Equity at exit
- $8,931
- IRR
- 78.0%
- Equity multiple
- 9.44×
- Total profit
- $141,479
- Equity at exit
- $5,179
Cash invested: $16,772 (down + closing). Projections, not guarantees.
Landlord ↔ Tenant lean methodology
- Overall (STATE)
- 91 Strongly Landlord-Friendly
- State Idaho
- 91 Strongly Landlord-Friendly · R+18
- County
- — inherits STATE
- City
- — inherits STATE
ZIP-level market 83713
- Home prices YoY
- -26.5%
- Rents YoY
- 4.0%
- Active inventory
- 135
- Price-to-rent
- 2.7×
Monthly cashflow live
- Estimated rent
- $1,816 high interval (Pro) →
- Mortgage (P&I)
- −$314
- Tax est. 1.5%
- −$75 /mo · $898/yr
- Insurance
- −$25
- HOA
- −$0
- Vacancy / Maint / Mgmt
- −$381
- Net cashflow
- $1,021
Break-even live
UW: 25.0% down · 7.5% · 30yr · 1.5% tax · 5.0% vac · 8.0% maint · 8.0% mgmt
Financing live
Cash to close
- Down payment
- $14,975
- Closing costs
- $1,797
- Reserves months
- —
- Total cash needed
- —
Loan-product check · same deal, 3 products live
Conventional
25% down · 7.5% · 30yr
- Down + closing
- —
- Monthly P&I
- —
- Monthly cashflow
- —
- DSCR
- —
- Eligible?
- —
Personal DTI + credit; lowest rate.
DSCR
20% down · 8.5% · 30yr
- Down + closing
- —
- Monthly P&I
- —
- Monthly cashflow
- —
- DSCR
- —
- Eligible?
- —
No personal income docs; deal must DSCR.
Hard money
10% down · 12.0% · 12mo
- Down + closing
- —
- Monthly P&I
- —
- Monthly cashflow
- —
- DSCR
- —
- Eligible?
- —
Short-term bridge; refi at stabilization.
Rent comps 10 comps
| Address | Beds | Baths | Sqft | Rent | $/sqft | DOM | Units | Dist |
|---|---|---|---|---|---|---|---|---|
| 11239 W Gabrielle Dr Boise, ID | 2.0 | 2.5 | 1128 | $1,645 | $1.46 | 23d | 1 | 0.04mi |
| 11383 W Fairview Ave Boise, ID | 2.0 | 2.0 | 1123 | $1,575 | $1.40 | 3d | 4 | 0.14mi |
| 10096 W Garverdale Ln Boise, ID | 3.0 | 2.0 | 1113 | $1,600 | $1.44 | 23d | 1 | 0.75mi |
| 9993 W Rosecroft Ct #101 Boise, ID | 2.0 | 2.5 | 1136 | $1,575 | $1.39 | 3d | 1 | 0.78mi |
| 9846 W Rosecroft Ct #102 Boise, ID | 2.0 | 2.5 | 1236 | $1,545 | $1.25 | 3d | 1 | 0.86mi |
| 2663 N Fastwater Ave Boise, ID | 3.0 | 2.0 | 1204 | $1,795 | $1.49 | 14d | 1 | 0.97mi |
| 11274 W Race St Boise, ID | 3.0 | 2.5 | 1744 | $2,150 | $1.23 | 14d | 1 | 0.99mi |
| 3325 N Covered Wagon Way Boise, ID | 3.0 | 2.0 | 1200 | $2,050 | $1.71 | 23d | 1 | 1.20mi |
| 3848 E Presidential Dr Meridian, ID | 3.0 | 3.0 | 1356 | $2,250 | $1.66 | 14d | 1 | 1.30mi |
| 8973 W Irving St Bldg 6 Boise, ID | 3.0 | 2.5 | 1524 | $2,250 | $1.48 | 14d | 1 | 1.42mi |
Listing history 5 events
-
2026-06-02status $59,900 Pending 24 DOM
-
2026-06-01days on market $59,900 Active 24 DOM
-
2026-05-31days on market $59,900 Active 23 DOM
-
2026-05-12price $69,900
-
2026-05-08$89,900 Active
ⓘ Source: listings_history table (triggers on properties + properties_extension) + one-shot
backfill from property_details.listing_events for pre-trigger history.
Nearby sold comps map
Loading sold comps map…
Walkable amenities ~0.75 mi
Loading nearby amenities…
Taxation est. · year 1
- Rental income
- $21,797
- − Mortgage interest
- −$3,355
- − Property taxes
- −$898
- − Insurance
- −$300
- − Repairs & maintenance
- −$1,744
- − Management
- −$1,744
- − Depreciation
- −$1,743
- Taxable income
- $12,014
- Est. tax owed @ 24.0%
- −$2,883
- After-tax cash flow
- $9,369/yr
For passive investors: Depreciation is non-cash, so a rental often shows a tax loss while cash-flowing — sheltering income. Rental losses are passive: they offset passive income freely, and up to $25,000/yr can offset ordinary (W-2) income if you actively participate and your MAGI is under $100k (phasing out to $0 by $150k); unused losses carry forward. On sale, claimed depreciation is recaptured at up to 25%, and gains may owe capital-gains tax (a 1031 exchange can defer both). Figures are a year-1 estimate at your 24.0% rate — not tax advice; consult a CPA.
Condition & rehab AI · 9 photos
This double-wide manufactured home requires moderate renovations to update the kitchen and bathrooms, and a fresh coat of paint on the exterior. The home is located on a desirable corner lot and is ready for showings.
Repairs flagged
- Moderate kitchen cabinets — dated and in need of replacement
- Moderate bathroom fixtures — dated and in need of replacement
- Minor exterior paint — could use a fresh coat of paint
Value-add opportunities
- Both update kitchen cabinets and appliances — modernizing the kitchen will appeal to both buyers and renters
- Both replace bathroom fixtures — modernizing the bathrooms will appeal to both buyers and renters
- Both paint exterior — a fresh coat of paint will improve curb appeal and home value
Renovation cost estimate screening
| Repair item | Severity | Est. cost |
|---|---|---|
| kitchen cabinets · dated and in need of replacement | Moderate | $3,000–15,000 |
| bathroom fixtures · dated and in need of replacement | Moderate | $3,000–15,000 |
| exterior paint · could use a fresh coat of paint | Minor | $500–3,000 |
| Total estimated repair cost · 3 items | $6,500–33,000 |
Value-add ROI direction
- Both update kitchen cabinets and appliances — modernizing the kitchen will appeal to both buyers and renters ↑
- Both replace bathroom fixtures — modernizing the bathrooms will appeal to both buyers and renters ↑
- Both paint exterior — a fresh coat of paint will improve curb appeal and home value ↑
ⓘ Cost ranges are severity-bucket heuristics (US national rule-of-thumb). Get contractor quotes + a written scope before underwriting a rehab budget.
Schools (NCES district)
- District
- Joint School District No. 2
- NCES district ID
- 1602100
- Math proficiency
- 53% ▼ -6.00%
- Reading proficiency
- 67% ▼ -1.00%
- Median HH income
- $64,573
- Composite
- 52.42/100
- National rank
- #1576
- State rank
- #11 of 92 in ID
Livability — Boise City
No livability data for this city. (Only ~50 U.S. cities are tracked.)
Census & demographics
- Census place
- Boise City, ID
- County
- Ada County · 522,161 people
- City population
- 152,689
- Metro
- Boise City, ID
- Population (ZIP)
- 31,549
- Household income
- $91,295
- Rent vs Own
- Severe rent burden
- 805.0
Population outlook (Ada County) Hauer SSP2
- Today (2025)
- 535,818 people
- By 2030
- 585,751 · +9.3%
- By 2040
- 682,435 · +27.4%
- By 2050
- 775,818 · +44.8%
- By 2075
- 994,458 · +85.6%
- By 2100
- 1,148,884 · +114.4%
Race, ethnicity, and origin ACS 2023
- Neighborhood character
- Predominantly White (79%)
- Race & ethnicity
- White 79% Two or more races 10% Hispanic / Latino 10% Asian 3% Black 1%
- Hispanic origin (detail)
- Mexican 8%
- Common ancestry
- Portuguese 4% Slovak 2% Lithuanian 2%
- Foreign-born
- 9% · Canada, Jamaica, China
- Languages at home
- 87% English-only · Spanish 7% Other Indo-European 2% German/W. Germanic 1%
Political lean MEDSL · Ada
- 2024 margin
- R (+10.3) · D 43.4% · R 53.8% · Other 2.8%
- 2008→2024 swing
- -4.2pp toward R · 2008: -6.2pp · 2024: -10.3pp
- All cycles
- 2024: R+10.3 2020: R+3.9 2016: R+9.2 2012: R+11.3 2008: R+6.2
Not yet ingested
- Civics
- —
Market trends
- HPI YoY
- ▼ -122.31%
- Current HPI
- 338.9271
- Rent YoY
- ▲ 4.01%
- Metro
- Boise City, ID
- State GDP YoY
- ▲ 4.51%
- F500 in state
- 6
Industry mix (Fortune 500 HQ in ID)
| Industry | F500 HQs | Revenue |
|---|---|---|
| Retail | 1 | $79B |
|
||
| Technology | 1 | $25B |
|
||
| Food / Agriculture | 1 | $6B |
|
||
Price history
-22.2% since first listed2 events — show timeline
- 2026-05-12 Price Changed $69,900 IMLS
- 2026-05-08 Listed $89,900 IMLS
Cash-flow waterfall
monthlySold comps — $/sqft
last 12 mo · ≤1 miLoading sold comps…