 27-Plex
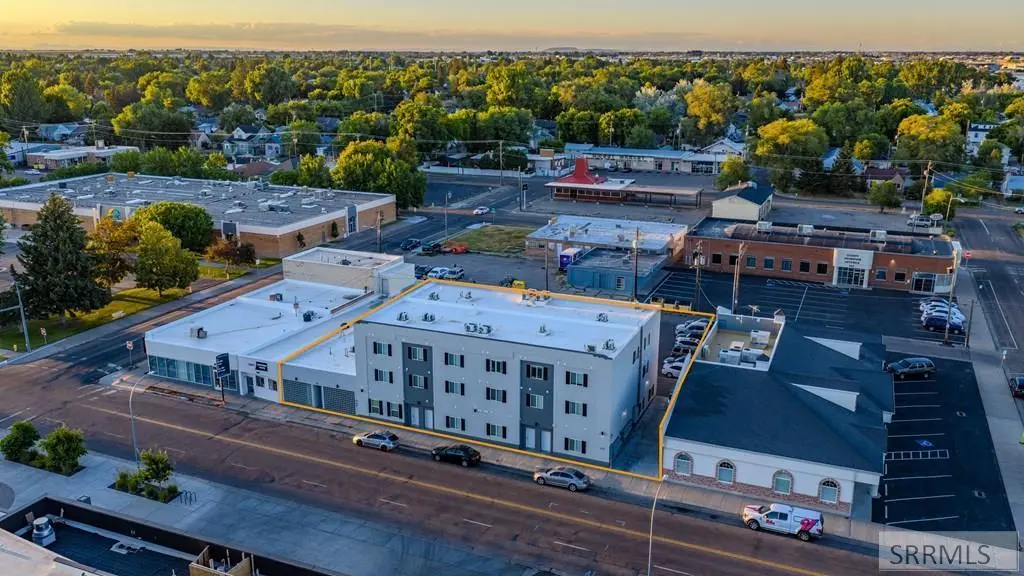
350 E E St · Idaho Falls, ID
Flood risk No data
- FEMA flood zone
- —
- Chance of flooding over 30 yrs
- —
- Est. flood insurance / yr
- —
Fire risk No data
- Est. fire insurance / yr
- —
Heat risk No data
- Hot days now (above threshold)
- —
- Hot days in 30 yrs
- —
Wind risk No data
- Chance of severe wind over 30 yrs
- —
Air-quality risk No data
- Unhealthy air days now
- —
- Unhealthy air days in 30 yrs
- —
Risk factors via First Street. Map © Google.
Why this score? — see what drove the C+ grade
The composite is a weighted blend of 9 inputs, each scored 0–100. Each bar is that input's sub-score; the figure is the points it added to the 100-point composite (weight × sub-score).
- Cash flow +23.2/30.0
- DSCR +7.5/10.0
- ARV discount +7.5/15.0
- 1% rule +6.1/10.0
- Condition / age +4.8/5.0
- Livability +4.3/5.0
- Schools +3.7/10.0
- Rent growth +3.1/5.0
- Appreciation +0.0/10.0
$4,250,000
🖨 Deal sheet (PDF) 📄 Offer letter ✓ Due diligence
Multi-family units
County records classify this as Multi-Family (5+ Unit). Listing-text estimate: 27 units. confirmed
5+ unit building — per-unit beds/baths from public records are typically unavailable; the breakdown below (if shown) is an estimate from the listing text.
Listing remarks
The Wellington is a fully renovated 27-unit apartment building in downtown Idaho Falls, one block from the Riverwalk, with stylish studios and 1-bedrooms designed for long-term renters, traveling nurses, and remote workers. Renovated in 2022 with 9' ceilings, sound-dampened walls, LED lighting, secured access, and efficient systems, this property offers low-maintenance operations. Every tenant enjoys high-speed fiber internet, free laundry, assigned parking, and individual storage. Strong rental demand and scarce downtown inventory support steady performance, with high-credit tenants in place. Walkable to the Museum of Idaho, dining, farmers market, bars, shops, and the public library. Grea
Key facts
- Fully renovated
- Secured access
- Free laundry
Tags
Property features AI
Finance
- Other: Zoned IDAHO FALLS-CC-CENTRAL COMMER; Lot frontage approximately 127 feet; Lot size approximately 0.41 acres; Subdivision: Railroad Addition-Bon
- Financial info: Annual tax amount reported
Exterior
- Parking: 28 parking spaces; Parking on asphalt, concrete and off-street areas
- Utilities: Public water; Public sewer
- Home design: Residential income property (multi-family, 11+ units)
- Construction: Stucco construction
- Exterior features: Rubber roof
Interior
- Bathrooms: 27 full bathrooms
- Heating & cooling: Heat pump heating
- Interior features: Full, partially finished basement
- Laundry & utility: Common area laundry
Neighborhood map
What this means for you Summary
Snapshot
- This is a 27 × 27-bed/27.0-bath units multifamily listed at $4.25M. Condition is rated excellent.
Deal economics
- At list price, monthly cash flow is $8k ($93k/yr) — positive. Per door: $286/mo.
- The deal already cash-flows at list — no discount required.
- Meets the 1% rule at list price ($47k rent vs $4.25M).
- Recommended offer: $4.00M (6.0% below list) — sets the bar for market timing.
Location & tenants
- Location reads 86/100 on livability (#3 in ID, #428 nationally) — a professional / high-income tenant draw. Strengths: amenities A+, cost of living A+, housing A+.
- Idaho Falls District (urban): math 36% / reading 50% proficiency, ranked #54 of 92 in ID (top 59%) — families likely to look elsewhere, expect single-tenant / working-renter base with shorter leases.
- Zoned schools: A H Bush Elementary School (math 22% / reading 32%, grade F, #318 of 357 statewide, top 92%, 322 students, 74% FRL); Eagle Rock Middle School (math 35% / reading 53%, grade D, #57 of 109 statewide, top 54%, 776 students, 46% FRL); Skyline Senior High School (math 30% / reading 47%, grade F, #98 of 169 statewide, top 58%, 1,321 students, 31% FRL).
- Market conditions: Rents rising (+2.6%/yr); 275 active listings in the ZIP; 2,253 units permitted in Bonneville County in 2024 (1,051 in 5+ unit buildings).
- At $46,966/mo this rent would consume 756% of the median local household income ($75k/yr) (locally 636% of renters already pay >50% of income on rent) — very limited rent-growth headroom before tenants either downsize or default.
Forward outlook
- Local home prices are declining (-3.0%/yr); year-one equity from $29k of loan paydown is wiped out by about $128k of value loss. Plan a longer hold.
- Bonneville County population projected at +18% by 2050 — long-run rental-demand tailwind backs the buy-and-hold thesis.
Negotiation context
- It's been on market 75 days — a 6% lower offer ($4.00M) is reasonable based on typical stale-listing flexibility.
Risks & watch-outs
- Watch-outs: built in 1948 — expect roof / HVAC / electrical / plumbing capex.
Questions for the listing agent
- It's been on market 75 days. Have you received any prior offers? Is the seller open to a 6% concession, seller financing, or rate buy-down credit?
- Can we see the unit-by-unit rent roll, current vacancy, and any below-market leases? What's the average tenancy length?
- What capital expenditures (roof, boiler, parking lot, exteriors) have been made in the last 5 years, and what's planned in the next 2?
- Built in 1948 — when were the roof, HVAC, electrical panel, plumbing, and water heater last replaced?
- Why hasn't it sold? Are there any deal-killer items the seller is aware of (foundation, flood, title, zoning, code violations)?
- Is there a deadline driving the sale (1031 exchange, divorce, estate, relocation)? That informs how much negotiation room exists.
- What's the average days-on-market for RENTAL listings here right now (not sales)? A rising rental-DOM trend means longer vacancies and softer asking-rent achievability than the comps imply.
- What's the recent tenant-quality profile in this submarket — average credit score on applications, eviction rate, late-payment / NSF rate, and stable-employment percentage? A property-management company in the area should have these aggregated.
- How much new apartment / multifamily construction is in the pipeline within 1–3 miles? Heavy new supply (>2% of stock underway) typically softens rents 12–24 months out; light construction supports rent growth.
Investment metrics
- 1% rule
- 1.11% ✓
- Cap rate
- 8.48%
- Cash-on-cash
- 7.80%
- DSCR
- 1.35
- GRM
- 7.5
CMA / ARV
No comps found within radius.
Projected returns pro-forma
-3.0% appreciation · 2.57% rent growth · sell at horizon
- IRR
- -4.9%
- Equity multiple
- 0.82×
- Total profit
- $-215,731
- Equity at exit
- $633,689
- IRR
- 4.3%
- Equity multiple
- 1.31×
- Total profit
- $366,857
- Equity at exit
- $367,462
Cash invested: $1,190,000 (down + closing). Projections, not guarantees.
Landlord ↔ Tenant lean methodology
- Overall (STATE)
- 91 Strongly Landlord-Friendly
- State Idaho
- 91 Strongly Landlord-Friendly · R+18
- County
- — inherits STATE
- City
- — inherits STATE
ZIP-level market 83402
- Rents YoY
- 2.6%
- Active inventory
- 275
- Price-to-rent
- 203.6×
Monthly cashflow live
- Estimated rent
- $46,966 medium interval (Pro) →
- Mortgage (P&I)
- −$22,287
- Tax est. 1.5%
- −$5,312 /mo · $63,750/yr
- Insurance
- −$1,771
- HOA
- −$0
- Vacancy / Maint / Mgmt
- −$9,863
- Net cashflow
- $7,732
Break-even live
Sensitivity live
| Price | -10% $10,669 | -5% $9,201 | +0% $7,732 | +5% $6,264 | +10% $4,795 |
|---|---|---|---|---|---|
| Rent | -10% $4,022 | -5% $5,877 | +0% $7,732 | +5% $9,588 | +10% $11,443 |
| Rate | -1.0pp $9,873 | -0.5pp $8,813 | base $7,732 | +0.5pp $6,631 | +1.0pp $5,511 |
27-unit breakdown (identical units grouped — click to expand)
| Units | Beds | Baths | Est. rent |
|---|---|---|---|
| 27× units | 27 | 27 | $46,953 |
| #1 | 27 | 27 | $1,739 |
| #2 | 27 | 27 | $1,739 |
| #3 | 27 | 27 | $1,739 |
| #4 | 27 | 27 | $1,739 |
| #5 | 27 | 27 | $1,739 |
| #6 | 27 | 27 | $1,739 |
| #7 | 27 | 27 | $1,739 |
| #8 | 27 | 27 | $1,739 |
| #9 | 27 | 27 | $1,739 |
| #10 | 27 | 27 | $1,739 |
| #11 | 27 | 27 | $1,739 |
| #12 | 27 | 27 | $1,739 |
| #13 | 27 | 27 | $1,739 |
| #14 | 27 | 27 | $1,739 |
| #15 | 27 | 27 | $1,739 |
| #16 | 27 | 27 | $1,739 |
| #17 | 27 | 27 | $1,739 |
| #18 | 27 | 27 | $1,739 |
| #19 | 27 | 27 | $1,739 |
| #20 | 27 | 27 | $1,739 |
| #21 | 27 | 27 | $1,739 |
| #22 | 27 | 27 | $1,739 |
| #23 | 27 | 27 | $1,739 |
| #24 | 27 | 27 | $1,739 |
| #25 | 27 | 27 | $1,739 |
| #26 | 27 | 27 | $1,739 |
| #27 | 27 | 27 | $1,739 |
| Total (27 units) | $46,966 | ||
UW: 25.0% down · 7.5% · 30yr · 1.5% tax · 5.0% vac · 8.0% maint · 8.0% mgmt
Financing live
Cash to close
- Down payment
- $1,062,500
- Closing costs
- $127,500
- Reserves months
- —
- Total cash needed
- —
Loan-product check · same deal, 3 products live
Conventional
25% down · 7.5% · 30yr
- Down + closing
- —
- Monthly P&I
- —
- Monthly cashflow
- —
- DSCR
- —
- Eligible?
- —
Personal DTI + credit; lowest rate.
DSCR
20% down · 8.5% · 30yr
- Down + closing
- —
- Monthly P&I
- —
- Monthly cashflow
- —
- DSCR
- —
- Eligible?
- —
No personal income docs; deal must DSCR.
Hard money
10% down · 12.0% · 12mo
- Down + closing
- —
- Monthly P&I
- —
- Monthly cashflow
- —
- DSCR
- —
- Eligible?
- —
Short-term bridge; refi at stabilization.
Listing history 20 events
-
2026-06-21days on market $4,250,000 Active 75 DOM
-
2026-06-19days on market $4,250,000 Active 73 DOM
-
2026-06-18days on market $4,250,000 Active 72 DOM
-
2026-06-17days on market $4,250,000 Active 71 DOM
-
2026-06-16days on market $4,250,000 Active 70 DOM
-
2026-06-15days on market $4,250,000 Active 69 DOM
-
2026-06-14days on market $4,250,000 Active 67 DOM
-
2026-06-13days on market $4,250,000 Active 66 DOM
-
2026-06-10days on market $4,250,000 Active 64 DOM
-
2026-06-09days on market $4,250,000 Active 63 DOM
-
2026-06-08days on market $4,250,000 Active 62 DOM
-
2026-06-07days on market $4,250,000 Active 61 DOM
-
2026-06-05days on market $4,250,000 Active 58 DOM
-
2026-06-03days on market $4,250,000 Active 57 DOM
-
2026-06-02days on market $4,250,000 Active 56 DOM
-
2026-06-01days on market $4,250,000 Active 55 DOM
-
2026-05-31days on market $4,250,000 Active 54 DOM
-
2026-05-30days on market $4,250,000 Active 53 DOM
-
2026-04-28price $4,250,000
-
2026-04-07$4,449,000 Active
ⓘ Source: listings_history table (triggers on properties + properties_extension) + one-shot
backfill from property_details.listing_events for pre-trigger history.
Nearby sold comps map
Loading sold comps map…
Walkable amenities ~0.75 mi
Loading nearby amenities…
Taxation est. · year 1
- Rental income
- $563,592
- − Mortgage interest
- −$238,066
- − Property taxes
- −$63,750
- − Insurance
- −$21,250
- − Repairs & maintenance
- −$45,087
- − Management
- −$45,087
- − Depreciation
- −$123,636
- Taxable income
- $26,715
- Est. tax owed @ 24.0%
- −$6,412
- After-tax cash flow
- $86,377/yr
For passive investors: Depreciation is non-cash, so a rental often shows a tax loss while cash-flowing — sheltering income. Rental losses are passive: they offset passive income freely, and up to $25,000/yr can offset ordinary (W-2) income if you actively participate and your MAGI is under $100k (phasing out to $0 by $150k); unused losses carry forward. On sale, claimed depreciation is recaptured at up to 25%, and gains may owe capital-gains tax (a 1031 exchange can defer both). Figures are a year-1 estimate at your 24.0% rate — not tax advice; consult a CPA.
Condition & rehab AI · 12 photos
This fully renovated 27-unit apartment building in downtown Idaho Falls is move-in ready with modern amenities and excellent condition.
Value-add opportunities
- Both Landscaping improvements — Enhances curb appeal and adds value
- Both Addition of smart home features — Improves tenant experience and marketability
- Both Update to kitchen appliances — Maintains modern aesthetic and functionality
Renovation cost estimate screening
Value-add ROI direction
- Both Landscaping improvements — Enhances curb appeal and adds value ↑
- Both Addition of smart home features — Improves tenant experience and marketability ↑
- Both Update to kitchen appliances — Maintains modern aesthetic and functionality ↑
ⓘ Cost ranges are severity-bucket heuristics (US national rule-of-thumb). Get contractor quotes + a written scope before underwriting a rehab budget.
Schools (NCES district)
- District
- Idaho Falls District
- NCES district ID
- 1601530
- Math proficiency
- 36% ▼ -2.00%
- Reading proficiency
- 50% ▲ 1.00%
- Median HH income
- $48,119
- Composite
- 36.75/100
- National rank
- #4581
- State rank
- #54 of 92 in ID
Livability — Idaho Falls
- Score
- 86/100
- State rank
- #3
- US rank
- #428
Category grades
Schools grade is shown separately in the Schools card above.
Census & demographics
- Census place
- Idaho Falls, ID
- County
- Bonneville County · 125,162 people
- City population
- 105,466
- Metro
- Idaho Falls, ID
- Population (ZIP)
- 29,994
- Household income
- $74,517
- Rent vs Own
- Severe rent burden
- 636.0
Population outlook (Bonneville County) Hauer SSP2
- Today (2025)
- 120,170 people
- By 2030
- 124,993 · +4.0%
- By 2040
- 134,091 · +11.6%
- By 2050
- 142,122 · +18.3%
- By 2075
- 157,767 · +31.3%
- By 2100
- 160,316 · +33.4%
Race, ethnicity, and origin ACS 2023
- Neighborhood character
- Predominantly White (76%)
- Race & ethnicity
- White 76% Hispanic / Latino 19% Two or more races 9%
- Hispanic origin (detail)
- Mexican 17%
- Common ancestry
- Italian 3% Slovak 3% Iranian 2%
- Foreign-born
- 4% · Canada
- Languages at home
- 86% English-only · Spanish 12% Other Indo-European 0%
Political lean MEDSL · Bonneville
- 2024 margin
- Solid R (+45.4) · D 25.6% · R 71.0% · Other 3.4%
- 2008→2024 swing
- -2.4pp toward R · 2008: -43.0pp · 2024: -45.4pp
- All cycles
- 2024: R+45.4 2020: R+43.6 2016: R+40.2 2012: R+51.8 2008: R+43.0
Not yet ingested
- Civics
- —
Market trends
- HPI YoY
- ▼ -201.66%
- Current HPI
- 355.2953
- Rent YoY
- ▲ 2.57%
- Metro
- Idaho Falls, ID
- State GDP YoY
- ▲ 4.51%
- F500 in state
- 6
Industry mix (Fortune 500 HQ in ID)
| Industry | F500 HQs | Revenue |
|---|---|---|
| Retail | 1 | $79B |
|
||
| Technology | 1 | $25B |
|
||
| Food / Agriculture | 1 | $6B |
|
||
Price history
-4.5% since first listed2 events — show timeline
- 2026-04-28 Price Changed $4,250,000 SRMLS
- 2026-04-07 Listed $4,449,000 SRMLS
Cash-flow waterfall
monthlySold comps — $/sqft
last 12 mo · ≤1 miLoading sold comps…