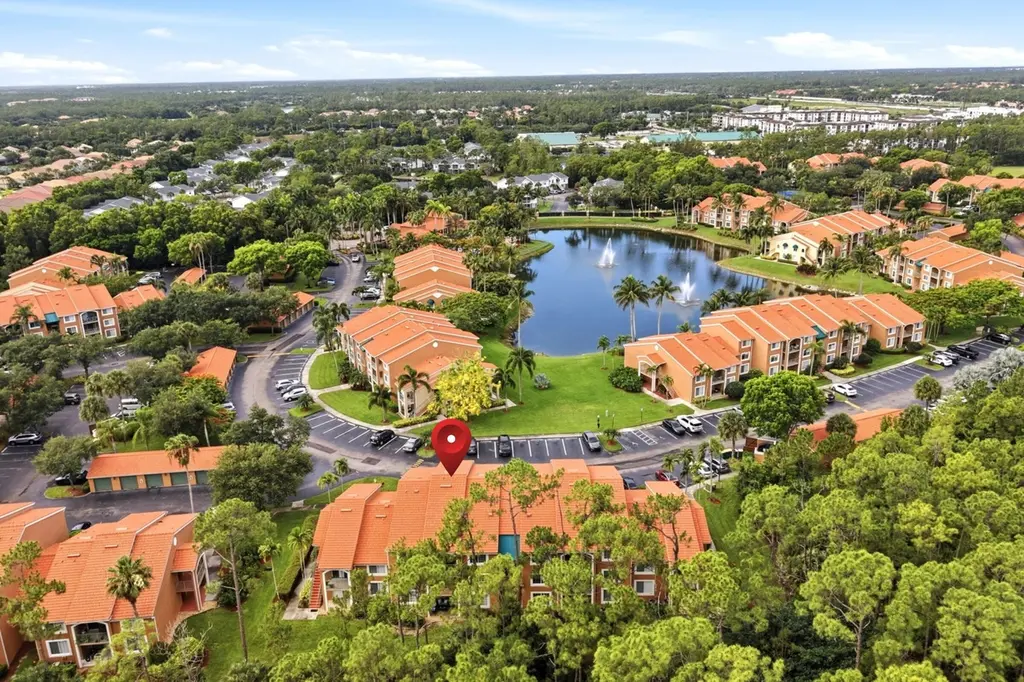
1240 Wildwood Lakes Blvd #105 · Berkshire Lakes, FL
Flood risk 3/10 · Minor
- FEMA flood zone
- X (unshaded)
- Chance of flooding over 30 yrs
- 0.13%
- Est. flood insurance / yr
- $507 – $1,088
Fire risk 3/10 · Minor
- Est. fire insurance / yr
- $947 – $1,759
Heat risk 10/10 · Severe
- Hot days now (above 107°F)
- 7 days/yr
- Hot days in 30 yrs
- 29 days/yr
Wind risk 10/10 · Severe
- Chance of severe wind over 30 yrs
- 99.0%
Air-quality risk 2/10 · Minimal
- Unhealthy air days now
- 2 days/yr
- Unhealthy air days in 30 yrs
- 2 days/yr
Risk factors via First Street. Map © Google.
Why this score? — see what drove the D- grade
The composite is a weighted blend of 9 inputs, each scored 0–100. Each bar is that input's sub-score; the figure is the points it added to the 100-point composite (weight × sub-score).
- Cash flow +11.1/30.0
- ARV discount +7.5/15.0
- 1% rule +5.4/10.0
- Schools +5.0/10.0
- DSCR +3.2/10.0
- Livability +2.5/5.0
- Condition / age +2.5/5.0
- Rent growth +2.2/5.0
- Appreciation +0.0/10.0
$225,000
🖨 Deal sheet 📄 Offer letter ✓ Due diligence
Listing remarks MLS
Welcome to The Enclave at Naples, where resort-style living, convenience, and an exceptional location come together to create the ideal Southwest Florida lifestyle. This beautifully maintained 1,042-square-foot, two-bedroom, two-bath residence offers the perfect opportunity for a full-time home, seasonal retreat, or investment property, placing you just minutes from Naples' renowned white-sand beaches, downtown Naples, 5th Avenue South, Marco Island, Tin City, world-class shopping, dining, golf, and convenient access to I-75. Inside, you'll find an inviting open-concept floor plan with a desirable split-bedroom design that offers privacy and flexibility for owners and guests alike. Features include updated flooring, renovated kitchen and baths, quartz countertops, stainless steel appliances, and in-unit laundry. For added peace of mind, the seller is providing a one-year American Home Shield ShieldPlus® home warranty. The Enclave is a gated, pet-friendly community that underwent extensive renovations approximately seven years ago, including Mediterranean-style tile roofs, refreshed exterior paint, enhanced landscaping, and updated pool and spa areas. Residents enjoy an impressive collection of amenities, including a heated pool and spa, fitness center, clubhouse, billiards room, racquetball court, tennis and pickleball courts, BBQ and picnic areas, tiki hut, dog park, and scenic walking and biking paths surrounded by lush tropical preserves. Plenty of parking for residents and their guests. Adding to its appeal, the community allows up to 12 rentals per year with a 30-day minimum, offering excellent flexibility for owners and attractive investment potential. With low quarterly condo fees, resort-style amenities, and an unbeatable location close to Naples' beaches, dining, shopping, entertainment, and outdoor recreation, The Enclave offers the perfect balance of accessibility and tranquility--tucked within a private, amenity-rich community designed for relaxation, recreation, and year-round enjoyment.
Key facts
- Gated community
- Quartz countertops
- Renovated baths
Tags
Property features AI
Finance
- HOA & community: Mandatory HOA; Quarterly condo fee; On-site management; HOA covers insurance; irrigation water; lawn/land maintenance; legal/accounting; manager; exterior pest control; recreation facilities; reserve; security; sewer; street lights; street maintenance; trash removal; water; Community amenities include clubhouse, community pool and spa/hot tub, exercise room, billiards, BBQ/picnic area, dog park, pickleball, racquetball, tennis courts, and streetlights; Gated community with tennis; Total annual recurring HOA fees listed
Exterior
- Parking: Common parking
- Security: Gated community; Entry card and keypad access
- Utilities: Central water; Central sewer; Cable available
- Home design: Residential garden apartment in a low-rise building (1–3 stories); Built in 2000; Rear exposure faces south; Located in The Enclave at Naples (subdivision/unit 105)
- Construction: Concrete block construction
- Exterior features: Stucco exterior; Sliding windows; Tile roof; Zero lot line; Reclaimed irrigation; View of parking lot; Paved road access
Interior
- Kitchen: Dishwasher; Disposal; Microwave; Range; Refrigerator/ice maker
- Bedrooms: 2 bedrooms with a split-bedroom layout
- Flooring: Carpet; Tile
- Bathrooms: 2 full bathrooms; Master bath with combined tub and shower
- Heating & cooling: Central electric heat; Central electric air conditioning; Ceiling fans
- Interior features: Fire sprinkler system; Pantry; Smoke detectors; Window coverings; Dining area in living room; Open porch/lanai; 3 ceiling fans; 6 total rooms
- Laundry & utility: Washer and dryer in residence; Laundry in residence
Neighborhood map
What this means for you Summary
Snapshot
- This is a 2-bed/2.0-bath condo listed at $225k.
Deal economics
- At list price, monthly cash flow is $-92 ($-1k/yr) — negative.
- To cash-flow at today's rent, offer at most $209k (7.2% below list).
- Meets the 1% rule at list price ($2k rent vs $225k).
- Recommended offer: $209k (7.2% below list) — sets the bar for cash-flow.
Location & tenants
- Location reads: area grade D — affects rentability + tenant quality, not the cash-flow math above.
- Collier (suburban): math 60% / reading 56% proficiency, ranked #16 of 73 in FL (top 22%) — acceptable for families but not a draw, mixed tenant base, ~2y average lease.
- Zoned schools: Calusa Park Elementary School (math 59% / reading 56%, grade C+, #764 of 2,144 statewide, top 36%, 707 students, 62% FRL); Golden Gate High School (math 38% / reading 39%, grade F, #321 of 667 statewide, top 49%, 1,764 students, 53% FRL) — zoned schools at 57% FRL track the district average.
- Market conditions: Rents soft (-1.1%/yr); 436 active listings in the ZIP; 40 comparable units currently listed for rent nearby; rentals at typical pace (median 24d on market — plan ~3-4 weeks tenant-placement turnaround); 3,520 units permitted in Collier County in 2024 (959 in 5+ unit buildings).
- This rent runs 39% of the median local income ($72k/yr) — at the standard rent-burdened threshold; future hikes will face affordability resistance.
Forward outlook
- Local home prices are declining (-3.0%/yr); year-one equity from $2k of loan paydown is wiped out by about $7k of value loss. Plan a longer hold.
- Collier County population projected at +30% by 2050 — long-run rental-demand tailwind backs the buy-and-hold thesis.
Negotiation context
- Only 3 days on market — expect competitive offers; lowballing is unlikely to land.
- 3 sale attempts since 5y ago with the ask held roughly flat each time — persistent listings suggest the price (not the market) is what's stuck; bring a comps-based counter.
- Current owner paid $190k; 18% above their basis — modest negotiation headroom, anchor on the comps not their cost.
Risks & watch-outs
- Climate carrying-cost: severe wind risk, 99% chance of damaging wind over 30y; extreme-heat days projected 7→29/yr by 2055 (HVAC capex compounding) — expect insurance premiums to compound above CPI over the hold.
Questions for the listing agent
- What do current leases actually rent for vs. the listed asking? Can we see a recent rent roll and the last 12 months of T-12 income?
- What does the HOA fee cover, when was the last increase, and are there any pending special assessments or reserve-fund shortfalls?
- Any open or pending special assessments — roof, HVAC, plumbing, elevator, façade? What's the per-unit balance and payoff schedule, and is the seller paying it off at close or rolling it to the buyer?
- Is there a deadline driving the sale (1031 exchange, divorce, estate, relocation)? That informs how much negotiation room exists.
- The area grade is low — what's the realistic commute time and amenity access for the typical tenant pool here? Any planned neighborhood developments (good or bad) we should know about?
- What's the average days-on-market for RENTAL listings here right now (not sales)? A rising rental-DOM trend means longer vacancies and softer asking-rent achievability than the comps imply.
- What's the recent tenant-quality profile in this submarket — average credit score on applications, eviction rate, late-payment / NSF rate, and stable-employment percentage? A property-management company in the area should have these aggregated.
- How much new apartment / multifamily construction is in the pipeline within 1–3 miles? Heavy new supply (>2% of stock underway) typically softens rents 12–24 months out; light construction supports rent growth.
Investment metrics
- 1% rule
- 1.04% ✓
- Cap rate
- 5.80%
- Cash-on-cash
- -1.75%
- DSCR
- 0.92
- GRM
- 8.0
CMA / ARV
No comps found within radius.
Projected returns pro-forma
-3.0% appreciation · 0.0% rent growth · sell at horizon
- IRR
- -23.4%
- Equity multiple
- 0.22×
- Total profit
- $-48,880
- Equity at exit
- $33,548
- IRR
- -33.5%
- Equity multiple
- -0.20×
- Total profit
- $-75,442
- Equity at exit
- $19,454
Cash invested: $63,000 (down + closing). Projections, not guarantees.
Landlord ↔ Tenant lean methodology
- Overall (STATE)
- 87 Strongly Landlord-Friendly
- State Florida
- 87 Strongly Landlord-Friendly · R+3
- County
- — inherits STATE
- City
- — inherits STATE
ZIP-level market 34104
- Rents YoY
- -1.1%
- Active inventory
- 436
- Price-to-rent
- 8.0×
Monthly cashflow live
- Estimated rent
- $2,335 high interval (Pro) →
- Mortgage (P&I)
- −$1,180
- Tax from tax record
- −$197 /mo · $2,362/yr
- Insurance
- −$94
- HOA
- −$466
- Vacancy / Maint / Mgmt
- −$490
- Net cashflow
- $-92
Break-even live
UW: 25.0% down · 7.5% · 30yr · 1.5% tax · 5.0% vac · 8.0% maint · 8.0% mgmt
Financing live
Cash to close
- Down payment
- $56,250
- Closing costs
- $6,750
- Reserves months
- —
- Total cash needed
- —
Loan-product check · same deal, 3 products live
Conventional
25% down · 7.5% · 30yr
- Down + closing
- —
- Monthly P&I
- —
- Monthly cashflow
- —
- DSCR
- —
- Eligible?
- —
Personal DTI + credit; lowest rate.
DSCR
20% down · 8.5% · 30yr
- Down + closing
- —
- Monthly P&I
- —
- Monthly cashflow
- —
- DSCR
- —
- Eligible?
- —
No personal income docs; deal must DSCR.
Hard money
10% down · 12.0% · 12mo
- Down + closing
- —
- Monthly P&I
- —
- Monthly cashflow
- —
- DSCR
- —
- Eligible?
- —
Short-term bridge; refi at stabilization.
Rent comps 40 comps
| Address | Beds | Baths | Sqft | Rent | $/sqft | DOM | Units | Dist |
|---|---|---|---|---|---|---|---|---|
| 1240 Wildwood Lakes Blvd Naples, FL | 2.0 | 2.0 | 1042 | $1,875 | $1.80 | 23d | 2 | 0.01mi |
| 1265 Wildwood Lakes Blvd Unit 3-303 Naples, FL | 2.0 | 2.0 | 1042 | $2,195 | $2.11 | 23d | 1 | 0.05mi |
| 1265 Wildwood Lakes Blvd Unit 3-103 Naples, FL | 2.0 | 2.0 | 1042 | $3,600 | $3.45 | 23d | 1 | 0.05mi |
| 1265 Wildwood Lakes Blvd #106 Naples, FL | 2.0 | 2.0 | 1042 | $1,900 | $1.82 | 14d | 1 | 0.05mi |
| 1235 Wildwood Lakes Blvd Unit 4-104 Naples, FL | 3.0 | 2.0 | 1219 | $3,060 | $2.51 | 23d | 1 | 0.05mi |
| 1235 Wildwood Lakes Blvd #104 Naples, FL | 3.0 | 2.0 | 1219 | $3,200 | $2.63 | 14d | 1 | 0.05mi |
| 1185 Wildwood Lakes Blvd Apt 203 Naples, FL | 2.0 | 2.0 | 1040 | $2,200 | $2.12 | 23d | 1 | 0.07mi |
| 1180 Wildwood Lakes Blvd Naples, FL | 2.0 | 1.0–2.0 | 975 | $1,800 | $1.85 | 23d | 3 | 0.08mi |
| 1180 Wildwood Lakes Blvd Naples, FL | 2.0 | 1.0–2.0 | 975 | $1,850 | $1.90 | 21d | 2 | 0.08mi |
| 1260 Wildwood Lakes Blvd Naples, FL | 1.0–2.0 | 1.0–2.0 | 856 | $2,620 | $3.06 | 14d | 4 | 0.09mi |
| 1270 Wildwood Lakes Blvd #202 Naples, FL | 2.0 | 1.0 | 909 | $1,900 | $2.09 | 23d | 1 | 0.09mi |
| 1270 Wildwood Lakes Blvd #202 Naples, FL | 2.0 | 1.0 | 909 | $1,909 | $2.10 | 14d | 1 | 0.09mi |
| 1220 Wildwood Lakes Blvd #201 Naples, FL | 3.0 | 2.0 | 1219 | $6,000 | $4.92 | 14d | 1 | 0.10mi |
| 1280 Wildwood Lakes Blvd Naples, FL | 1.0–2.0 | 1.0–2.0 | 861 | $2,700 | $3.14 | 23d | 2 | 0.11mi |
| 1210 Wildwood Lakes Blvd #206 Naples, FL | 3.0 | 2.0 | 1219 | $2,150 | $1.76 | 21d | 1 | 0.14mi |
| 1190 Wildwood Lakes Blvd #306 Naples, FL | 2.0 | 2.0 | 1042 | $2,900 | $2.78 | 21d | 1 | 0.17mi |
| 1160 Wildwood Lakes Blvd #304 Naples, FL | 2.0 | 2.0 | 1042 | $3,100 | $2.98 | 14d | 1 | 0.22mi |
| 1170 Wildwood Lakes Blvd #305 Naples, FL | 2.0 | 2.0 | 1042 | $1,900 | $1.82 | 23d | 1 | 0.23mi |
| 1160 Wildwood Lakes Blvd Naples, FL | 2.0 | 2.0 | 1040 | $2,200 | $2.12 | 23d | 1 | 0.24mi |
| 1160 Wildwood Lakes Blvd Unit 9-206 Naples, FL | 2.0 | 2.0 | 1042 | $2,500 | $2.40 | 23d | 1 | 0.24mi |
| 180 Furse Lakes Cir Unit E8 Naples, FL | 2.0 | 2.0 | 1425 | $4,000 | $2.81 | 14d | 1 | 0.29mi |
| 4640 Santa Barbara Blvd Naples, FL | 2.0–3.0 | 2.0 | 1164 | $1,932 | $1.66 | 23d | 2 | 0.36mi |
| 194 Santa Clara Dr Unit 194-3 Naples, FL | 1.0 | 1.0 | 833 | $1,600 | $1.92 | 23d | 1 | 0.37mi |
| 190 Santa Clara Dr Unit 190-4 Naples, FL | 2.0 | 2.0 | 1004 | $1,800 | $1.79 | 23d | 1 | 0.38mi |
| 1440 Wildwood Lakes Blvd Unit D102 Naples, FL | 2.0 | 2.0 | 936 | $1,795 | $1.92 | 23d | 1 | 0.39mi |
| 169 Santa Clara Dr #11 Naples, FL | 2.0 | 2.0 | 1200 | $1,890 | $1.57 | 23d | 1 | 0.42mi |
| 7557 Campania Way Naples, FL | 1.0–3.0 | 1.0–2.0 | 1145 | $2,282 | $1.99 | 14d | 26 | 0.46mi |
| 161 Santa Clara Dr #14 Naples, FL | 2.0 | 2.0 | 1043 | $2,000 | $1.92 | 21d | 1 | 0.46mi |
| 4710 Altis Dr Naples, FL | 1.0–3.0 | 1.0–2.0 | 1101 | $2,430 | $2.21 | 13d | 39 | 0.47mi |
| 7360 Saint Ives Way #2205 Naples, FL | 2.0 | 2.0 | 1053 | $1,925 | $1.83 | 23d | 1 | 0.50mi |
| 150 Santa Clara Dr #15 Naples, FL | 1.0 | 1.0 | 700 | $1,590 | $2.27 | 23d | 1 | 0.53mi |
| 7725 Tara Cir Naples, FL | 1.0–3.0 | 1.0–2.0 | 929 | $1,512 | $1.63 | 14d | 1 | 0.53mi |
| 7380 Saint Ives Way Naples, FL | 2.0 | 2.0 | 1026 | $4,400 | $4.29 | 23d | 2 | 0.54mi |
| 108 Santa Clara Dr #4 Naples, FL | 2.0 | 2.0 | 974 | $1,950 | $2.00 | 14d | 1 | 0.59mi |
| 116 Santa Clara Dr #12 Naples, FL | 1.0 | 1.0 | 745 | $1,600 | $2.15 | 14d | 1 | 0.62mi |
| 120 Asaf Dr Unit 4304 Naples, FL | 2.0 | 2.0 | 1350 | $4,300 | $3.19 | 14d | 1 | 0.71mi |
| 8285 Ibis Club Dr #805 Naples, FL | 3.0 | 2.0 | 1175 | $2,450 | $2.09 | 23d | 1 | 0.71mi |
| 7320 Glenmoor Ln Unit 2206 Naples, FL | 2.0 | 2.0 | 1053 | $6,000 | $5.70 | 14d | 1 | 0.71mi |
| 153 Gabriel Cir Unit 3003 Naples, FL | 2.0 | 2.0 | 1200 | $4,000 | $3.33 | 14d | 1 | 0.75mi |
| 8255 Ibis Club Dr Naples, FL | 2.0 | 2.0 | 1021 | $1,750 | $1.71 | 14d | 2 | 0.76mi |
HOA detail condo
- Monthly dues
- $466 · $5,592/yr
- Likely covers
- landscapingpoolgymsecurity
- Assessments
- None detected in remarks — confirm with the listing agent.
Listing history 4 events
-
2026-06-09status $225,000 Pending 3 DOM
-
2026-06-08days on market $225,000 Active 3 DOM
-
2026-06-07remarks 699-char remark
-
2026-06-07$225,000 Active 2 DOM
ⓘ Source: listings_history table (triggers on properties + properties_extension) + one-shot
backfill from property_details.listing_events for pre-trigger history.
Tax reassessment forecast FL · Resets to sale price
- Current annual tax
- $2,362 · $197/mo
- Projected year-2 tax
- $2,362 · $197/mo
- Expected delta
- $0/yr ($0/mo · 0.0%)
ⓘ Screening estimate from a state-policy table — verify with the county assessor before closing.
Climate risk First Street
- Flood 3/10 Moderate FEMA zone X (unshaded) · 13% chance over 30 yrs
- Wildfire 3/10 Moderate
- Heat 10/10 Extreme 7 d/yr ≥107°F today · 29 d/yr by 30 yrs out
- Wind 10/10 Extreme 99% chance of damaging wind over 30 yrs
- Air quality 2/10 Low 2 unhealthy d/yr today · 2 by 30 yrs out
Nearby sold comps map
Loading sold comps map…
Walkable amenities ~0.75 mi
Loading nearby amenities…
Taxation est. · year 1
- Rental income
- $28,021
- − Mortgage interest
- −$12,603
- − Property taxes
- −$2,362
- − Insurance
- −$1,125
- − Repairs & maintenance
- −$2,242
- − Management
- −$2,242
- − HOA
- −$5,592
- − Depreciation
- −$6,545
- Taxable loss
- −$4,690
- Est. tax savings @ 24.0%
- +$1,126
- After-tax cash flow
- $24/yr
For passive investors: Depreciation is non-cash, so a rental often shows a tax loss while cash-flowing — sheltering income. Rental losses are passive: they offset passive income freely, and up to $25,000/yr can offset ordinary (W-2) income if you actively participate and your MAGI is under $100k (phasing out to $0 by $150k); unused losses carry forward. On sale, claimed depreciation is recaptured at up to 25%, and gains may owe capital-gains tax (a 1031 exchange can defer both). Figures are a year-1 estimate at your 24.0% rate — not tax advice; consult a CPA.
Schools (NCES district)
- District
- Collier
- NCES district ID
- 1200330
- Math proficiency
- 60% ▼ -4.00%
- Reading proficiency
- 56% ▼ -2.00%
- Median HH income
- $58,275
- Composite
- 50.23/100
- National rank
- #1892
- State rank
- #16 of 73 in FL
Livability — Berkshire Lakes
No livability data for this city. (Only ~50 U.S. cities are tracked.)
Census & demographics
- County
- Collier County · 396,295 people
- Metro
- Naples-Marco Island, FL
- Population (ZIP)
- 26,408
- Household income
- $71,686
- Rent vs Own
- Severe rent burden
- 1423.0
Population outlook (Collier County) Hauer SSP2
- Today (2025)
- 420,858 people
- By 2030
- 450,054 · +6.9%
- By 2040
- 502,232 · +19.3%
- By 2050
- 544,932 · +29.5%
- By 2075
- 627,203 · +49.0%
- By 2100
- 659,015 · +56.6%
Race, ethnicity, and origin ACS 2023
- Neighborhood character
- Majority White (62%)
- Race & ethnicity
- White 62% Hispanic / Latino 30% Two or more races 19% Black 4% Asian 2%
- Hispanic origin (detail)
- Mexican 7% Puerto Rican 3% Cuban 6% Dominican 1%
- Common ancestry
- Lithuanian 6% Romanian 3% Hispanic 2%
- Foreign-born
- 30% · Canada, Jamaica, Dominican Republic
- Languages at home
- 66% English-only · Spanish 24% French/Haitian/Cajun 5% Russian/Polish/Slavic 1%
Political lean MEDSL · Collier
- 2024 margin
- Solid R (+33.1) · D 33.1% · R 66.2%
- 2008→2024 swing
- -10.6pp toward R · 2008: -22.5pp · 2024: -33.1pp
- All cycles
- 2024: R+33.1 2020: R+24.7 2016: R+26.0 2012: R+30.1 2008: R+22.5
Not yet ingested
- Civics
- —
Market trends
- HPI YoY
- ▼ -252.48%
- Current HPI
- 259.3498
- Rent YoY
- ▼ -1.10%
- Metro
- Naples-Marco Island, FL
- State GDP YoY
- ▲ 3.28%
- F500 in state
- 36
Industry mix (Fortune 500 HQ in FL)
| Industry | F500 HQs | Revenue |
|---|---|---|
| Industrial Technology | 2 | $29B |
|
||
| Insurance | 2 | $17B |
|
||
| Retail | 1 | $60B |
|
||
| Technology Distribution | 1 | $58B |
|
||
| Homebuilding | 1 | $35B |
|
||
| Technology Manufacturing | 1 | $35B |
|
||
Price history
+18.5% since first listed5 events — show timeline
- 2026-06-05 Listed $225,000 MIML
- 2026-06-05 Listed $225,000 NAPLESMLS
- 2021-04-22 Sold (MLS) $189,900 NAPLESMLS
- 2021-03-22 Pending — NAPLESMLS
- 2021-03-18 Listed $189,900 NAPLESMLS
Property tax history
+10.4%/yrLatest (2025): $2,362 · +2.7% YoY. Source: county tax records.
Cash-flow waterfall
monthlySold comps — $/sqft
last 12 mo · ≤1 miLoading sold comps…