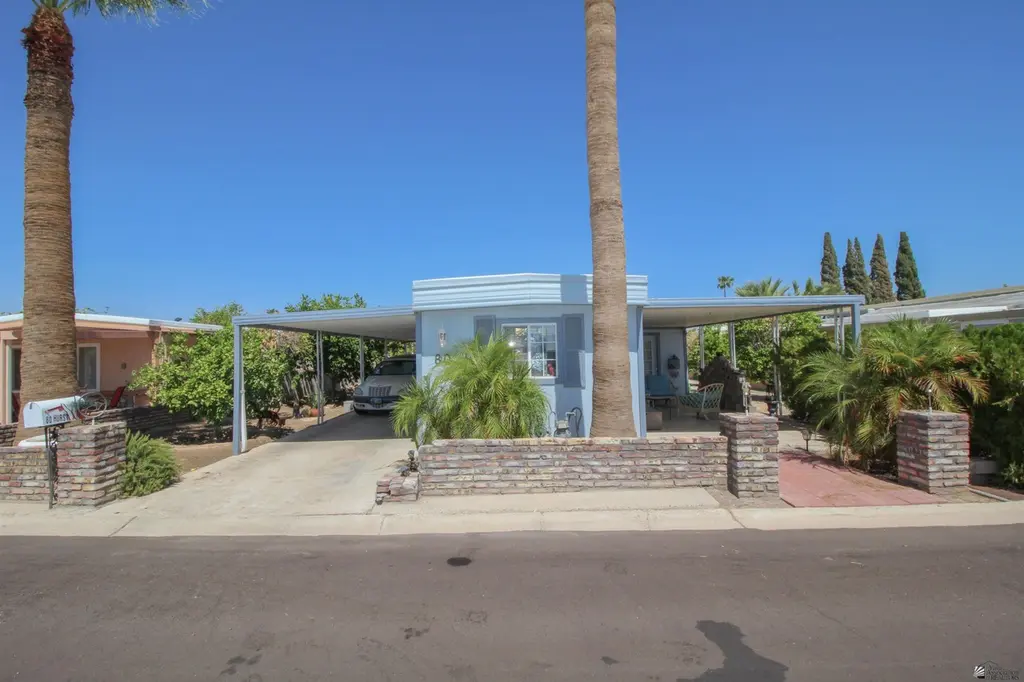
80 W Yellowstone Dr Lot 13 · Yuma, AZ
Flood risk 1/10 · Minimal
- FEMA flood zone
- X (shaded)
- Chance of flooding over 30 yrs
- 0.0%
- Est. flood insurance / yr
- $507 – $1,088
Fire risk 4/10 · Minor
- Est. fire insurance / yr
- $610 – $1,132
Heat risk 9/10 · Severe
- Hot days now (above 113°F)
- 6 days/yr
- Hot days in 30 yrs
- 16 days/yr
Wind risk 1/10 · Minimal
- Chance of severe wind over 30 yrs
- —
Air-quality risk 2/10 · Minimal
- Unhealthy air days now
- 2 days/yr
- Unhealthy air days in 30 yrs
- 2 days/yr
Risk factors via First Street. Map © Google.
Why this score? — see what drove the B grade
The composite is a weighted blend of 9 inputs, each scored 0–100. Each bar is that input's sub-score; the figure is the points it added to the 100-point composite (weight × sub-score).
- Cash flow +30.0/30.0
- ARV discount +13.2/15.0
- 1% rule +10.0/10.0
- DSCR +10.0/10.0
- Condition / age +3.8/5.0
- Livability +3.6/5.0
- Rent growth +2.4/5.0
- Schools +1.3/10.0
- Appreciation +0.0/10.0
$79,500
🖨 Deal sheet 📄 Offer letter ✓ Due diligence
Listing remarks
Palm Desert Beauty! This 3 bedroom 1 bath unit has been expanded to add a large living and extra bedroom! Drive up to see a shaded parking area on the west side of the home. On the opposite side there is a tiled covered patio perfect for enjoying our beautiful winters! Two large sheds give plenty of storage! Walk inside and find an open kitchen with lots of cabinet and counter space. There is lots of light in the added air conditioned living room. The 3 bedrooms give plenty of space for offices or guests. The bathroom has a large soaking tub and shower combo. All of this is cooled by a large A/C unit perfect for the year rounder. Don't miss this property located in the heart of Yuma. Call
Key facts
- Large soaking tub
- Large sheds
- Tiled covered patio
Tags
Property features AI
Finance
- HOA & community: Curbs in community
Exterior
- Parking: Attached carport (1 covered space); 1 total parking space
- Utilities: Public water; Public sewer; Paved road access
- Home design: Manufactured home; Residential property; Located in a senior community
- Construction: Mobile/Manufactured construction
- Exterior features: Covered patio
Interior
- Kitchen: Refrigerator; Microwave; Gas Range
- Flooring: Carpet; Laminate; Other
- Bathrooms: 1 full bathroom
- Heating & cooling: Heating; Cooling
- Interior features: Blinds on windows
- Laundry & utility: Washer; Dryer
Neighborhood map
What this means for you Summary
Snapshot
- This is a 3-bed/1.0-bath manufactured listed at $80k. Condition is rated good.
Deal economics
- At list price, monthly cash flow is $789 ($9k/yr) — positive.
- The deal already cash-flows at list — no discount required.
- Meets the 1% rule at list price ($2k rent vs $80k).
- Recommended offer: $72k (9.0% below list) — sets the bar for market timing.
- Cap rate 18.2% vs local median 3.9% in Yuma — top-decile yield for the area; either an underpriced asset or a hidden risk that comps aren't pricing in. Stress-test before assuming the spread holds.
Location & tenants
- Location reads 71/100 on livability (#30 in AZ) — a middle-class / working-renter tenant base. Strengths: cost of living A+, housing A+, health & safety A+; Watch: schools C-, crime C-, employment D.
- Yuma Union High School District (4507) (urban): math 14% / reading 16% proficiency, ranked #212 of 249 in AZ (top 85%) — low school quality limits family demand, transient renter base, plan for 1-2y turnover.
- Market conditions: Rents soft (-0.4%/yr); 472 active listings in the ZIP; 2 comparable units currently listed for rent nearby; 1,399 units permitted in Yuma County in 2024 (180 in 5+ unit buildings).
Forward outlook
- Local home prices are declining (-3.0%/yr); year-one equity from $550 of loan paydown is wiped out by about $2k of value loss. Plan a longer hold.
- Yuma County population projected at +4% by 2050 — modest demand growth; plan on rents tracking national, not racing it.
- At projected returns (-3.0% appreciation + 0.0% rent growth), your $22k cash investment doubles in ~3 years — after that, you're playing with house money.
Negotiation context
- It's been on market 94 days — a 9% lower offer ($72k) is reasonable based on typical stale-listing flexibility.
Risks & watch-outs
- Climate carrying-cost: extreme-heat days projected 6→16/yr by 2055 (HVAC capex compounding) — expect insurance premiums to compound above CPI over the hold.
Questions for the listing agent
- It's been on market 94 days. Have you received any prior offers? Is the seller open to a 9% concession, seller financing, or rate buy-down credit?
- Built in 1970 — when were the roof, HVAC, electrical panel, plumbing, and water heater last replaced?
- Why hasn't it sold? Are there any deal-killer items the seller is aware of (foundation, flood, title, zoning, code violations)?
- Is there a deadline driving the sale (1031 exchange, divorce, estate, relocation)? That informs how much negotiation room exists.
- What's the average days-on-market for RENTAL listings here right now (not sales)? A rising rental-DOM trend means longer vacancies and softer asking-rent achievability than the comps imply.
- What's the recent tenant-quality profile in this submarket — average credit score on applications, eviction rate, late-payment / NSF rate, and stable-employment percentage? A property-management company in the area should have these aggregated.
- How much new for-sale + rental construction is in the pipeline within 1–3 miles? Heavy new supply typically softens prices + rents 12–24 months out; constrained supply supports both.
Investment metrics
- 1% rule
- 2.13% ✓
- Cap rate
- 18.20%
- Cash-on-cash
- 42.53%
- DSCR
- 2.89
- GRM
- 3.9
CMA / ARV
- ARV (on-the-fly)
- $90,972
- Comps found
- 7
Show comp detail 7 sales within ~0.75 mi
| Address | Dist | Beds/Ba | Sqft | Sold | Price | $/sf | Match |
|---|---|---|---|---|---|---|---|
| 3585 S Rainier Ave | 0.10mi | 2/1.0 (-1) | 680 (-1%) | 6mo | $105,000 | $154 | 84 |
| 3571 S Canyon Ave | 0.19mi | 2/2.0 (-1) | 720 (+5%) | 4mo | $42,850 | $60 | 70 |
| 3637 S Papago Dr | 0.23mi | 2/1.0 (-1) | 744 (+9%) | 2mo | $105,000 | $141 | 68 |
| 528 W Rainbow Ln | 0.19mi | 2/2.0 (-1) | 720 (+5%) | 10mo | $75,500 | $105 | 65 |
| 660 W Princess Ln | 0.26mi | 2/1.5 (-1) | 667 (-2%) | 14mo | $89,000 | $133 | 65 |
| 600 W Rainbow Ln | 0.22mi | 2/2.0 (-1) | 768 (+12%) | 4mo | $94,000 | $122 | 57 |
| 3656 S Century Dr | 0.31mi | 2/2.0 (-1) | 756 (+10%) | 7mo | $105,000 | $139 | 54 |
Match score weights: distance 35% · size 25% · config 20% · recency 20%. Top-matched comps best support the ARV.
Projected returns pro-forma
-3.0% appreciation · 0.0% rent growth · sell at horizon
- IRR
- 35.8%
- Equity multiple
- 2.46×
- Total profit
- $32,425
- Equity at exit
- $11,854
- IRR
- 41.0%
- Equity multiple
- 4.32×
- Total profit
- $73,852
- Equity at exit
- $6,874
Cash invested: $22,260 (down + closing). Projections, not guarantees.
Landlord ↔ Tenant lean methodology
- Overall (STATE)
- 87 Strongly Landlord-Friendly
- State Arizona
- 87 Strongly Landlord-Friendly · R+3
- County
- — inherits STATE
- City
- — inherits STATE
ZIP-level market 85365
- Home prices YoY
- -23.6%
- Rents YoY
- -0.4%
- Active inventory
- 472
- Price-to-rent
- 3.9×
Monthly cashflow live
- Estimated rent
- $1,694 medium interval (Pro) →
- Mortgage (P&I)
- −$417
- Tax est. 1.5%
- −$99 /mo · $1,192/yr
- Insurance
- −$33
- HOA
- −$0
- Vacancy / Maint / Mgmt
- −$356
- Net cashflow
- $789
Break-even live
UW: 25.0% down · 7.5% · 30yr · 1.5% tax · 5.0% vac · 8.0% maint · 8.0% mgmt
Financing live
Cash to close
- Down payment
- $19,875
- Closing costs
- $2,385
- Reserves months
- —
- Total cash needed
- —
Loan-product check · same deal, 3 products live
Conventional
25% down · 7.5% · 30yr
- Down + closing
- —
- Monthly P&I
- —
- Monthly cashflow
- —
- DSCR
- —
- Eligible?
- —
Personal DTI + credit; lowest rate.
DSCR
20% down · 8.5% · 30yr
- Down + closing
- —
- Monthly P&I
- —
- Monthly cashflow
- —
- DSCR
- —
- Eligible?
- —
No personal income docs; deal must DSCR.
Hard money
10% down · 12.0% · 12mo
- Down + closing
- —
- Monthly P&I
- —
- Monthly cashflow
- —
- DSCR
- —
- Eligible?
- —
Short-term bridge; refi at stabilization.
Rent comps 2 comps
| Address | Beds | Baths | Sqft | Rent | $/sqft | DOM | Units | Dist |
|---|---|---|---|---|---|---|---|---|
| 225 W Catalina Dr Yuma, AZ | 1.0–2.0 | 1.0–2.0 | 777 | $1,363 | $1.75 | 13d | 7 | 0.61mi |
| 2714 S Virginia Dr Yuma, AZ | 2.0 | 1.0 | 750 | $925 | $1.23 | 13d | 2 | 0.96mi |
Listing history 22 events
-
2026-06-19days on market $79,500 Active 94 DOM
-
2026-06-18days on market $79,500 Active 93 DOM
-
2026-06-17days on market $79,500 Active 92 DOM
-
2026-06-16days on market $79,500 Active 91 DOM
-
2026-06-15days on market $79,500 Active 90 DOM
-
2026-06-14days on market $79,500 Active 88 DOM
-
2026-06-13days on market $79,500 Active 87 DOM
-
2026-06-10days on market $79,500 Active 85 DOM
-
2026-06-09days on market $79,500 Active 84 DOM
-
2026-06-08days on market $79,500 Active 83 DOM
-
2026-06-07days on market $79,500 Active 82 DOM
-
2026-06-05days on market $79,500 Active 79 DOM
-
2026-06-02days on market $79,500 Active 77 DOM
-
2026-06-01days on market $79,500 Active 76 DOM
-
2026-05-31days on market $79,500 Active 75 DOM
-
2026-05-30days on market $79,500 Active 74 DOM
-
2026-04-30price $79,500
-
2026-03-17$89,500 Active
-
2026-02-11price $89,500
-
2025-11-17price $94,000
-
2025-10-31price $99,000
-
2025-10-23price $109,500
ⓘ Source: listings_history table (triggers on properties + properties_extension) + one-shot
backfill from property_details.listing_events for pre-trigger history.
Climate risk First Street
- Flood 1/10 Low FEMA zone X (shaded) · 0% chance over 30 yrs
- Wildfire 4/10 Moderate
- Heat 9/10 Extreme 6 d/yr ≥113°F today · 16 d/yr by 30 yrs out
- Wind 1/10 Low
- Air quality 2/10 Low 2 unhealthy d/yr today · 2 by 30 yrs out
Nearby sold comps map
Loading sold comps map…
Walkable amenities ~0.75 mi
Loading nearby amenities…
Taxation est. · year 1
- Rental income
- $20,329
- − Mortgage interest
- −$4,453
- − Property taxes
- −$1,192
- − Insurance
- −$398
- − Repairs & maintenance
- −$1,626
- − Management
- −$1,626
- − Depreciation
- −$2,313
- Taxable income
- $8,720
- Est. tax owed @ 24.0%
- −$2,093
- After-tax cash flow
- $7,374/yr
For passive investors: Depreciation is non-cash, so a rental often shows a tax loss while cash-flowing — sheltering income. Rental losses are passive: they offset passive income freely, and up to $25,000/yr can offset ordinary (W-2) income if you actively participate and your MAGI is under $100k (phasing out to $0 by $150k); unused losses carry forward. On sale, claimed depreciation is recaptured at up to 25%, and gains may owe capital-gains tax (a 1031 exchange can defer both). Figures are a year-1 estimate at your 24.0% rate — not tax advice; consult a CPA.
Condition & rehab AI · 12 photos
This well-maintained mobile home offers a good investment opportunity with minimal repairs and updates needed to enhance its value.
Value-add opportunities
- Both Paint exterior siding — Enhances curb appeal and value
- Both Replace ceiling fan — Improves air circulation and aesthetics
- Resale Update kitchen appliances — Modernizes the kitchen and attracts buyers
- Both Install smart home features — Enhances comfort and energy efficiency
Renovation cost estimate screening
Value-add ROI direction
- Both Paint exterior siding — Enhances curb appeal and value ↑
- Both Replace ceiling fan — Improves air circulation and aesthetics ↑
- Resale Update kitchen appliances — Modernizes the kitchen and attracts buyers ↑
- Both Install smart home features — Enhances comfort and energy efficiency ↑
ⓘ Cost ranges are severity-bucket heuristics (US national rule-of-thumb). Get contractor quotes + a written scope before underwriting a rehab budget.
Schools (NCES district)
- District
- Yuma Union High School District (4507)
- NCES district ID
- 0409630
- Math proficiency
- 14% ▼ -12.00%
- Reading proficiency
- 16% ▼ -10.00%
- Median HH income
- $40,512
- Composite
- 12.86/100
- National rank
- #9592
- State rank
- #212 of 249 in AZ
Livability — Yuma
- Score
- 71/100
- State rank
- #30
- US rank
- #6635
Category grades
Schools grade is shown separately in the Schools card above.
Census & demographics
- Census place
- Yuma, AZ
- County
- Yuma County · 149,809 people
- City population
- 149,809
- Metro
- Yuma, AZ
- Population (ZIP)
- 54,775
- Household income
- $70,331
- Rent vs Own
- Severe rent burden
- 766.0
Population outlook (Yuma County) Hauer SSP2
- Today (2025)
- 211,633 people
- By 2030
- 214,114 · +1.2%
- By 2040
- 217,856 · +2.9%
- By 2050
- 220,276 · +4.1%
- By 2075
- 222,359 · +5.1%
- By 2100
- 198,880 · -6.0%
Race, ethnicity, and origin ACS 2023
- Neighborhood character
- Diverse neighborhood (Simpson 0.58)
- Race & ethnicity
- Hispanic / Latino 47% White 44% Two or more races 23% Black 2% Asian 1% Native American 1%
- Hispanic origin (detail)
- Mexican 43%
- Common ancestry
- Lithuanian 2% Italian 1% Romanian 1%
- Foreign-born
- 17% · Canada
- Languages at home
- 62% English-only · Spanish 36% Tagalog/Filipino 1% Other Asian/Pacific 1%
Political lean MEDSL · Yuma
- 2024 margin
- Strong R (+20.4) · D 39.3% · R 59.8%
- 2008→2024 swing
- -6.6pp toward R · 2008: -13.8pp · 2024: -20.4pp
- All cycles
- 2024: R+20.4 2020: R+6.2 2016: R+5.5 2012: R+16.1 2008: R+13.8
Not yet ingested
- Civics
- —
Market trends
- HPI YoY
- ▼ -75.03%
- Current HPI
- 242.8651
- Rent YoY
- ▼ -0.38%
- Metro
- Yuma, AZ
- State GDP YoY
- ▲ 4.54%
- F500 in state
- 20
Industry mix (Fortune 500 HQ in AZ)
| Industry | F500 HQs | Revenue |
|---|---|---|
| Technology | 2 | $13B |
|
||
| Mining / Metals | 1 | $23B |
|
||
| Environmental Services | 1 | $16B |
|
||
| Metals / Steel | 1 | $14B |
|
||
| Technology Distribution | 1 | $9B |
|
||
| Homebuilding | 1 | $8B |
|
||
Price history
-27.4% since first listed6 events — show timeline
- 2026-04-30 Price Changed $79,500 YAR
- 2026-03-17 Listed $89,500 YAR
- 2026-02-11 Price Changed $89,500 YAR
- 2025-11-17 Price Changed $94,000 YAR
- 2025-10-31 Price Changed $99,000 YAR
- 2025-10-23 Price Changed $109,500 YAR
Cash-flow waterfall
monthlySold comps — $/sqft
last 12 mo · ≤1 miLoading sold comps…