 Duplex
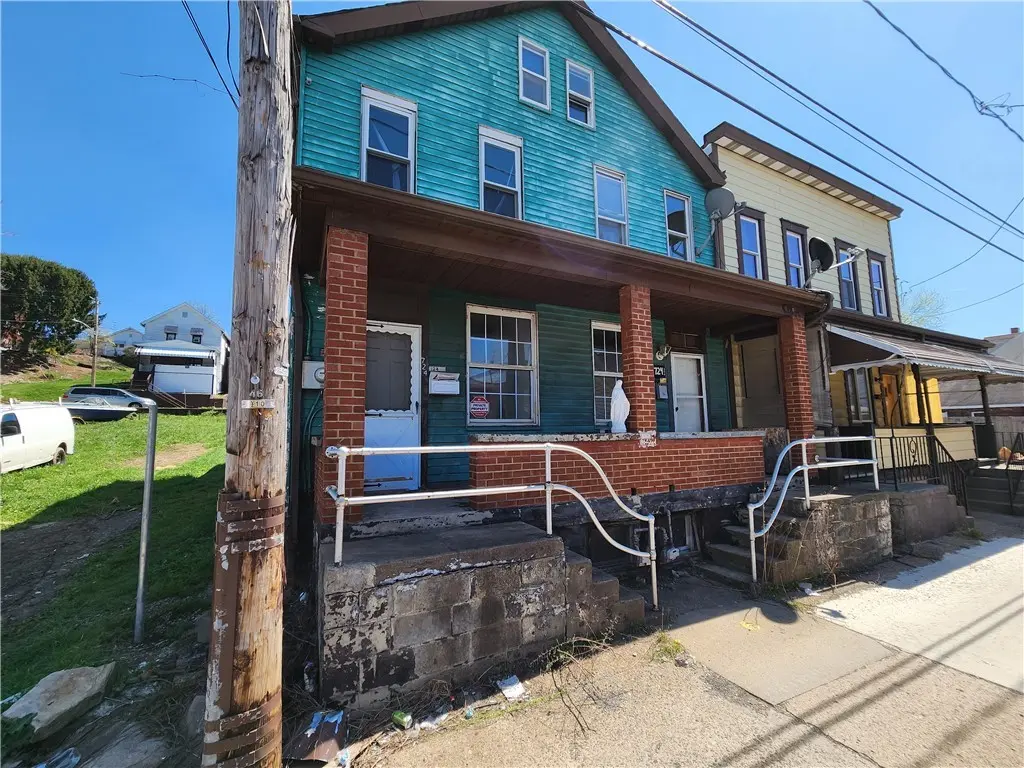
724 Hemlock Aly · Glassport, PA
Flood risk 4/10 · Minor
- FEMA flood zone
- X (unshaded)
- Chance of flooding over 30 yrs
- 0.22%
- Est. flood insurance / yr
- $473 – $860
Fire risk 1/10 · Minimal
- Est. fire insurance / yr
- $511 – $949
Heat risk 4/10 · Minor
- Hot days now (above 97°F)
- 7 days/yr
- Hot days in 30 yrs
- 19 days/yr
Wind risk 2/10 · Minimal
- Chance of severe wind over 30 yrs
- —
Air-quality risk 5/10 · Moderate
- Unhealthy air days now
- 8 days/yr
- Unhealthy air days in 30 yrs
- 8 days/yr
Risk factors via First Street. Map © Google.
Why this score? — see what drove the B grade
The composite is a weighted blend of 9 inputs, each scored 0–100. Each bar is that input's sub-score; the figure is the points it added to the 100-point composite (weight × sub-score).
- Cash flow +30.0/30.0
- 1% rule +10.0/10.0
- DSCR +10.0/10.0
- ARV discount +7.5/15.0
- Appreciation +5.1/10.0
- Livability +3.6/5.0
- Schools +2.8/10.0
- Rent growth +2.5/5.0
- Condition / age +2.5/5.0
$50,000
🖨 Deal sheet (PDF) 📄 Offer letter ✓ Due diligence
Multi-family units
County records classify this as Multi-Family (2-4 Unit). Listing-text estimate: 2 units. confirmed
Listing remarks MLS
Calling all Investors! This property presents a prime value-add opportunity for investors looking to build equity and maximize cash flow. Featuring two separate units, this property offers solid bones and strong rental potential with the right renovations. Located in a convenient area with easy access to surrounding neighborhoods, shopping, and major roadways, this property is ideal for a fix-and-hold strategy or a full reposition. With upside in both rental income and long-term appreciation, this is the perfect opportunity for savvy investors ready to bring their vision to life. Property is being sold as-is.
Key facts
- Two separate units
- Major roadways
- Shopping
Tags
Neighborhood map
What this means for you Summary
Snapshot
- This is a 2 × 2-bed/1.5-bath units multifamily listed at $50k.
Deal economics
- At list price, monthly cash flow is $1k ($14k/yr) — positive. Per door: $570/mo.
- The deal already cash-flows at list — no discount required.
- Meets the 1% rule at list price ($2k rent vs $50k).
- Recommended offer: $47k (6.0% below list) — sets the bar for market timing.
- Cap rate 33.7% vs local median 8.4% in Glassport — top-decile yield for the area; either an underpriced asset or a hidden risk that comps aren't pricing in. Stress-test before assuming the spread holds.
Location & tenants
- Location reads 71/100 on livability (#716 in PA) — a middle-class / working-renter tenant base. Strengths: cost of living A+, housing A+, commute A-; Watch: crime C-, employment D+, schools D-.
- South Allegheny SD (suburban): math 23% / reading 44% proficiency, ranked #430 of 539 in PA (top 80%) — families likely to look elsewhere, expect single-tenant / working-renter base with shorter leases.
- Market conditions: 24 active listings in the ZIP; 6 comparable units currently listed for rent nearby; rentals lingering (median 45d on market — plan ~5-8 weeks vacancy on turnover, expect pricing pressure); 50% of comp listings sitting > 30 days — soft ceiling on asking rent; 2,996 units permitted in Allegheny County in 2024 (1,588 in 5+ unit buildings).
Forward outlook
- In year one you build about $435 of equity ($346 loan paydown + $89 appreciation (0.2% local appreciation)).
- At projected returns (0.2% appreciation + 3.0% rent growth), your $14k cash investment doubles in ~1 year — after that, you're playing with house money.
Negotiation context
- It's been on market 61 days — a 6% lower offer ($47k) is reasonable based on typical stale-listing flexibility.
- Current owner paid $24k; list at $50k implies a 108% gain — meaningful room to come down on a strong offer.
Risks & watch-outs
- Watch-outs: property tax is 3.7% of price; built in 1902 — expect roof / HVAC / electrical / plumbing capex.
Questions for the listing agent
- It's been on market 61 days. Have you received any prior offers? Is the seller open to a 6% concession, seller financing, or rate buy-down credit?
- Can we see the unit-by-unit rent roll, current vacancy, and any below-market leases? What's the average tenancy length?
- What capital expenditures (roof, boiler, parking lot, exteriors) have been made in the last 5 years, and what's planned in the next 2?
- Built in 1902 — when were the roof, HVAC, electrical panel, plumbing, and water heater last replaced?
- Property tax is high relative to price — has the assessment been appealed recently, and will the sale trigger a re-assessment?
- Why hasn't it sold? Are there any deal-killer items the seller is aware of (foundation, flood, title, zoning, code violations)?
- Is there a deadline driving the sale (1031 exchange, divorce, estate, relocation)? That informs how much negotiation room exists.
- Schools are D-rated, which usually means shorter tenancies and higher turnover. Who's the typical renter profile here, and what's been the actual vacancy rate?
- What's the average days-on-market for RENTAL listings here right now (not sales)? A rising rental-DOM trend means longer vacancies and softer asking-rent achievability than the comps imply.
- What's the recent tenant-quality profile in this submarket — average credit score on applications, eviction rate, late-payment / NSF rate, and stable-employment percentage? A property-management company in the area should have these aggregated.
- How much new apartment / multifamily construction is in the pipeline within 1–3 miles? Heavy new supply (>2% of stock underway) typically softens rents 12–24 months out; light construction supports rent growth.
Investment metrics
- 1% rule
- 3.99% ✓
- Cap rate
- 33.67%
- Cash-on-cash
- 97.79%
- DSCR
- 5.35
- GRM
- 2.1
CMA / ARV
- ARV (median comp)
- $145,039
- List price
- $50,000
- Delta
- -65.53%
- Verdict
- UNDERPRICED
- Comps
- 1 within 2.0 mi
Projected returns pro-forma
0.18% appreciation · 3.0% rent growth · sell at horizon
- IRR
- —
- Equity multiple
- 6.12×
- Total profit
- $71,705
- Equity at exit
- $14,966
- IRR
- —
- Equity multiple
- 12.67×
- Total profit
- $163,391
- Equity at exit
- $18,350
Cash invested: $14,000 (down + closing). Projections, not guarantees.
Landlord ↔ Tenant lean methodology
- Overall (STATE)
- 62 Landlord-Friendly
- State Pennsylvania
- 62 Landlord-Friendly · EVEN
- County
- — inherits STATE
- City
- — inherits STATE
ZIP-level market 15045
- Home prices YoY
- 0.1%
- Active inventory
- 24
- Price-to-rent
- 4.2×
Monthly cashflow live
- Estimated rent
- $1,997 high interval (Pro) →
- Mortgage (P&I)
- −$262
- Tax from tax record
- −$154 /mo · $1,845/yr
- Insurance
- −$21
- HOA
- −$0
- Vacancy / Maint / Mgmt
- −$419
- Net cashflow
- $1,141
Break-even live
Sensitivity live
| Price | -10% $1,169 | -5% $1,155 | +0% $1,141 | +5% $1,127 | +10% $1,113 |
|---|---|---|---|---|---|
| Rent | -10% $983 | -5% $1,062 | +0% $1,141 | +5% $1,220 | +10% $1,299 |
| Rate | -1.0pp $1,166 | -0.5pp $1,154 | base $1,141 | +0.5pp $1,128 | +1.0pp $1,115 |
2-unit breakdown (identical units grouped — click to expand)
| Units | Beds | Baths | Est. rent |
|---|---|---|---|
| 2× units | 2 | 1.5 | $1,996 |
| #1 | 2 | 1.5 | $998 |
| #2 | 2 | 1.5 | $998 |
| Total (2 units) | $1,997 | ||
UW: 25.0% down · 7.5% · 30yr · 1.5% tax · 5.0% vac · 8.0% maint · 8.0% mgmt
Financing live
Cash to close
- Down payment
- $12,500
- Closing costs
- $1,500
- Reserves months
- —
- Total cash needed
- —
Loan-product check · same deal, 3 products live
Conventional
25% down · 7.5% · 30yr
- Down + closing
- —
- Monthly P&I
- —
- Monthly cashflow
- —
- DSCR
- —
- Eligible?
- —
Personal DTI + credit; lowest rate.
DSCR
20% down · 8.5% · 30yr
- Down + closing
- —
- Monthly P&I
- —
- Monthly cashflow
- —
- DSCR
- —
- Eligible?
- —
No personal income docs; deal must DSCR.
Hard money
10% down · 12.0% · 12mo
- Down + closing
- —
- Monthly P&I
- —
- Monthly cashflow
- —
- DSCR
- —
- Eligible?
- —
Short-term bridge; refi at stabilization.
Rent comps 6 comps
| Address | Beds | Baths | Sqft | Rent | $/sqft | DOM | Units | Dist |
|---|---|---|---|---|---|---|---|---|
| 833 Vermont Ave Glassport, PA | 3.0 | 1.0 | 1290 | $1,395 | $1.08 | 24d | 1 | 0.23mi |
| 1044 Delaware Ave Glassport, PA | 3.0 | 1.0 | 1200 | $1,350 | $1.12 | 21d | 1 | 0.49mi |
| 311 Harrison St Glassport, PA | 4.0 | 1.0 | 1200 | $1,500 | $1.25 | 44d | 1 | 0.86mi |
| 231 Connecticut Ave Clairton, PA | 3.0 | 1.0 | 1064 | $1,150 | $1.08 | 44d | 1 | 0.93mi |
| 185 Carnegie Ave Clairton, PA | 3.0 | 1.0 | 1404 | $1,295 | $0.92 | 44d | 1 | 1.12mi |
| 1805 Gray St McKeesport, PA | 3.0 | 1.0 | 1136 | $1,600 | $1.41 | 2d | 1 | 1.48mi |
Listing history 10 events
-
2026-06-09days on market $50,000 Active 61 DOM
-
2026-06-08days on market $50,000 Active 60 DOM
-
2026-06-07pricedays on market $50,000 Active 59 DOM
-
2026-06-05days on market $68,000 Active 56 DOM
-
2026-06-03days on market $68,000 Active 55 DOM
-
2026-06-02days on market $68,000 Active 54 DOM
-
2026-06-01days on market $68,000 Active 53 DOM
-
2026-05-31days on market $68,000 Active 52 DOM
-
2026-04-09$68,000 Active 616-char remark
Show marketing remark (616 chars)
Calling all Investors! This property presents a prime value-add opportunity for investors looking to build equity and maximize cash flow. Featuring two separate units, this property offers solid bones and strong rental potential with the right renovations. Located in a convenient area with easy access to surrounding neighborhoods, shopping, and major roadways, this property is ideal for a fix-and-hold strategy or a full reposition. With upside in both rental income and long-term appreciation, this is the perfect opportunity for savvy investors ready to bring their vision to life. Property is being sold as-is.
-
2002-10-24soldstatus $24,000
ⓘ Source: listings_history table (triggers on properties + properties_extension) + one-shot
backfill from property_details.listing_events for pre-trigger history.
Tax reassessment forecast PA · Partial reset (capped growth)
- Current annual tax
- $1,845 · $154/mo
- Projected year-2 tax
- $1,845 · $154/mo
- Expected delta
- $0/yr ($0/mo · 0.0%)
ⓘ Screening estimate from a state-policy table — verify with the county assessor before closing.
Climate risk First Street
- Flood 4/10 Moderate FEMA zone X (unshaded) · 22% chance over 30 yrs
- Wildfire 1/10 Low
- Heat 4/10 Moderate 7 d/yr ≥97°F today · 19 d/yr by 30 yrs out
- Wind 2/10 Low
- Air quality 5/10 Major 8 unhealthy d/yr today · 8 by 30 yrs out
Nearby sold comps map
Loading sold comps map…
Walkable amenities ~0.75 mi
Loading nearby amenities…
Taxation est. · year 1
- Rental income
- $23,964
- − Mortgage interest
- −$2,801
- − Property taxes
- −$1,845
- − Insurance
- −$250
- − Repairs & maintenance
- −$1,917
- − Management
- −$1,917
- − Depreciation
- −$1,455
- Taxable income
- $13,780
- Est. tax owed @ 24.0%
- −$3,307
- After-tax cash flow
- $10,383/yr
For passive investors: Depreciation is non-cash, so a rental often shows a tax loss while cash-flowing — sheltering income. Rental losses are passive: they offset passive income freely, and up to $25,000/yr can offset ordinary (W-2) income if you actively participate and your MAGI is under $100k (phasing out to $0 by $150k); unused losses carry forward. On sale, claimed depreciation is recaptured at up to 25%, and gains may owe capital-gains tax (a 1031 exchange can defer both). Figures are a year-1 estimate at your 24.0% rate — not tax advice; consult a CPA.
Schools (NCES district)
- District
- South Allegheny SD
- NCES district ID
- 4221910
- Math proficiency
- 23% ▼ -10.00%
- Reading proficiency
- 44% ▼ -13.00%
- Median HH income
- $40,891
- Composite
- 28.15/100
- National rank
- #6815
- State rank
- #430 of 539 in PA
Livability — Glassport
- Score
- 71/100
- State rank
- #716
- US rank
- #7113
Category grades
Schools grade is shown separately in the Schools card above.
Census & demographics
- Census place
- Glassport, PA
- City population
- 4,400
- Population (ZIP)
- 4,400
Population outlook (Allegheny County) Hauer SSP2
- Today (2025)
- 1,250,282 people
- By 2030
- 1,256,482 · +0.5%
- By 2040
- 1,256,318 · +0.5%
- By 2050
- 1,244,169 · -0.5%
- By 2075
- 1,197,693 · -4.2%
- By 2100
- 1,093,187 · -12.6%
Race, ethnicity, and origin ACS 2023
- Neighborhood character
- Predominantly White (88%)
- Race & ethnicity
- White 88% Hispanic / Latino 6% Black 4% Two or more races 3%
- Hispanic origin (detail)
- Mexican 4%
- Common ancestry
- Romanian 18% Portuguese 6% Serbian 6%
- Foreign-born
- 1% · South Korea, Canada
- Languages at home
- 97% English-only · German/W. Germanic 1% Spanish 1% Korean 1%
Political lean MEDSL · Allegheny
- 2024 margin
- Strong D (+20.3) · D 59.7% · R 39.4%
- 2008→2024 swing
- +4.8pp toward D · 2008: 15.5pp · 2024: 20.3pp
- All cycles
- 2024: D+20.3 2020: D+20.4 2016: D+16.4 2012: D+14.4 2008: D+15.5
Not yet ingested
- Civics
- —
Market trends
- HPI YoY
- ▲ 0.18%
- Current HPI
- 214.7403
- Rent YoY
- —
- Metro
- —
- State GDP YoY
- ▲ 1.68%
- F500 in state
- 34
Industry mix (Fortune 500 HQ in PA)
| Industry | F500 HQs | Revenue |
|---|---|---|
| Healthcare | 2 | $309B |
|
||
| Insurance | 2 | $27B |
|
||
| Telecommunications / Media | 1 | $124B |
|
||
| Industrial Distribution | 1 | $22B |
|
||
| Financial Services | 1 | $20B |
|
||
| Chemicals / Materials | 1 | $18B |
|
||
Price history
+183.3% since first listed2 events — show timeline
- 2026-04-09 Listed $68,000 West Penn MLS
- 2002-10-24 Sold (Public Records) $24,000 Public Records
Property tax history
+4.4%/yrLatest (2026): $1,845 · +6.9% YoY. Source: county tax records.
Cash-flow waterfall
monthlySold comps — $/sqft
last 12 mo · ≤1 miLoading sold comps…