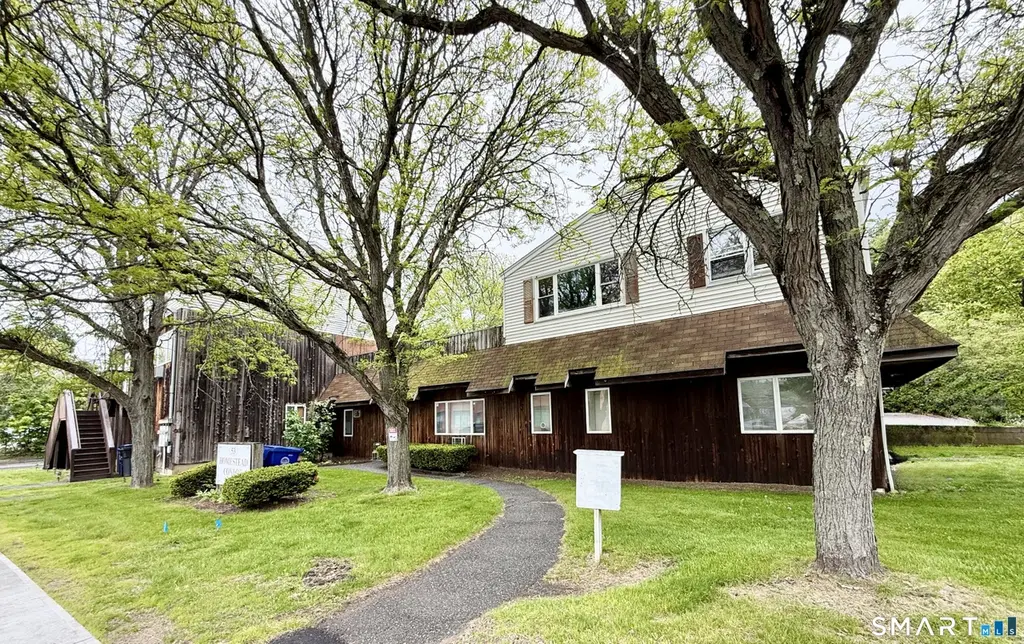
53 Harwinton Ave #3 · Torrington, CT
Flood risk No data
- FEMA flood zone
- —
- Chance of flooding over 30 yrs
- —
- Est. flood insurance / yr
- —
Fire risk No data
- Est. fire insurance / yr
- —
Heat risk No data
- Hot days now (above threshold)
- —
- Hot days in 30 yrs
- —
Wind risk No data
- Chance of severe wind over 30 yrs
- —
Air-quality risk No data
- Unhealthy air days now
- —
- Unhealthy air days in 30 yrs
- —
Risk factors via First Street. Map © Google.
Why this score? — see what drove the D+ grade
The composite is a weighted blend of 9 inputs, each scored 0–100. Each bar is that input's sub-score; the figure is the points it added to the 100-point composite (weight × sub-score).
- Cash flow +17.4/30.0
- ARV discount +7.5/15.0
- 1% rule +6.5/10.0
- DSCR +5.4/10.0
- Rent growth +4.0/5.0
- Livability +3.8/5.0
- Schools +2.7/10.0
- Condition / age +2.5/5.0
- Appreciation +0.0/10.0
$149,000
🖨 Deal sheet 📄 Offer letter ✓ Due diligence
Listing remarks MLS
The most square footage for the money in this price range. A unique open layout that must be seen. Total of 8 units are in the complex. Hoa fees of $295. Cool loft style duplex. Just needs a few cosmetics and this condo is good to go!
Key facts
- Built 1987
- Listed 10 days
Property features AI
Finance
- HOA & community: Homeowners association with monthly fee; HOA fee $250 per month; Association covers grounds maintenance, trash pickup, and snow removal
Exterior
- Utilities: Public water (in street); Public sewer (in street); Electric service for heat and hot water
- Home design: Single-family home
- Construction: Frame construction; Concrete foundation; Asphalt shingle roof; Built as single family
- Exterior features: Lightly wooded lot; Vinyl siding
Interior
- Bedrooms: 2 bedrooms
- Bathrooms: 2 full bathrooms
- Heating & cooling: Electric baseboard heat; Electric hot water
- Interior features: Central air conditioning; No basement; Total of 5 rooms
Neighborhood map
What this means for you Summary
Snapshot
- This is a 2-bed/2.0-bath condo listed at $149k.
Deal economics
- At list price, monthly cash flow is $111 ($1k/yr) — positive.
- The deal already cash-flows at list — no discount required.
- Meets the 1% rule at list price ($2k rent vs $149k).
- Cap rate 7.2% vs local median 3.9% in Torrington — top-decile yield for the area; either an underpriced asset or a hidden risk that comps aren't pricing in. Stress-test before assuming the spread holds.
Location & tenants
- Location reads 76/100 on livability (#53 in CT, #3,449 nationally) — a middle-class / working-renter tenant base. Strengths: crime A+, cost of living A+, housing A+; Watch: schools D, commute F.
- Torrington School District (town): math 22% / reading 39% proficiency, ranked #125 of 153 in CT (top 82%) — families likely to look elsewhere, expect single-tenant / working-renter base with shorter leases.
- Market conditions: Rents rising fast (+5.9%/yr); 188 active listings in the ZIP; 27 comparable units currently listed for rent nearby; rentals lingering (median 44d on market — plan ~5-8 weeks vacancy on turnover, expect pricing pressure); 81% of comp listings sitting > 30 days — soft ceiling on asking rent; 154 units permitted in Northwest Hills Planning Region in 2024 (6 in 5+ unit buildings).
Forward outlook
- Local home prices are declining (-3.0%/yr); year-one equity from $1k of loan paydown is wiped out by about $4k of value loss. Plan a longer hold.
Negotiation context
- Only 11 days on market — expect competitive offers; lowballing is unlikely to land.
- 9 sale attempts since 22y ago with the ask held roughly flat each time — persistent listings suggest the price (not the market) is what's stuck; bring a comps-based counter.
- Current owner paid $25k; list at $149k implies a 496% gain — meaningful room to come down on a strong offer.
Questions for the listing agent
- What does the HOA fee cover, when was the last increase, and are there any pending special assessments or reserve-fund shortfalls?
- Any open or pending special assessments — roof, HVAC, plumbing, elevator, façade? What's the per-unit balance and payoff schedule, and is the seller paying it off at close or rolling it to the buyer?
- Is there a deadline driving the sale (1031 exchange, divorce, estate, relocation)? That informs how much negotiation room exists.
- Schools are D-rated, which usually means shorter tenancies and higher turnover. Who's the typical renter profile here, and what's been the actual vacancy rate?
- The area grade is low — what's the realistic commute time and amenity access for the typical tenant pool here? Any planned neighborhood developments (good or bad) we should know about?
- What's the average days-on-market for RENTAL listings here right now (not sales)? A rising rental-DOM trend means longer vacancies and softer asking-rent achievability than the comps imply.
- What's the recent tenant-quality profile in this submarket — average credit score on applications, eviction rate, late-payment / NSF rate, and stable-employment percentage? A property-management company in the area should have these aggregated.
- How much new apartment / multifamily construction is in the pipeline within 1–3 miles? Heavy new supply (>2% of stock underway) typically softens rents 12–24 months out; light construction supports rent growth.
Investment metrics
- 1% rule
- 1.15% ✓
- Cap rate
- 7.19%
- Cash-on-cash
- 3.20%
- DSCR
- 1.14
- GRM
- 7.2
CMA / ARV
No comps found within radius.
Projected returns pro-forma
-3.0% appreciation · 5.89% rent growth · sell at horizon
- IRR
- -7.4%
- Equity multiple
- 0.72×
- Total profit
- $-11,765
- Equity at exit
- $22,216
- IRR
- 6.1%
- Equity multiple
- 1.52×
- Total profit
- $21,891
- Equity at exit
- $12,883
Cash invested: $41,720 (down + closing). Projections, not guarantees.
Landlord ↔ Tenant lean methodology
- Overall (STATE)
- 27 Tenant-Leaning
- State Connecticut
- 27 Tenant-Leaning · D+7
- County
- — inherits STATE
- City
- — inherits STATE
ZIP-level market 06790
- Rents YoY
- 5.9%
- Active inventory
- 188
- Price-to-rent
- 7.2×
Monthly cashflow live
- Estimated rent
- $1,717 high interval (Pro) →
- Mortgage (P&I)
- −$781
- Tax from tax record
- −$152 /mo · $1,824/yr
- Insurance
- −$62
- HOA
- −$250
- Vacancy / Maint / Mgmt
- −$361
- Net cashflow
- $111
Break-even live
UW: 25.0% down · 7.5% · 30yr · 1.5% tax · 5.0% vac · 8.0% maint · 8.0% mgmt
Financing live
Cash to close
- Down payment
- $37,250
- Closing costs
- $4,470
- Reserves months
- —
- Total cash needed
- —
Loan-product check · same deal, 3 products live
Conventional
25% down · 7.5% · 30yr
- Down + closing
- —
- Monthly P&I
- —
- Monthly cashflow
- —
- DSCR
- —
- Eligible?
- —
Personal DTI + credit; lowest rate.
DSCR
20% down · 8.5% · 30yr
- Down + closing
- —
- Monthly P&I
- —
- Monthly cashflow
- —
- DSCR
- —
- Eligible?
- —
No personal income docs; deal must DSCR.
Hard money
10% down · 12.0% · 12mo
- Down + closing
- —
- Monthly P&I
- —
- Monthly cashflow
- —
- DSCR
- —
- Eligible?
- —
Short-term bridge; refi at stabilization.
Rent comps 27 comps
| Address | Beds | Baths | Sqft | Rent | $/sqft | DOM | Units | Dist |
|---|---|---|---|---|---|---|---|---|
| 261 Hillside Ave Unit 2 Torrington, CT | 2.0 | 1.0 | 1344 | $1,300 | $0.97 | 24d | 1 | 0.31mi |
| 71 Arthur St #1 Torrington, CT | 2.0 | 1.5 | 1326 | $1,800 | $1.36 | 24d | 1 | 0.40mi |
| 61 Clarence St Torrington, CT | 2.0 | 1.0 | 924 | $1,250 | $1.35 | 3d | 1 | 0.44mi |
| 84 Wilmot St Torrington, CT | 2.0 | 1.5 | 1768 | $1,850 | $1.05 | 24d | 1 | 0.47mi |
| 53 Prospect St Unit 2 Torrington, CT | 3.0 | 1.5 | 1100 | $2,100 | $1.91 | 44d | 1 | 0.52mi |
| 243 E Elm St Unit 3 Torrington, CT | 3.0 | 1.0 | 1000 | $1,800 | $1.80 | 44d | 1 | 0.59mi |
| 152 Turner Ave #2 Torrington, CT | 2.0 | 1.0 | 1200 | $1,550 | $1.29 | 44d | 1 | 0.75mi |
| 42 Pulver St Torrington, CT | 3.0 | 1.0 | 1443 | $1,800 | $1.25 | 44d | 1 | 0.77mi |
| 93 E Elm St Unit U2 Torrington, CT | 3.0 | 1.0 | 1100 | $1,550 | $1.41 | 44d | 1 | 0.79mi |
| 54 Forest St Unit 2 Torrington, CT | 3.0 | 1.0 | 1000 | $1,800 | $1.80 | 44d | 1 | 0.79mi |
| 5 Winthrop St Torrington, CT | 3.0 | 1.5 | 1072 | $2,350 | $2.19 | 44d | 1 | 0.83mi |
| 101 Culvert St Unit 101 Torrington, CT | 3.0 | 1.0 | 1200 | $1,600 | $1.33 | 44d | 1 | 0.88mi |
| 90 24 Bumper Rd Harwinton, CT | 2.0 | 2.0 | 1020 | $1,800 | $1.76 | 44d | 1 | 0.89mi |
| 199 Migeon Ave Unit 2 Torrington, CT | 3.0 | 1.0 | 1500 | $2,350 | $1.57 | 44d | 1 | 0.89mi |
| 86 Belleview Ave Torrington, CT | 2.0 | 1.0 | 990 | $1,950 | $1.97 | 44d | 1 | 0.89mi |
| 119 Culvert St Unit 2nd Floor Torrington, CT | 2.0 | 1.0 | 900 | $1,050 | $1.17 | 44d | 1 | 0.91mi |
| 340 Brightwood Ave Unit 2 Torrington, CT | 3.0 | 1.0 | 1080 | $1,900 | $1.76 | 44d | 1 | 0.92mi |
| 58 Pulaski St Unit 3 Torrington, CT | 3.0 | 1.0 | 980 | $1,550 | $1.58 | 44d | 1 | 1.01mi |
| 148 Edgewood Dr Torrington, CT | 3.0 | 1.0 | 1000 | $2,500 | $2.50 | 24d | 1 | 1.01mi |
| 696 Main St Unit 2 Torrington, CT | 2.0 | 1.0 | 1117 | $1,350 | $1.21 | 44d | 1 | 1.07mi |
| 21 Woodbine St Torrington, CT | 2.0 | 1.0 | 1516 | $1,850 | $1.22 | 44d | 1 | 1.10mi |
| 17 Woodbine St Torrington, CT | 3.0 | 1.5 | 1430 | $2,200 | $1.54 | 44d | 1 | 1.10mi |
| 63 Smith St Torrington, CT | 3.0 | 1.5 | 1392 | $2,200 | $1.58 | 44d | 1 | 1.18mi |
| 785 Main St Torrington, CT | 2.0 | 1.0 | 1000 | $1,500 | $1.50 | 44d | 1 | 1.20mi |
| 375 N Elm St Unit 2 Torrington, CT | 2.0 | 1.0 | 1100 | $1,700 | $1.55 | 44d | 1 | 1.24mi |
| 19 Wadhams Ave Torrington, CT | 2.0 | 1.5 | 1112 | $1,895 | $1.70 | 44d | 1 | 1.36mi |
| 158 Daley Dr Torrington, CT | 2.0 | 1.5 | 1100 | $1,650 | $1.50 | 44d | 1 | 1.38mi |
HOA detail condo
- Monthly dues
- $250 · $3,000/yr
- Assessments
- None detected in remarks — confirm with the listing agent.
Listing history 10 events
-
2026-06-19days on market $149,000 Active 11 DOM
-
2026-06-18days on market $149,000 Active 10 DOM
-
2026-06-17days on market $149,000 Active 9 DOM
-
2026-06-16days on market $149,000 Active 8 DOM
-
2026-06-15days on market $149,000 Active 7 DOM
-
2026-06-14days on market $149,000 Active 5 DOM
-
2026-06-13days on market $149,000 Active 4 DOM
-
2026-06-10days on market $149,000 Active 2 DOM
-
2026-06-09remarks 601-char remark
-
2026-06-09$149,000 Active 1 DOM
ⓘ Source: listings_history table (triggers on properties + properties_extension) + one-shot
backfill from property_details.listing_events for pre-trigger history.
Tax reassessment forecast CT · Partial reset (capped growth)
- Current annual tax
- $1,824 · $152/mo
- Projected year-2 tax
- $2,506 · $209/mo
- Expected delta
- +$682/yr (+$57/mo · 37.4%)
ⓘ Screening estimate from a state-policy table — verify with the county assessor before closing.
Nearby sold comps map
Loading sold comps map…
Walkable amenities ~0.75 mi
Loading nearby amenities…
Taxation est. · year 1
- Rental income
- $20,607
- − Mortgage interest
- −$8,346
- − Property taxes
- −$1,824
- − Insurance
- −$745
- − Repairs & maintenance
- −$1,649
- − Management
- −$1,649
- − HOA
- −$3,000
- − Depreciation
- −$4,335
- Taxable loss
- −$940
- Est. tax savings @ 24.0%
- +$225
- After-tax cash flow
- $1,560/yr
For passive investors: Depreciation is non-cash, so a rental often shows a tax loss while cash-flowing — sheltering income. Rental losses are passive: they offset passive income freely, and up to $25,000/yr can offset ordinary (W-2) income if you actively participate and your MAGI is under $100k (phasing out to $0 by $150k); unused losses carry forward. On sale, claimed depreciation is recaptured at up to 25%, and gains may owe capital-gains tax (a 1031 exchange can defer both). Figures are a year-1 estimate at your 24.0% rate — not tax advice; consult a CPA.
Schools (NCES district)
- District
- Torrington School District
- NCES district ID
- 0904590
- Math proficiency
- 22% ▼ -8.00%
- Reading proficiency
- 39% ▼ -6.00%
- Median HH income
- $53,647
- Composite
- 26.9/100
- National rank
- #7087
- State rank
- #125 of 153 in CT
Livability — Torrington
- Score
- 76/100
- State rank
- #53
- US rank
- #3449
Category grades
Schools grade is shown separately in the Schools card above.
Census & demographics
- Census place
- Torrington, CT
- County
- Litchfield County · 81,203 people
- City population
- 35,566
- Metro
- Torrington, CT
- Population (ZIP)
- 35,566
- Household income
- $70,912
- Rent vs Own
- Severe rent burden
- 1401.0
Population outlook (Northwest Hills County) Hauer SSP2
- By 2040
- 118,998
Race, ethnicity, and origin ACS 2023
- Neighborhood character
- Predominantly White (73%)
- Race & ethnicity
- White 73% Hispanic / Latino 14% Two or more races 8% Black 6% Asian 3%
- Hispanic origin (detail)
- Puerto Rican 5% Dominican 2%
- Common ancestry
- Romanian 8% Lithuanian 5% Slovak 2%
- Foreign-born
- 12% · Canada, South Korea, Jamaica
- Languages at home
- 86% English-only · Spanish 8% Other Indo-European 2% Russian/Polish/Slavic 1%
Political lean MEDSL · Northwest Hills
- 2024 margin
- Toss-up / Even · D 48.6% · R 49.9% · Other 1.6%
- All cycles
- 2024: R+1.3
Not yet ingested
- Civics
- —
Market trends
- HPI YoY
- ▼ -122.78%
- Current HPI
- 208.4818
- Rent YoY
- ▲ 5.89%
- Metro
- Torrington, CT
- State GDP YoY
- ▲ 1.06%
- F500 in state
- 38
Industry mix (Fortune 500 HQ in CT)
| Industry | F500 HQs | Revenue |
|---|---|---|
| Industrial Machinery | 4 | $38B |
|
||
| Insurance | 3 | $71B |
|
||
| Financial Services | 2 | $25B |
|
||
| Transportation / Logistics | 2 | $18B |
|
||
| Healthcare | 1 | $247B |
|
||
| Telecommunications | 1 | $55B |
|
||
Price history
+49.0% since first listed21 events — show timeline
- 2026-06-08 Listed $149,000 Smart MLS
- 2013-01-27 Listing Removed — Smart MLS
- 2012-10-29 Sold (MLS) $25,000 Smart MLS
- 2012-10-02 Listed $29,900 Smart MLS
- 2012-08-24 Listed $29,900 Smart MLS
- 2012-08-17 Sold (MLS) $4,750 Smart MLS
- 2012-07-13 Listed $29,000 Smart MLS
- 2012-07-06 Listing Removed — Smart MLS
- 2012-03-02 Listed $29,000 Smart MLS
- 2009-05-19 Listing Removed — Smart MLS
- 2008-08-19 Listed $105,500 Smart MLS
- 2008-03-12 Listing Removed — Smart MLS
- 2007-09-11 Listed $115,500 Smart MLS
- 2007-01-17 Listing Removed — Smart MLS
- 2006-07-26 Listed $118,900 Smart MLS
- 2004-05-21 Sold (Public Records) $88,400 Public Records
- 2004-05-21 Sold (MLS) $88,400 Smart MLS
- 2004-02-04 Listed $84,900 Smart MLS
- 1995-10-12 Sold (Public Records) $50,000 Public Records
- 1991-10-24 Sold (Public Records) $99,000 Public Records
- 1988-09-15 Sold (Public Records) $100,000 Public Records
Property tax history
-5.3%/yrLatest (2023): $1,824 · +1.7% YoY. Source: county tax records.
Cash-flow waterfall
monthlySold comps — $/sqft
last 12 mo · ≤1 miLoading sold comps…