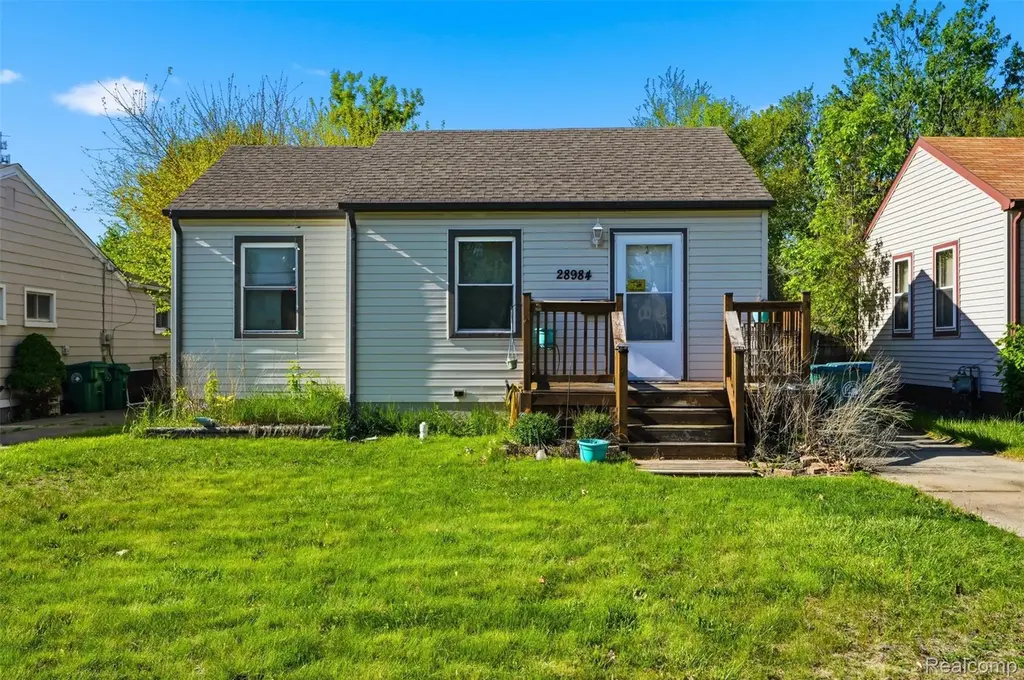
28984 Beechwood St · Garden City, MI
Flood risk 1/10 · Minimal
- FEMA flood zone
- X (unshaded)
- Chance of flooding over 30 yrs
- 0.0%
- Est. flood insurance / yr
- $507 – $1,088
Fire risk 1/10 · Minimal
- Est. fire insurance / yr
- $784 – $1,456
Heat risk 3/10 · Minor
- Hot days now (above 98°F)
- 7 days/yr
- Hot days in 30 yrs
- 15 days/yr
Wind risk 2/10 · Minimal
- Chance of severe wind over 30 yrs
- —
Air-quality risk 2/10 · Minimal
- Unhealthy air days now
- 1 days/yr
- Unhealthy air days in 30 yrs
- 2 days/yr
Risk factors via First Street. Map © Google.
Why this score? — see what drove the B- grade
The composite is a weighted blend of 9 inputs, each scored 0–100. Each bar is that input's sub-score; the figure is the points it added to the 100-point composite (weight × sub-score).
- Cash flow +23.3/30.0
- ARV discount +15.0/15.0
- DSCR +7.5/10.0
- 1% rule +7.3/10.0
- Livability +4.1/5.0
- Rent growth +3.4/5.0
- Schools +2.6/10.0
- Condition / age +2.5/5.0
- Appreciation +0.0/10.0
$135,000
🖨 Deal sheet 📄 Offer letter ✓ Due diligence
Listing remarks MLS
Welcome to 28984 Beechwood Street in Garden City - a place that instantly feels like home. This beautifully remodeled three-bedroom ranch combines warmth, comfort, and modern updates to create the perfect space for life's everyday moments. Renovated in 2021, every detail was thoughtfully designed to make this home both inviting and functional. Step inside to a bright and spacious living room filled with natural light, creating the perfect atmosphere for cozy movie nights, holiday gatherings, or simply relaxing after a long day. The dining area flows seamlessly into the updated kitchen, making it easy to stay connected while cooking, entertaining, or sharing meals with the people who matter most. With three comfortable bedrooms, a convenient laundry room, and a layout designed for easy living, this home offers the perfect balance of charm and practicality. Outside, you'll love being just minutes from local restaurants, shopping, parks, and everything you need, while still enjoying the comfort of a quiet neighborhood setting. Whether you're buying your very first home, starting a new chapter, or looking for a fresh beginning, 28984 Beechwood Street is more than just a house - it's a place where memories are waiting to be made.
Key facts
- Remodeled ranch
- Updated kitchen
- 5,227 sq ft lot
Tags
Property features AI
Exterior
- Parking: No garage
- Utilities: Public water; Public sewer
- Home design: Single-family residence; One story; Ground-level entry
- Construction: Brick and vinyl siding exterior; Brick/mortar foundation; Built area above grade: 978 square feet
- Exterior features: Paved road access; Lot approximately 0.12 acres (40 x 135)
Interior
- Bathrooms: One full bathroom
- Heating & cooling: Forced air heating (natural gas); No central cooling
- Interior features: Crawl space basement; Three total rooms
Neighborhood map
What this means for you Summary
Snapshot
- This is a 3-bed/1.0-bath single-family listed at $135k.
Deal economics
- At list price, monthly cash flow is $246 ($3k/yr) — positive.
- The deal already cash-flows at list — no discount required.
- Meets the 1% rule at list price ($2k rent vs $135k).
- Recommended offer: $131k (3.0% below list) — sets the bar for market timing.
- Cap rate 8.5% vs local median 5.8% in Garden City — top-decile yield for the area; either an underpriced asset or a hidden risk that comps aren't pricing in. Stress-test before assuming the spread holds.
Location & tenants
- Location reads 82/100 on livability (#53 in MI, #1,047 nationally) — a professional / high-income tenant draw. Strengths: cost of living A+, housing A+, commute A; Watch: employment C-, schools D-.
- Garden City Public Schools (suburban): math 22% / reading 36% proficiency, ranked #365 of 540 in MI (top 68%) — low school quality limits family demand, transient renter base, plan for 1-2y turnover.
- Market conditions: Rents rising (+3.6%/yr); 134 active listings in the ZIP; 11 comparable units currently listed for rent nearby; rentals at typical pace (median 17d on market — plan ~3-4 weeks tenant-placement turnaround); 2,639 units permitted in Wayne County in 2024 (1,216 in 5+ unit buildings).
Forward outlook
- Local home prices are declining (-3.0%/yr); year-one equity from $933 of loan paydown is wiped out by about $4k of value loss. Plan a longer hold.
- Wayne County population projected at -17% by 2050 — secular population decline; favor cash flow + early exit over multi-decade hold.
Negotiation context
- It's been on market 31 days — a 3% lower offer ($131k) is reasonable based on typical stale-listing flexibility.
- 11 sale attempts since 28y ago; this cycle's ask has dropped $15k (10%) from the opening price — seller is motivated, your offer sets the floor, not the list.
Risks & watch-outs
- Watch-outs: property tax is 2.7% of price; built in 1942 — expect roof / HVAC / electrical / plumbing capex.
Questions for the listing agent
- It's been on market 31 days. Have you received any prior offers? Is the seller open to a 3% concession, seller financing, or rate buy-down credit?
- Built in 1942 — when were the roof, HVAC, electrical panel, plumbing, and water heater last replaced?
- Property tax is high relative to price — has the assessment been appealed recently, and will the sale trigger a re-assessment?
- Is there a deadline driving the sale (1031 exchange, divorce, estate, relocation)? That informs how much negotiation room exists.
- Schools are D-rated, which usually means shorter tenancies and higher turnover. Who's the typical renter profile here, and what's been the actual vacancy rate?
- What's the average days-on-market for RENTAL listings here right now (not sales)? A rising rental-DOM trend means longer vacancies and softer asking-rent achievability than the comps imply.
- What's the recent tenant-quality profile in this submarket — average credit score on applications, eviction rate, late-payment / NSF rate, and stable-employment percentage? A property-management company in the area should have these aggregated.
- How much new for-sale + rental construction is in the pipeline within 1–3 miles? Heavy new supply typically softens prices + rents 12–24 months out; constrained supply supports both.
Investment metrics
- 1% rule
- 1.23% ✓
- Cap rate
- 8.48%
- Cash-on-cash
- 7.81%
- DSCR
- 1.35
- GRM
- 6.8
CMA / ARV
- ARV (on-the-fly)
- $177,996
- Comps found
- 12
Show comp detail 12 sales within ~0.75 mi
| Address | Dist | Beds/Ba | Sqft | Sold | Price | $/sf | Match |
|---|---|---|---|---|---|---|---|
| 28824 Birchlawn St | 0.11mi | 2/1.0 (-1) | 1,034 (+6%) | 2mo | $60,000 | $58 | 78 |
| 28807 Block St | 0.19mi | 3/1.0 | 895 (-8%) | 2mo | $163,200 | $182 | 75 |
| 1843 Lathers St | 0.44mi | 2/1.0 (-1) | 978 (0%) | 1mo | $179,000 | $183 | 74 |
| 5643 Gilman St | 0.43mi | 4/1.0 (+1) | 1,000 (+2%) | 6mo | $190,000 | $190 | 66 |
| 2019 Helen St | 0.54mi | 3/1.0 | 934 (-4%) | 4mo | $158,000 | $169 | 64 |
| 29725 Brown Ct | 0.69mi | 3/1.0 | 925 (-5%) | 1mo | $185,000 | $200 | 58 |
| 1147 Harrison Ave | 0.65mi | 3/1.0 | 1,065 (+9%) | 0mo | $187,000 | $176 | 54 |
| 28710 Cambridge St | 0.64mi | 3/2.0 | 1,030 (+5%) | 5mo | $175,000 | $170 | 53 |
| 6331 Helen St | 0.55mi | 3/1.0 | 1,113 (+14%) | 2mo | $225,000 | $202 | 50 |
| 29536 Dover St | 0.58mi | 2/1.0 (-1) | 897 (-8%) | 6mo | $156,000 | $174 | 49 |
| 28513 Barton St | 0.75mi | 3/2.0 | 915 (-6%) | 4mo | $241,000 | $263 | 47 |
| 28627 Bridge St | 0.68mi | 3/2.0 | 1,100 (+12%) | 5mo | $175,000 | $159 | 40 |
Match score weights: distance 35% · size 25% · config 20% · recency 20%. Top-matched comps best support the ARV.
Projected returns pro-forma
-3.0% appreciation · 3.65% rent growth · sell at horizon
- IRR
- -3.5%
- Equity multiple
- 0.87×
- Total profit
- $-5,009
- Equity at exit
- $20,129
- IRR
- 7.1%
- Equity multiple
- 1.55×
- Total profit
- $20,791
- Equity at exit
- $11,672
Cash invested: $37,800 (down + closing). Projections, not guarantees.
Landlord ↔ Tenant lean methodology
- Overall (STATE)
- 62 Landlord-Friendly
- State Michigan
- 62 Landlord-Friendly · EVEN
- County
- — inherits STATE
- City
- — inherits STATE
ZIP-level market 48135
- Rents YoY
- 3.6%
- Active inventory
- 134
- Price-to-rent
- 6.8×
Monthly cashflow live
- Estimated rent
- $1,660 high interval (Pro) →
- Mortgage (P&I)
- −$708
- Tax from tax record
- −$302 /mo · $3,618/yr
- Insurance
- −$56
- HOA
- −$0
- Vacancy / Maint / Mgmt
- −$349
- Net cashflow
- $246
Break-even live
UW: 25.0% down · 7.5% · 30yr · 1.5% tax · 5.0% vac · 8.0% maint · 8.0% mgmt
Financing live
Cash to close
- Down payment
- $33,750
- Closing costs
- $4,050
- Reserves months
- —
- Total cash needed
- —
Loan-product check · same deal, 3 products live
Conventional
25% down · 7.5% · 30yr
- Down + closing
- —
- Monthly P&I
- —
- Monthly cashflow
- —
- DSCR
- —
- Eligible?
- —
Personal DTI + credit; lowest rate.
DSCR
20% down · 8.5% · 30yr
- Down + closing
- —
- Monthly P&I
- —
- Monthly cashflow
- —
- DSCR
- —
- Eligible?
- —
No personal income docs; deal must DSCR.
Hard money
10% down · 12.0% · 12mo
- Down + closing
- —
- Monthly P&I
- —
- Monthly cashflow
- —
- DSCR
- —
- Eligible?
- —
Short-term bridge; refi at stabilization.
Rent comps 11 comps
| Address | Beds | Baths | Sqft | Rent | $/sqft | DOM | Units | Dist |
|---|---|---|---|---|---|---|---|---|
| 5927 Lathers St Garden City, MI | 3.0 | 1.0 | 1000 | $1,600 | $1.60 | 2d | 1 | 0.34mi |
| 5839 Helen St Garden City, MI | 3.0 | 1.0 | 984 | $1,500 | $1.52 | 24d | 1 | 0.46mi |
| 7048 Deering St Garden City, MI | 3.0 | 1.0 | 910 | $1,500 | $1.65 | 17d | 1 | 0.95mi |
| 7457 Harrison St Westland, MI | 3.0 | 1.0 | 1120 | $1,900 | $1.70 | 2d | 1 | 1.03mi |
| 7435 Lathers St Westland, MI | 3.0 | 1.0 | 1120 | $1,900 | $1.70 | 17d | 1 | 1.03mi |
| 536 N Leona Ave Garden City, MI | 3.0 | 1.0 | 1000 | $1,440 | $1.44 | 13d | 1 | 1.04mi |
| 7484 Affeldt St Westland, MI | 3.0 | 1.0 | 1120 | $1,500 | $1.34 | 24d | 1 | 1.04mi |
| 6954 Inkster Rd Dearborn Heights, MI | 1.0–2.0 | 1.0–1.5 | 837 | $1,339 | $1.60 | 3d | 9 | 1.05mi |
| 30500 Warren Rd Westland, MI | 2.0 | 1.0 | 900 | $1,128 | $1.25 | 44d | 1 | 1.23mi |
| 238 Yorkshire Blvd Dearborn Heights, MI | 1.0–2.0 | 1.0 | 741 | $1,424 | $1.92 | 2d | 9 | 1.41mi |
| 130 E Tami Cir Westland, MI | 1.0–2.0 | 1.0–1.5 | 800 | $1,209 | $1.51 | 44d | 3 | 1.45mi |
Listing history 50 events
-
2026-06-18price $135,000 Active 31 DOM
-
2026-06-18days on market $140,000 Active 31 DOM
-
2026-06-17days on market $140,000 Active 30 DOM
-
2026-06-16days on market $140,000 Active 29 DOM
-
2026-06-15days on market $140,000 Active 28 DOM
-
2026-06-13days on market $140,000 Active 26 DOM
-
2026-06-13days on market $140,000 Active 25 DOM
-
2026-06-09days on market $140,000 Active 22 DOM
-
2026-06-08days on market $140,000 Active 21 DOM
-
2026-06-07days on market $140,000 Active 20 DOM
-
2026-06-04days on market $140,000 Active 17 DOM
-
2026-06-03days on market $140,000 Active 16 DOM
-
2026-06-02days on market $140,000 Active 15 DOM
-
2026-06-01days on market $140,000 Active 14 DOM
-
2026-05-31days on market $140,000 Active 13 DOM
-
2026-05-15$150,000 Active
Show marketing remark (1248 chars)
Welcome to 28984 Beechwood Street in Garden City - a place that instantly feels like home. This beautifully remodeled three-bedroom ranch combines warmth, comfort, and modern updates to create the perfect space for life's everyday moments. Renovated in 2021, every detail was thoughtfully designed to make this home both inviting and functional. Step inside to a bright and spacious living room filled with natural light, creating the perfect atmosphere for cozy movie nights, holiday gatherings, or simply relaxing after a long day. The dining area flows seamlessly into the updated kitchen, making it easy to stay connected while cooking, entertaining, or sharing meals with the people who matter most. With three comfortable bedrooms, a convenient laundry room, and a layout designed for easy living, this home offers the perfect balance of charm and practicality. Outside, you'll love being just minutes from local restaurants, shopping, parks, and everything you need, while still enjoying the comfort of a quiet neighborhood setting. Whether you're buying your very first home, starting a new chapter, or looking for a fresh beginning, 28984 Beechwood Street is more than just a house - it's a place where memories are waiting to be made.
-
2026-05-15$150,000 Active 1248-char remark
Show marketing remark (1248 chars)
Welcome to 28984 Beechwood Street in Garden City - a place that instantly feels like home. This beautifully remodeled three-bedroom ranch combines warmth, comfort, and modern updates to create the perfect space for life's everyday moments. Renovated in 2021, every detail was thoughtfully designed to make this home both inviting and functional. Step inside to a bright and spacious living room filled with natural light, creating the perfect atmosphere for cozy movie nights, holiday gatherings, or simply relaxing after a long day. The dining area flows seamlessly into the updated kitchen, making it easy to stay connected while cooking, entertaining, or sharing meals with the people who matter most. With three comfortable bedrooms, a convenient laundry room, and a layout designed for easy living, this home offers the perfect balance of charm and practicality. Outside, you'll love being just minutes from local restaurants, shopping, parks, and everything you need, while still enjoying the comfort of a quiet neighborhood setting. Whether you're buying your very first home, starting a new chapter, or looking for a fresh beginning, 28984 Beechwood Street is more than just a house - it's a place where memories are waiting to be made.
-
2026-05-06historical
-
2026-05-06historical
-
2026-02-05$175,000 Active
-
2026-02-05$175,000 Active
-
2026-01-29historical
-
2021-09-02soldstatus $140,000 Sold
-
2021-09-02soldstatus $140,000 Closed
-
2021-09-02soldstatus $140,000
-
2021-07-16historical Accepting Backup Offers
-
2021-07-13historical
-
2021-06-07historical Accepting Backup Offers
-
2021-06-07historical Accepting Backup Offers
-
2021-05-25$139,995 Active
-
2021-05-25$139,995 Active
-
2021-04-15soldstatus $80,000
-
2021-04-05soldstatus $80,000 Sold
-
2021-04-05soldstatus $80,000 Closed
-
2021-03-19status Pending
-
2021-03-19status Pending
-
2021-03-18$75,000 Active
-
2021-03-18$75,000 Active
-
2021-03-12historical $75,000
-
2021-03-12historical $75,000
-
2011-01-13soldstatus $14,900
-
2011-01-13soldstatus $14,900
-
2010-11-26$14,900
-
2010-11-26$14,900
-
2006-02-02soldstatus $77,000
-
2005-08-22soldstatus $105,000
-
1999-05-19soldstatus $74,500
-
1999-04-27soldstatus $74,500
-
1998-10-05$76,900
-
1993-01-15soldstatus $49,300
ⓘ Source: listings_history table (triggers on properties + properties_extension) + one-shot
backfill from property_details.listing_events for pre-trigger history.
Tax reassessment forecast MI · Partial reset (capped growth)
- Current annual tax
- $3,618 · $302/mo
- Projected year-2 tax
- $3,618 · $302/mo
- Expected delta
- $0/yr ($0/mo · 0.0%)
ⓘ Screening estimate from a state-policy table — verify with the county assessor before closing.
Climate risk First Street
- Flood 1/10 Low FEMA zone X (unshaded) · 0% chance over 30 yrs
- Wildfire 1/10 Low
- Heat 3/10 Moderate 7 d/yr ≥98°F today · 15 d/yr by 30 yrs out
- Wind 2/10 Low
- Air quality 2/10 Low 1 unhealthy d/yr today · 2 by 30 yrs out
Nearby sold comps map
Loading sold comps map…
Walkable amenities ~0.75 mi
Loading nearby amenities…
Taxation est. · year 1
- Rental income
- $19,925
- − Mortgage interest
- −$7,562
- − Property taxes
- −$3,618
- − Insurance
- −$675
- − Repairs & maintenance
- −$1,594
- − Management
- −$1,594
- − Depreciation
- −$3,927
- Taxable income
- $954
- Est. tax owed @ 24.0%
- −$229
- After-tax cash flow
- $2,723/yr
For passive investors: Depreciation is non-cash, so a rental often shows a tax loss while cash-flowing — sheltering income. Rental losses are passive: they offset passive income freely, and up to $25,000/yr can offset ordinary (W-2) income if you actively participate and your MAGI is under $100k (phasing out to $0 by $150k); unused losses carry forward. On sale, claimed depreciation is recaptured at up to 25%, and gains may owe capital-gains tax (a 1031 exchange can defer both). Figures are a year-1 estimate at your 24.0% rate — not tax advice; consult a CPA.
Schools (NCES district)
- District
- Garden City Public Schools
- NCES district ID
- 2615540
- Math proficiency
- 22% ▼ -11.00%
- Reading proficiency
- 36% ▼ -13.00%
- Median HH income
- $52,165
- Composite
- 25.53/100
- National rank
- #7433
- State rank
- #365 of 540 in MI
Livability — Garden City
- Score
- 82/100
- State rank
- #53
- US rank
- #1047
Category grades
Schools grade is shown separately in the Schools card above.
Census & demographics
- Census place
- Garden City, MI
- County
- Wayne County · 1,562,939 people
- City population
- 26,739
- Metro
- Detroit-Warren-Dearborn, MI
- Population (ZIP)
- 26,739
- Household income
- $67,294
- Rent vs Own
- Severe rent burden
- 509.0
Population outlook (Wayne County) Hauer SSP2
- Today (2025)
- 1,675,273 people
- By 2030
- 1,620,300 · -3.3%
- By 2040
- 1,502,341 · -10.3%
- By 2050
- 1,384,039 · -17.4%
- By 2075
- 1,124,592 · -32.9%
- By 2100
- 881,193 · -47.4%
Race, ethnicity, and origin ACS 2023
- Neighborhood character
- Predominantly White (82%)
- Race & ethnicity
- White 82% Two or more races 8% Black 7% Hispanic / Latino 5%
- Hispanic origin (detail)
- Mexican 5%
- Common ancestry
- Romanian 13% Italian 4% Slovak 3%
- Foreign-born
- 4% · Canada
- Languages at home
- 94% English-only · Arabic 3% Spanish 1% Other Indo-European 1%
Political lean MEDSL · Wayne
- 2024 margin
- Strong D (+29.0) · D 62.7% · R 33.7% · Other 3.6%
- 2008→2024 swing
- -20.5pp toward R · 2008: 49.5pp · 2024: 29.0pp
- All cycles
- 2024: D+29.0 2020: D+38.1 2016: D+37.3 2012: D+46.9 2008: D+49.5
Not yet ingested
- Civics
- —
Market trends
- HPI YoY
- ▼ -265.28%
- Current HPI
- 212.5713
- Rent YoY
- ▲ 3.65%
- Metro
- Detroit-Warren-Dearborn, MI
- State GDP YoY
- ▲ 1.37%
- F500 in state
- 28
Industry mix (Fortune 500 HQ in MI)
| Industry | F500 HQs | Revenue |
|---|---|---|
| Automotive Parts | 3 | $48B |
|
||
| Automotive | 2 | $372B |
|
||
| Chemicals | 1 | $45B |
|
||
| Automotive Retail | 1 | $29B |
|
||
| Healthcare / Medical Devices | 1 | $23B |
|
||
| Automotive Technology | 1 | $20B |
|
||
Price history
+289.6% since first listed36 events — show timeline
- 2026-05-15 Listed $150,000 MiRealSource-MiMLS
- 2026-05-15 Listed $150,000 REALCOMP
- 2026-05-06 Listing Removed — REALCOMP
- 2026-05-06 Listing Removed — MiRealSource-MiMLS
- 2026-02-05 Listed $175,000 MiRealSource-MiMLS
- 2026-02-05 Listed $175,000 REALCOMP
- 2026-01-29 Coming Soon — MiRealSource-MiMLS
- 2021-09-02 Sold (Public Records) $140,000 Public Records
- 2021-09-02 Sold (MLS) $140,000 MiRealSource-MiMLS
- 2021-09-02 Sold (MLS) $140,000 REALCOMP
- 2021-07-16 Contingent — REALCOMP
- 2021-07-13 Listing Removed — REALCOMP
- 2021-06-07 Contingent — MiRealSource-MiMLS
- 2021-06-07 Contingent — REALCOMP
- 2021-05-25 Listed $139,995 MiRealSource-MiMLS
- 2021-05-25 Listed $139,995 REALCOMP
- 2021-04-15 Sold (Public Records) $80,000 Public Records
- 2021-04-05 Sold (MLS) $80,000 MiRealSource-MiMLS
- 2021-04-05 Sold (MLS) $80,000 REALCOMP
- 2021-03-19 Pending — MiRealSource-MiMLS
- 2021-03-19 Pending — REALCOMP
- 2021-03-18 Listed $75,000 MiRealSource-MiMLS
- 2021-03-18 Listed $75,000 REALCOMP
- 2021-03-12 Coming Soon $75,000 MiRealSource-MiMLS
- 2021-03-12 Coming Soon $75,000 REALCOMP
- 2011-01-13 Sold (MLS) $14,900 MiRealSource-MiMLS
- 2011-01-13 Sold (MLS) $14,900 REALCOMP
- 2010-11-26 Listed $14,900 MiRealSource-MiMLS
- 2010-11-26 Listed $14,900 REALCOMP
- 2006-02-02 Sold (Public Records) $77,000 Public Records
- 2005-08-22 Sold (Public Records) $105,000 Public Records
- 1999-05-19 Sold (Public Records) $74,500 Public Records
- 1999-04-27 Sold (MLS) $74,500 REALCOMP
- 1998-10-05 Listed $76,900 REALCOMP
- 1993-01-15 Sold (Public Records) $49,300 Public Records
- 1991-06-10 Sold (Public Records) $38,500 Public Records
Property tax history
+6.6%/yrLatest (2025): $3,618 · -16.8% YoY. Source: county tax records.
Cash-flow waterfall
monthlySold comps — $/sqft
last 12 mo · ≤1 miLoading sold comps…