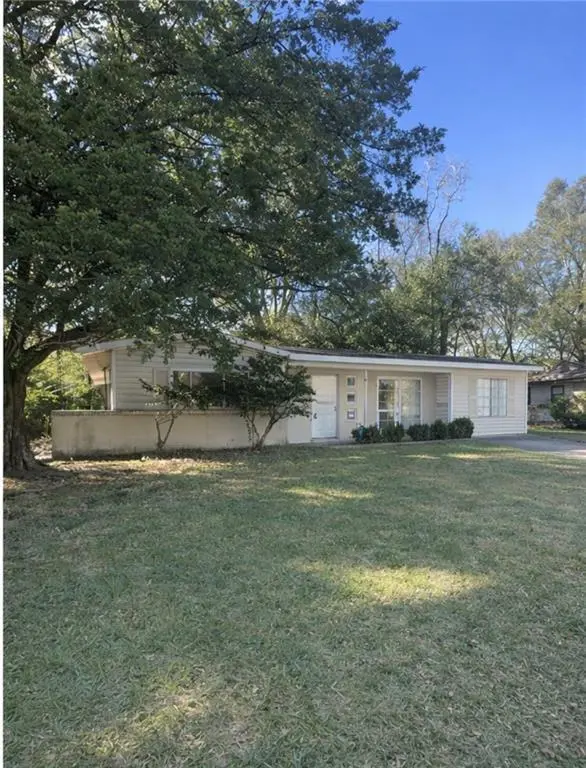
660 Halifax Dr · Mobile, AL
Flood risk 1/10 · Minimal
- FEMA flood zone
- X (unshaded)
- Chance of flooding over 30 yrs
- 0.0%
- Est. flood insurance / yr
- $507 – $1,088
Fire risk 1/10 · Minimal
- Est. fire insurance / yr
- $916 – $1,700
Heat risk 9/10 · Severe
- Hot days now (above 105°F)
- 7 days/yr
- Hot days in 30 yrs
- 19 days/yr
Wind risk 9/10 · Severe
- Chance of severe wind over 30 yrs
- 99.0%
Air-quality risk 1/10 · Minimal
- Unhealthy air days now
- 0 days/yr
- Unhealthy air days in 30 yrs
- 0 days/yr
Risk factors via First Street. Map © Google.
Why this score? — see what drove the B+ grade
The composite is a weighted blend of 9 inputs, each scored 0–100. Each bar is that input's sub-score; the figure is the points it added to the 100-point composite (weight × sub-score).
- Cash flow +30.0/30.0
- ARV discount +15.0/15.0
- DSCR +10.0/10.0
- 1% rule +8.9/10.0
- Livability +3.8/5.0
- Rent growth +3.3/5.0
- Condition / age +2.5/5.0
- Schools +2.3/10.0
- Appreciation +0.0/10.0
$99,000
🖨 Deal sheet (PDF) 📄 Offer letter ✓ Due diligence
Listing remarks MLS
Attention investors and renovators! This property is mid-renovation and ready for completion — and the big-ticket item has already been handled with a brand NEW roof recently installed. Originally purchased with plans for a full remodel and rental conversion, the owner relocated out of town, creating an opportunity for the next investor to step in and finish the project. Interior has been partially gutted, offering a clean slate for redesign and customization. With the roof already replaced, a major expense and insurance concern has been eliminated. Concrete subfloor exposed and open layout potential provide a strong foundation for your renovation vision. Ideal for: • Flip project • Buy-and-hold rental • BRRRR strategy • Portfolio addition Located in an established area with rental demand and convenient access to major roads and amenities. Property sold AS-IS. Cash or renovation financing preferred.
Key facts
- Concrete subfloor
- New roof
- 8,986 sq ft lot
Tags
Neighborhood map
What this means for you Summary
Snapshot
- This is a 3-bed/1.0-bath single-family listed at $99k.
Deal economics
- At list price, monthly cash flow is $434 ($5k/yr) — positive.
- The deal already cash-flows at list — no discount required.
- Meets the 1% rule at list price ($1k rent vs $99k).
- Recommended offer: $87k (12.0% below list) — sets the bar for market timing.
- Cap rate 11.6% vs local median 4.9% in Mobile — top-decile yield for the area; either an underpriced asset or a hidden risk that comps aren't pricing in. Stress-test before assuming the spread holds.
Location & tenants
- Location reads 75/100 on livability (#20 in AL, #4,262 nationally) — a middle-class / working-renter tenant base. Strengths: commute A+, cost of living A+, housing A+; Watch: schools D-, crime F, employment D-.
- Mobile County (urban): math 15% / reading 39% proficiency, ranked #81 of 129 in AL (top 63%) — low school quality limits family demand, transient renter base, plan for 1-2y turnover; 67% free/reduced lunch — lower-income household profile, screen leases tightly.
- Market conditions: Rents rising (+3.1%/yr); 144 active listings in the ZIP; 21 comparable units currently listed for rent nearby; rentals at typical pace (median 14d on market — plan ~3-4 weeks tenant-placement turnaround); 1,678 units permitted in Mobile County in 2024 (264 in 5+ unit buildings).
- This rent runs 33% of the median local income ($50k/yr) — at the standard rent-burdened threshold; future hikes will face affordability resistance.
Forward outlook
- Local home prices are declining (-3.0%/yr); year-one equity from $684 of loan paydown is wiped out by about $3k of value loss. Plan a longer hold.
- Mobile County population projected to shrink 8% by 2050 — rents likely to lag national; underwrite the cash flow, not the appreciation.
- At projected returns (-3.0% appreciation + 3.1% rent growth), your $28k cash investment doubles in ~7 years — after that, you're playing with house money.
Negotiation context
- It's been on market 126 days — a 12% lower offer ($87k) is reasonable based on typical stale-listing flexibility.
- Current owner paid $50k; list at $99k implies a 98% gain — meaningful room to come down on a strong offer.
Risks & watch-outs
- Climate carrying-cost: severe wind risk, 99% chance of damaging wind over 30y; extreme-heat days projected 7→19/yr by 2055 (HVAC capex compounding) — expect insurance premiums to compound above CPI over the hold.
Questions for the listing agent
- It's been on market 126 days. Have you received any prior offers? Is the seller open to a 12% concession, seller financing, or rate buy-down credit?
- Why hasn't it sold? Are there any deal-killer items the seller is aware of (foundation, flood, title, zoning, code violations)?
- Is there a deadline driving the sale (1031 exchange, divorce, estate, relocation)? That informs how much negotiation room exists.
- Schools are D-rated, which usually means shorter tenancies and higher turnover. Who's the typical renter profile here, and what's been the actual vacancy rate?
- Crime grade is F in this area — have there been break-ins, vandalism, or insurance claims at this property in the last 3 years? What carrier currently insures it and at what premium?
- What's the average days-on-market for RENTAL listings here right now (not sales)? A rising rental-DOM trend means longer vacancies and softer asking-rent achievability than the comps imply.
- What's the recent tenant-quality profile in this submarket — average credit score on applications, eviction rate, late-payment / NSF rate, and stable-employment percentage? A property-management company in the area should have these aggregated.
- How much new for-sale + rental construction is in the pipeline within 1–3 miles? Heavy new supply typically softens prices + rents 12–24 months out; constrained supply supports both.
Investment metrics
- 1% rule
- 1.39% ✓
- Cap rate
- 11.56%
- Cash-on-cash
- 18.80%
- DSCR
- 1.84
- GRM
- 6.0
CMA / ARV
- ARV (median comp)
- $162,915
- List price
- $99,000
- Delta
- -39.23%
- Verdict
- UNDERPRICED
- Comps
- 20 within 1.0 mi
Show comp detail 12 sales within ~0.75 mi
| Address | Dist | Beds/Ba | Sqft | Sold | Price | $/sf | Match |
|---|---|---|---|---|---|---|---|
| 4077 Lancewood Dr S | 0.09mi | 4/1.0 (+1) | 1,284 (+5%) | 2mo | $125,000 | $97 | 82 |
| 705 Littledale Rd | 0.20mi | 3/2.0 | 1,189 (-3%) | 1mo | $160,000 | $135 | 81 |
| 661 Raines Dr | 0.24mi | 3/1.5 | 1,134 (-8%) | 1mo | $122,000 | $108 | 73 |
| 552 Tamworth Ct | 0.33mi | 3/1.0 | 1,135 (-8%) | 3mo | $159,500 | $141 | 70 |
| 713 Raines Dr | 0.29mi | 3/1.0 | 1,347 (+10%) | 2mo | $73,000 | $54 | 69 |
| 4275 Raines Dr | 0.43mi | 3/1.0 | 1,107 (-10%) | 2mo | $172,000 | $155 | 62 |
| 1618 Catalina Dr | 0.63mi | 3/1.5 | 1,196 (-2%) | 3mo | $120,000 | $100 | 62 |
| 4057 Gaylark Rd N | 0.36mi | 3/1.0 | 1,080 (-12%) | 2mo | $140,000 | $130 | 62 |
| 4017 Meadow Wood Curv | 0.38mi | 3/1.0 | 1,080 (-12%) | 3mo | $139,900 | $130 | 60 |
| 4259 Raines Dr | 0.38mi | 3/1.5 | 1,394 (+14%) | 1mo | $184,000 | $132 | 57 |
| 717 Kasserine Pass | 0.61mi | 3/1.5 | 1,377 (+12%) | 1mo | $178,000 | $129 | 48 |
| 4129 Springdale Rd | 0.75mi | 2/1.0 (-1) | 1,044 (-15%) | 1mo | $139,000 | $133 | 34 |
Match score weights: distance 35% · size 25% · config 20% · recency 20%. Top-matched comps best support the ARV.
Projected returns pro-forma
-3.0% appreciation · 3.07% rent growth · sell at horizon
- IRR
- 10.7%
- Equity multiple
- 1.42×
- Total profit
- $11,717
- Equity at exit
- $14,761
- IRR
- 19.8%
- Equity multiple
- 2.67×
- Total profit
- $46,230
- Equity at exit
- $8,560
Cash invested: $27,720 (down + closing). Projections, not guarantees.
Landlord ↔ Tenant lean methodology
- Overall (STATE)
- 90 Strongly Landlord-Friendly
- State Alabama
- 90 Strongly Landlord-Friendly · R+15
- County
- — inherits STATE
- City
- — inherits STATE
ZIP-level market 36609
- Rents YoY
- 3.1%
- Active inventory
- 144
- Price-to-rent
- 6.0×
Monthly cashflow live
- Estimated rent
- $1,379 high interval (Pro) →
- Mortgage (P&I)
- −$519
- Tax from tax record
- −$95 /mo · $1,139/yr
- Insurance
- −$41
- HOA
- −$0
- Vacancy / Maint / Mgmt
- −$290
- Net cashflow
- $434
Break-even live
Sensitivity live
| Price | -10% $490 | -5% $462 | +0% $434 | +5% $406 | +10% $378 |
|---|---|---|---|---|---|
| Rent | -10% $325 | -5% $380 | +0% $434 | +5% $489 | +10% $543 |
| Rate | -1.0pp $484 | -0.5pp $459 | base $434 | +0.5pp $409 | +1.0pp $383 |
UW: 25.0% down · 7.5% · 30yr · 1.5% tax · 5.0% vac · 8.0% maint · 8.0% mgmt
Financing live
Cash to close
- Down payment
- $24,750
- Closing costs
- $2,970
- Reserves months
- —
- Total cash needed
- —
Loan-product check · same deal, 3 products live
Conventional
25% down · 7.5% · 30yr
- Down + closing
- —
- Monthly P&I
- —
- Monthly cashflow
- —
- DSCR
- —
- Eligible?
- —
Personal DTI + credit; lowest rate.
DSCR
20% down · 8.5% · 30yr
- Down + closing
- —
- Monthly P&I
- —
- Monthly cashflow
- —
- DSCR
- —
- Eligible?
- —
No personal income docs; deal must DSCR.
Hard money
10% down · 12.0% · 12mo
- Down + closing
- —
- Monthly P&I
- —
- Monthly cashflow
- —
- DSCR
- —
- Eligible?
- —
Short-term bridge; refi at stabilization.
Rent comps 21 comps
| Address | Beds | Baths | Sqft | Rent | $/sqft | DOM | Units | Dist |
|---|---|---|---|---|---|---|---|---|
| 4077 Lancewood Dr S Mobile, AL | 4.0 | 1.0 | 1283 | $1,600 | $1.25 | 44d | 1 | 0.06mi |
| 654 Ynestra Dr Mobile, AL | 3.0 | 1.5 | 1134 | $1,300 | $1.15 | 14d | 1 | 0.10mi |
| 4213 Malibar Dr Mobile, AL | 3.0 | 1.0 | 1100 | $1,458 | $1.33 | 21d | 1 | 0.19mi |
| 4161 Rebecca Rd Mobile, AL | 3.0 | 1.0 | 1214 | $1,500 | $1.24 | 14d | 1 | 0.23mi |
| 4242 Marmora Dr Mobile, AL | 3.0 | 1.5 | 1053 | $1,500 | $1.42 | 44d | 1 | 0.30mi |
| 552 Tamworth Ct Mobile, AL | 3.0 | 1.0 | 1100 | $1,450 | $1.32 | 44d | 1 | 0.33mi |
| 550 Tamworth Ct Mobile, AL | 3.0 | 1.0 | 1000 | $1,295 | $1.29 | 44d | 1 | 0.34mi |
| 4057 Gaylark Rd N Mobile, AL | 3.0 | 1.0 | 1080 | $1,275 | $1.18 | 21d | 1 | 0.40mi |
| 5155 Ridgedale Rd Mobile, AL | 3.0 | 1.5 | 1263 | $1,400 | $1.11 | 14d | 1 | 0.50mi |
| 4118 Seabreeze Rd N Mobile, AL | 3.0 | 1.0 | 1088 | $1,100 | $1.01 | 44d | 1 | 0.60mi |
| 651 Azalea Rd Mobile, AL | 2.0–3.0 | 1.0–1.5 | 890 | $1,232 | $1.38 | 44d | 1 | 0.81mi |
| 3993 Cottage Hill Rd Mobile, AL | 2.0 | 1.5 | 1150 | $895 | $0.78 | 44d | 1 | 0.82mi |
| 833 S University Blvd Mobile, AL | 1.0–2.0 | 1.0–2.0 | 855 | $1,190 | $1.39 | 14d | 12 | 0.82mi |
| 506 Seville Dr Mobile, AL | 3.0 | 1.5 | 1200 | $1,350 | $1.12 | 14d | 1 | 0.90mi |
| 561 Village Green Dr E Mobile, AL | 2.0 | 1.0 | 880 | $1,000 | $1.14 | 14d | 4 | 0.99mi |
| 701 S University Blvd Mobile, AL | 2.0 | 1.0 | 692 | $1,093 | $1.58 | 21d | 10 | 1.06mi |
| 900 Downtowner Blvd Mobile, AL | 1.0–3.0 | 1.0–2.5 | 1029 | $1,449 | $1.41 | 14d | 32 | 1.17mi |
| 3800 Michael Blvd Mobile, AL | 1.0–2.0 | 1.0–2.0 | 854 | $942 | $1.10 | 14d | 15 | 1.30mi |
| 1651 Knollwood Dr Mobile, AL | 1.0–2.0 | 1.0–2.0 | 835 | $1,247 | $1.49 | 14d | 16 | 1.33mi |
| 5900 Grelot Rd Mobile, AL | 2.0 | 2.0–2.5 | 1259 | $1,600 | $1.27 | 14d | 2 | 1.44mi |
| 3600 Michael Blvd Mobile, AL | 2.0 | 1.5 | 750 | $949 | $1.27 | 14d | 3 | 1.45mi |
Listing history 20 events
-
2026-06-18days on market $99,000 Active 126 DOM
-
2026-06-17days on market $99,000 Active 125 DOM
-
2026-06-16days on market $99,000 Active 124 DOM
-
2026-06-15days on market $99,000 Active 123 DOM
-
2026-06-14days on market $99,000 Active 121 DOM
-
2026-06-13days on market $99,000 Active 120 DOM
-
2026-06-10days on market $99,000 Active 118 DOM
-
2026-06-09days on market $99,000 Active 117 DOM
-
2026-06-08days on market $99,000 Active 116 DOM
-
2026-06-07remarks 693-char remark
-
2026-06-07pricedays on market $99,000 Active 115 DOM
-
2026-06-05days on market $115,000 Active 112 DOM
-
2026-06-03days on market $115,000 Active 111 DOM
-
2026-06-02days on market $115,000 Active 110 DOM
-
2026-06-01days on market $115,000 Active 109 DOM
-
2026-05-31days on market $115,000 Active 108 DOM
-
2026-05-30days on market $115,000 Active 107 DOM
-
2026-04-07price $115,000 949-char remark
Show marketing remark (949 chars)
Attention investors and renovators! This property is mid-renovation and ready for completion — and the big-ticket item has already been handled with a brand NEW roof recently installed. Originally purchased with plans for a full remodel and rental conversion, the owner relocated out of town, creating an opportunity for the next investor to step in and finish the project. Interior has been partially gutted, offering a clean slate for redesign and customization. With the roof already replaced, a major expense and insurance concern has been eliminated. Concrete subfloor exposed and open layout potential provide a strong foundation for your renovation vision. Ideal for: • Flip project • Buy-and-hold rental • BRRRR strategy • Portfolio addition Located in an established area with rental demand and convenient access to major roads and amenities. Property sold AS-IS. Cash or renovation financing preferred.
-
2026-02-12$129,000 Active 949-char remark
Show marketing remark (949 chars)
Attention investors and renovators! This property is mid-renovation and ready for completion — and the big-ticket item has already been handled with a brand NEW roof recently installed. Originally purchased with plans for a full remodel and rental conversion, the owner relocated out of town, creating an opportunity for the next investor to step in and finish the project. Interior has been partially gutted, offering a clean slate for redesign and customization. With the roof already replaced, a major expense and insurance concern has been eliminated. Concrete subfloor exposed and open layout potential provide a strong foundation for your renovation vision. Ideal for: • Flip project • Buy-and-hold rental • BRRRR strategy • Portfolio addition Located in an established area with rental demand and convenient access to major roads and amenities. Property sold AS-IS. Cash or renovation financing preferred.
-
2024-04-19soldstatus $50,000
ⓘ Source: listings_history table (triggers on properties + properties_extension) + one-shot
backfill from property_details.listing_events for pre-trigger history.
Tax reassessment forecast AL · Resets to sale price
- Current annual tax
- $1,139 · $95/mo
- Projected year-2 tax
- $1,139 · $95/mo
- Expected delta
- $0/yr ($0/mo · 0.0%)
ⓘ Screening estimate from a state-policy table — verify with the county assessor before closing.
Climate risk First Street
- Flood 1/10 Low FEMA zone X (unshaded) · 0% chance over 30 yrs
- Wildfire 1/10 Low
- Heat 9/10 Extreme 7 d/yr ≥105°F today · 19 d/yr by 30 yrs out
- Wind 9/10 Extreme 99% chance of damaging wind over 30 yrs
- Air quality 1/10 Low 0 unhealthy d/yr today · 0 by 30 yrs out
Nearby sold comps map
Loading sold comps map…
Walkable amenities ~0.75 mi
Loading nearby amenities…
Taxation est. · year 1
- Rental income
- $16,551
- − Mortgage interest
- −$5,546
- − Property taxes
- −$1,139
- − Insurance
- −$495
- − Repairs & maintenance
- −$1,324
- − Management
- −$1,324
- − Depreciation
- −$2,880
- Taxable income
- $3,843
- Est. tax owed @ 24.0%
- −$922
- After-tax cash flow
- $4,289/yr
For passive investors: Depreciation is non-cash, so a rental often shows a tax loss while cash-flowing — sheltering income. Rental losses are passive: they offset passive income freely, and up to $25,000/yr can offset ordinary (W-2) income if you actively participate and your MAGI is under $100k (phasing out to $0 by $150k); unused losses carry forward. On sale, claimed depreciation is recaptured at up to 25%, and gains may owe capital-gains tax (a 1031 exchange can defer both). Figures are a year-1 estimate at your 24.0% rate — not tax advice; consult a CPA.
Schools (NCES district)
- District
- Mobile County
- NCES district ID
- 0102370
- Math proficiency
- 15% ▼ -28.00%
- Reading proficiency
- 39% ▬ 0.00%
- Median HH income
- $42,455
- Composite
- 22.9/100
- National rank
- #8002
- State rank
- #81 of 129 in AL
Livability — Mobile
- Score
- 75/100
- State rank
- #20
- US rank
- #4262
Category grades
Schools grade is shown separately in the Schools card above.
Census & demographics
- Census place
- Mobile, AL
- County
- Mobile County · 246,577 people
- City population
- 205,729
- Metro
- Mobile, AL
- Population (ZIP)
- 23,820
- Household income
- $49,830
- Rent vs Own
- Severe rent burden
- 1379.0
Population outlook (Mobile County) Hauer SSP2
- Today (2025)
- 415,303 people
- By 2030
- 411,755 · -0.9%
- By 2040
- 399,670 · -3.8%
- By 2050
- 382,616 · -7.9%
- By 2075
- 337,353 · -18.8%
- By 2100
- 283,391 · -31.8%
Race, ethnicity, and origin ACS 2023
- Neighborhood character
- Diverse neighborhood (Simpson 0.62)
- Race & ethnicity
- Black 44% White 42% Two or more races 6% Hispanic / Latino 5% Asian 5%
- Common ancestry
- Lithuanian 3% Slovak 2% Italian 2%
- Foreign-born
- 6% · Canada, Vietnam, China
- Languages at home
- 93% English-only · Spanish 2% Vietnamese 2% Other Indo-European 1%
Political lean MEDSL · Mobile
- 2024 margin
- R (+16.4) · D 41.3% · R 57.7%
- 2008→2024 swing
- -7.7pp toward R · 2008: -8.7pp · 2024: -16.4pp
- All cycles
- 2024: R+16.4 2020: R+11.9 2016: R+13.9 2012: R+9.3 2008: R+8.7
Not yet ingested
- Civics
- —
Market trends
- HPI YoY
- ▼ -124.06%
- Current HPI
- 200.0811
- Rent YoY
- ▲ 3.07%
- Metro
- Mobile, AL
- State GDP YoY
- ▲ 2.94%
- F500 in state
- 4
Industry mix (Fortune 500 HQ in AL)
| Industry | F500 HQs | Revenue |
|---|---|---|
| Financial Services | 1 | $8B |
|
||
| Healthcare | 1 | $5B |
|
||
Price history
+130.0% since first listed3 events — show timeline
- 2026-04-07 Price Changed $115,000 GCMLS AL
- 2026-02-12 Listed $129,000 GCMLS AL
- 2024-04-19 Sold (Public Records) $50,000 Public Records
Property tax history
+3.1%/yrLatest (2025): $1,139 · +6.9% YoY. Source: county tax records.
Cash-flow waterfall
monthlySold comps — $/sqft
last 12 mo · ≤1 miLoading sold comps…