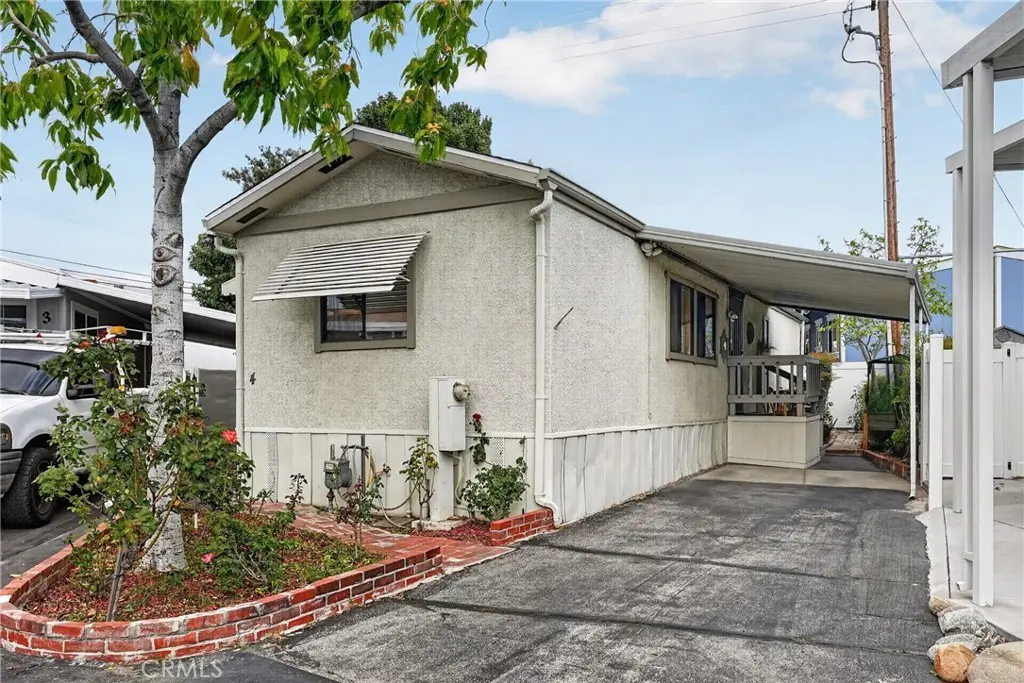
21310 E Covina Blvd #4 · Charter Oak, CA
Flood risk 1/10 · Minimal
- FEMA flood zone
- X (unshaded)
- Chance of flooding over 30 yrs
- 0.0%
- Est. flood insurance / yr
- $507 – $1,088
Fire risk 7/10 · Major
- Est. fire insurance / yr
- $659 – $1,223
Heat risk 7/10 · Major
- Hot days now (above 99°F)
- 7 days/yr
- Hot days in 30 yrs
- 20 days/yr
Wind risk 1/10 · Minimal
- Chance of severe wind over 30 yrs
- —
Air-quality risk 8/10 · Major
- Unhealthy air days now
- 17 days/yr
- Unhealthy air days in 30 yrs
- 21 days/yr
Risk factors via First Street. Map © Google.
Why this score? — see what drove the B grade
The composite is a weighted blend of 9 inputs, each scored 0–100. Each bar is that input's sub-score; the figure is the points it added to the 100-point composite (weight × sub-score).
- Cash flow +30.0/30.0
- 1% rule +10.0/10.0
- DSCR +10.0/10.0
- ARV discount +7.5/15.0
- Schools +4.7/10.0
- Condition / age +3.8/5.0
- Livability +3.2/5.0
- Rent growth +2.5/5.0
- Appreciation +0.0/10.0
$159,000
🖨 Deal sheet (PDF) 📄 Offer letter ✓ Due diligence
Listing remarks
Charming 1981 Mobile Home – Affordable, Comfortable & Move-In Ready! Located in a small and quaint Manufactured Home community on the Covina and San Dimas border. Rancho San Jose is an All Age Community. Step into this well-maintained and fully furnished 1981 mobile home offering affordable living with plenty of charm and potential. Featuring a comfortable living space, this home is perfect for first-time buyers, downsizers, or anyone looking for budget-friendly homeownership. Enjoy a bright kitchen with ample cabinet space, and cozy bedrooms. Outside, you’ll find covered parking, storage space, and a low-maintenance yard ideal for relaxing or entertaining. Conveniently
Key facts
- Bright kitchen
- Covered parking
- Low maintenance yard
Tags
Property features AI
Finance
- Other: Access via paved city streets; directions: off of Valley Center Ave
- Financial info: Monthly land lease payment required
- HOA & community: Park name: Rancho San Jose; Manager approval required; Pets allowed; Gutters and street lighting in community; Monthly land lease through park
Exterior
- Parking: Carport (1 space)
- Utilities: Public sewer; District/public water; Natural gas connected; Electricity connected; Telephone in street; Cable available
- Home design: Single-story; Front door entry; Mobile home remains on site (14' x 48', model 00762482B03)
- Construction: One total story; Year built per public records
- Exterior features: Awning; Covered front porch; Covered patio; Shed; Community pool
Interior
- Kitchen: Garbage disposal; Microwave; Refrigerator; Freestanding gas range; Dishwasher
- Bedrooms: All bedrooms on ground level
- Flooring: Vinyl; Carpet
- Bathrooms: One 3/4 bathroom
- Heating & cooling: Forced air heating; Central cooling
- Interior features: Furnished; Ceiling fan; Drapes/curtains and blinds; Community spa
- Laundry & utility: Washer included; Dryer included; Laundry room
Neighborhood map
What this means for you Summary
Snapshot
- This is a 2-bed/1.0-bath manufactured listed at $159k. Condition is rated good.
Deal economics
- At list price, monthly cash flow is $847 ($10k/yr) — positive.
- The deal already cash-flows at list — no discount required.
- Meets the 1% rule at list price ($2k rent vs $159k).
- Recommended offer: $157k (1.5% below list) — sets the bar for market timing.
- Cap rate 12.7% vs local median 3.0% in Charter Oak — top-decile yield for the area; either an underpriced asset or a hidden risk that comps aren't pricing in. Stress-test before assuming the spread holds.
Location & tenants
- Location reads 63/100 on livability (#452 in CA) — a middle-class / working-renter tenant base. Strengths: schools A+, commute A, employment B; Watch: crime D+, amenities F, cost of living F.
- Charter Oak Unified (suburban): math 45% / reading 55% proficiency, ranked #387 of 1,400 in CA (top 28%) — acceptable for families but not a draw, mixed tenant base, ~2y average lease.
- Market conditions: 65 active listings in the ZIP; 4 comparable units currently listed for rent nearby; rentals lingering (median 45d on market — plan ~5-8 weeks vacancy on turnover, expect pricing pressure); 50% of comp listings sitting > 30 days — soft ceiling on asking rent; solid renter incomes; 19,697 units permitted in Los Angeles County in 2024 (9,426 in 5+ unit buildings).
Forward outlook
- Local home prices are declining (-3.0%/yr); year-one equity from $1k of loan paydown is wiped out by about $5k of value loss. Plan a longer hold.
- Los Angeles County population projected at +9% by 2050 — modest demand growth; plan on rents tracking national, not racing it.
- At projected returns (-3.0% appreciation + 3.0% rent growth), your $45k cash investment doubles in ~6 years — after that, you're playing with house money.
Negotiation context
- It's been on market 23 days — a 2% lower offer ($157k) is reasonable based on typical stale-listing flexibility.
Risks & watch-outs
- Climate carrying-cost: major wildfire risk; extreme-heat days projected 7→20/yr by 2055 (HVAC capex compounding) — expect insurance premiums to compound above CPI over the hold.
Questions for the listing agent
- Is there a deadline driving the sale (1031 exchange, divorce, estate, relocation)? That informs how much negotiation room exists.
- Schools are A-rated — typically a magnet for longer-tenancy family renters. What's the average tenant stay here, and is there a school-zone premium baked into asking?
- Crime grade is D in this area — have there been break-ins, vandalism, or insurance claims at this property in the last 3 years? What carrier currently insures it and at what premium?
- What's the average days-on-market for RENTAL listings here right now (not sales)? A rising rental-DOM trend means longer vacancies and softer asking-rent achievability than the comps imply.
- What's the recent tenant-quality profile in this submarket — average credit score on applications, eviction rate, late-payment / NSF rate, and stable-employment percentage? A property-management company in the area should have these aggregated.
- How much new for-sale + rental construction is in the pipeline within 1–3 miles? Heavy new supply typically softens prices + rents 12–24 months out; constrained supply supports both.
Investment metrics
- 1% rule
- 1.55% ✓
- Cap rate
- 12.68%
- Cash-on-cash
- 22.82%
- DSCR
- 2.02
- GRM
- 5.4
CMA / ARV
No comps found within radius.
Projected returns pro-forma
-3.0% appreciation · 3.0% rent growth · sell at horizon
- IRR
- 15.7%
- Equity multiple
- 1.63×
- Total profit
- $28,187
- Equity at exit
- $23,707
- IRR
- 24.4%
- Equity multiple
- 3.11×
- Total profit
- $94,120
- Equity at exit
- $13,747
Cash invested: $44,520 (down + closing). Projections, not guarantees.
Landlord ↔ Tenant lean methodology
- Overall (STATE)
- 18 Strongly Tenant-Friendly
- State California
- 18 Strongly Tenant-Friendly · D+13
- County
- — inherits STATE
- City
- — inherits STATE
ZIP-level market 91724
- Active inventory
- 65
- Price-to-rent
- 5.4×
Monthly cashflow live
- Estimated rent
- $2,462 medium interval (Pro) →
- Mortgage (P&I)
- −$834
- Tax est. 1.5%
- −$199 /mo · $2,385/yr
- Insurance
- −$66
- HOA
- −$0
- Vacancy / Maint / Mgmt
- −$517
- Net cashflow
- $847
Break-even live
Sensitivity live
| Price | -10% $956 | -5% $901 | +0% $847 | +5% $792 | +10% $737 |
|---|---|---|---|---|---|
| Rent | -10% $652 | -5% $749 | +0% $847 | +5% $944 | +10% $1,041 |
| Rate | -1.0pp $927 | -0.5pp $887 | base $847 | +0.5pp $805 | +1.0pp $763 |
UW: 25.0% down · 7.5% · 30yr · 1.5% tax · 5.0% vac · 8.0% maint · 8.0% mgmt
Financing live
Cash to close
- Down payment
- $39,750
- Closing costs
- $4,770
- Reserves months
- —
- Total cash needed
- —
Loan-product check · same deal, 3 products live
Conventional
25% down · 7.5% · 30yr
- Down + closing
- —
- Monthly P&I
- —
- Monthly cashflow
- —
- DSCR
- —
- Eligible?
- —
Personal DTI + credit; lowest rate.
DSCR
20% down · 8.5% · 30yr
- Down + closing
- —
- Monthly P&I
- —
- Monthly cashflow
- —
- DSCR
- —
- Eligible?
- —
No personal income docs; deal must DSCR.
Hard money
10% down · 12.0% · 12mo
- Down + closing
- —
- Monthly P&I
- —
- Monthly cashflow
- —
- DSCR
- —
- Eligible?
- —
Short-term bridge; refi at stabilization.
Rent comps 4 comps
| Address | Beds | Baths | Sqft | Rent | $/sqft | DOM | Units | Dist |
|---|---|---|---|---|---|---|---|---|
| 220 N Valley Center Ave San Dimas, CA | 1.0 | 1.0 | 450 | $1,695 | $3.77 | 23d | 1 | 0.43mi |
| 21042 E Arrow Hwy Covina, CA | 1.0–2.0 | 1.0–2.0 | 803 | $2,875 | $3.58 | 0d | 9 | 0.56mi |
| 711 Claraday St Unit A Glendora, CA | 2.0 | 1.0 | 750 | $2,250 | $3.00 | 45d | 1 | 0.87mi |
| 217 Danecroft Ave Unit A San Dimas, CA | 2.0 | 1.0 | 735 | $2,800 | $3.81 | 45d | 1 | 0.91mi |
Listing history 15 events
-
2026-06-21days on market $159,000 Active 23 DOM
-
2026-06-18days on market $159,000 Active 20 DOM
-
2026-06-17days on market $159,000 Active 19 DOM
-
2026-06-16days on market $159,000 Active 18 DOM
-
2026-06-15days on market $159,000 Active 17 DOM
-
2026-06-13days on market $159,000 Active 15 DOM
-
2026-06-13days on market $159,000 Active 14 DOM
-
2026-06-09days on market $159,000 Active 11 DOM
-
2026-06-08days on market $159,000 Active 10 DOM
-
2026-06-07days on market $159,000 Active 9 DOM
-
2026-06-04days on market $159,000 Active 6 DOM
-
2026-06-03days on market $159,000 Active 5 DOM
-
2026-06-02days on market $159,000 Active 4 DOM
-
2026-06-01days on market $159,000 Active 3 DOM
-
2026-05-31days on market $159,000 Active 2 DOM
ⓘ Source: listings_history table (triggers on properties + properties_extension) + one-shot
backfill from property_details.listing_events for pre-trigger history.
Climate risk First Street
- Flood 1/10 Low FEMA zone X (unshaded) · 0% chance over 30 yrs
- Wildfire 7/10 Severe
- Heat 7/10 Severe 7 d/yr ≥99°F today · 20 d/yr by 30 yrs out
- Wind 1/10 Low
- Air quality 8/10 Severe 17 unhealthy d/yr today · 21 by 30 yrs out
Nearby sold comps map
Loading sold comps map…
Walkable amenities ~0.75 mi
Loading nearby amenities…
Taxation est. · year 1
- Rental income
- $29,549
- − Mortgage interest
- −$8,906
- − Property taxes
- −$2,385
- − Insurance
- −$795
- − Repairs & maintenance
- −$2,364
- − Management
- −$2,364
- − Depreciation
- −$4,625
- Taxable income
- $8,109
- Est. tax owed @ 24.0%
- −$1,946
- After-tax cash flow
- $8,212/yr
For passive investors: Depreciation is non-cash, so a rental often shows a tax loss while cash-flowing — sheltering income. Rental losses are passive: they offset passive income freely, and up to $25,000/yr can offset ordinary (W-2) income if you actively participate and your MAGI is under $100k (phasing out to $0 by $150k); unused losses carry forward. On sale, claimed depreciation is recaptured at up to 25%, and gains may owe capital-gains tax (a 1031 exchange can defer both). Figures are a year-1 estimate at your 24.0% rate — not tax advice; consult a CPA.
Condition & rehab AI · 12 photos
This charming 1981 mobile home is move-in ready with good condition and potential for updates to increase its value.
Value-add opportunities
- Both paint exterior — enhances curb appeal and resale value
- Both replace ceiling fan — improves air circulation and aesthetics
- Resale update kitchen cabinets — modernizes kitchen and adds value
- Resale update bathroom fixtures — modernizes bathroom and adds value
Renovation cost estimate screening
Value-add ROI direction
- Both paint exterior — enhances curb appeal and resale value ↑
- Both replace ceiling fan — improves air circulation and aesthetics ↑
- Resale update kitchen cabinets — modernizes kitchen and adds value ↑
- Resale update bathroom fixtures — modernizes bathroom and adds value ↑
ⓘ Cost ranges are severity-bucket heuristics (US national rule-of-thumb). Get contractor quotes + a written scope before underwriting a rehab budget.
Schools (NCES district)
- District
- Charter Oak Unified
- NCES district ID
- 0608190
- Math proficiency
- 45% ▲ 2.00%
- Reading proficiency
- 55% ▲ 4.00%
- Median HH income
- $72,756
- Composite
- 46.95/100
- National rank
- #5160
- State rank
- #387 of 1400 in CA
Livability — Charter Oak
- Score
- 63/100
- State rank
- #452
- US rank
- #15268
Category grades
Schools grade is shown separately in the Schools card above.
Census & demographics
- Census place
- Charter Oak, CA
- County
- Los Angeles County · 9,444,647 people
- Metro
- Los Angeles-Long Beach-Anaheim, CA
- Population (ZIP)
- 28,352
- Household income
- $103,163
- Rent vs Own
- Severe rent burden
- 550.0
Population outlook (Los Angeles County) Hauer SSP2
- Today (2025)
- 10,940,515 people
- By 2030
- 11,256,481 · +2.9%
- By 2040
- 11,729,929 · +7.2%
- By 2050
- 11,948,407 · +9.2%
- By 2075
- 11,818,114 · +8.0%
- By 2100
- 10,842,928 · -0.9%
Race, ethnicity, and origin ACS 2023
- Neighborhood character
- Diverse neighborhood (Simpson 0.63)
- Race & ethnicity
- Hispanic / Latino 55% White 22% Two or more races 19% Asian 14% Black 5% Native American 2%
- Hispanic origin (detail)
- Mexican 44%
- Common ancestry
- Portuguese 1% Slovak 1% Iranian 1%
- Foreign-born
- 24% · Canada, China, Vietnam
- Languages at home
- 53% English-only · Spanish 33% Chinese 5% Tagalog/Filipino 3%
Political lean MEDSL · Los Angeles
- 2024 margin
- Solid D (+32.9) · D 64.8% · R 31.9% · Other 3.3%
- 2008→2024 swing
- -7.4pp toward R · 2008: 40.4pp · 2024: 32.9pp
- All cycles
- 2024: D+32.9 2020: D+44.2 2016: D+48.0 2012: D+40.0 2008: D+40.4
Not yet ingested
- Civics
- —
Market trends
- HPI YoY
- ▼ -732.51%
- Current HPI
- 370.5956
- Rent YoY
- —
- Metro
- Los Angeles-Long Beach-Anaheim, CA
- State GDP YoY
- ▲ 3.21%
- F500 in state
- 116
Industry mix (Fortune 500 HQ in CA)
| Industry | F500 HQs | Revenue |
|---|---|---|
| Technology | 27 | $1,492B |
|
||
| Financial Services | 3 | $174B |
|
||
| Retail | 3 | $44B |
|
||
| Insurance | 3 | $26B |
|
||
| Media / Entertainment | 2 | $115B |
|
||
| Pharmaceuticals / Biotech | 2 | $62B |
|
||
Price history
1 event — show timeline
- 2026-05-29 Listed $159,000 CRMLS
Property tax history
+8.0%/yrLatest (2025): $245 · +8.0% YoY. Source: county tax records.
Cash-flow waterfall
monthlySold comps — $/sqft
last 12 mo · ≤1 miLoading sold comps…