629 Larchmont Ave · Capitol Heights, MD
Flood risk 1/10 · Minimal
- FEMA flood zone
- X (unshaded)
- Chance of flooding over 30 yrs
- 0.0%
- Est. flood insurance / yr
- $473 – $860
Fire risk 1/10 · Minimal
- Est. fire insurance / yr
- $755 – $1,403
Heat risk 7/10 · Major
- Hot days now (above 103°F)
- 7 days/yr
- Hot days in 30 yrs
- 16 days/yr
Wind risk 5/10 · Moderate
- Chance of severe wind over 30 yrs
- 22.0%
Air-quality risk 4/10 · Minor
- Unhealthy air days now
- 4 days/yr
- Unhealthy air days in 30 yrs
- 5 days/yr
Risk factors via First Street. Map © Google.
Why this score? — see what drove the C+ grade
The composite is a weighted blend of 9 inputs, each scored 0–100. Each bar is that input's sub-score; the figure is the points it added to the 100-point composite (weight × sub-score).
- Cash flow +22.5/30.0
- ARV discount +15.0/15.0
- DSCR +7.2/10.0
- 1% rule +5.7/10.0
- Rent growth +4.0/5.0
- Livability +3.6/5.0
- Condition / age +2.5/5.0
- Schools +1.7/10.0
- Appreciation +0.0/10.0
$265,000
🖨 Deal sheet 📄 Offer letter ✓ Due diligence
Listing remarks MLS
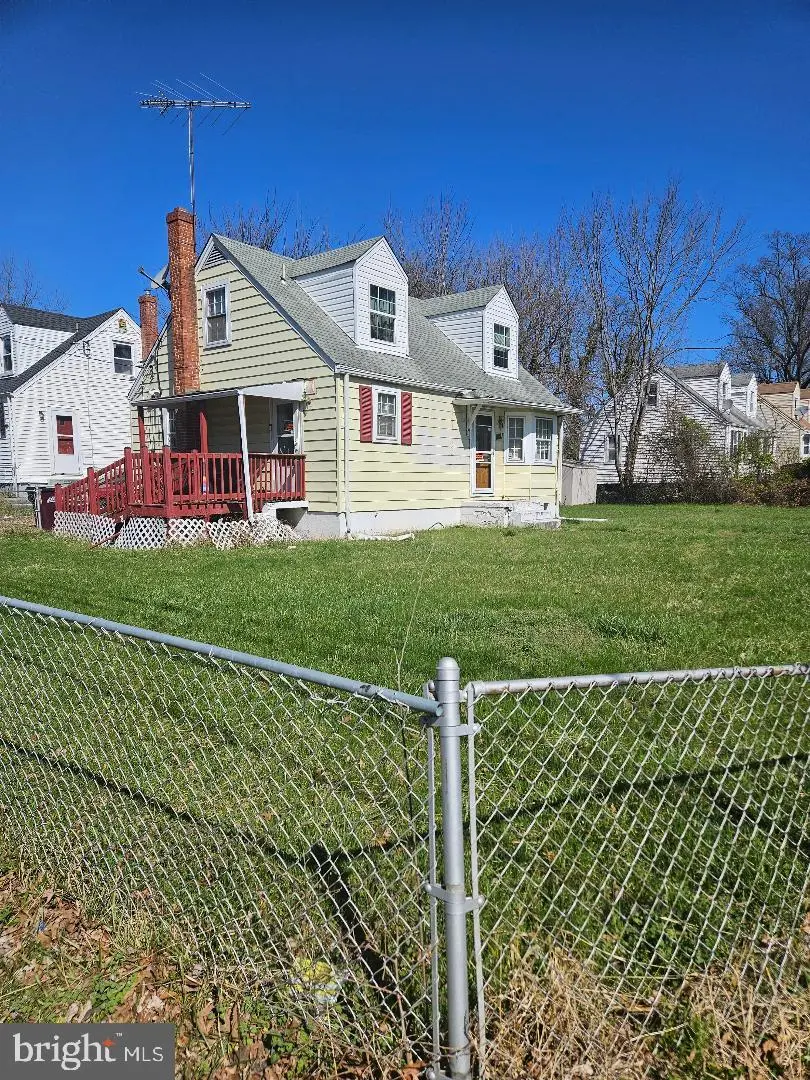
This charming Cape Cod-style home, built in 1955 with some renovated in 2020, offers a solid investment opportunity with a total finished area of 1,092 sq ft. Situated on a desirable corner lot, the property features a full basement with potential for additional living space. The exterior showcases a large corner fenced lot, complemented by ample four driveway/ off-street parking. Inside, the home boasts four bedrooms and 1.5 bathrooms, ideal for maximizing rental potential or investor to flip. The kitchen is recently upgraded with new cabinets equipped with stainless steel refrigerator, including a gas range and dishwasher, new hardwood floor in some areas, and some of the windows was recently change. Located less than a mile from public transportation options (Capitol Heights and Addison Metro station), this property is positioned for strong investor delight. With its average condition need some upgrades. , it presents a promising opportunity for investors in a growing market. Sold in As-Is condition.
Key facts
- Cape cod style home
- Full basement
- 6,098 sq ft lot
Tags
Neighborhood map
What this means for you Summary
Snapshot
- This is a 4-bed/1.0-bath single-family listed at $265k.
Deal economics
- At list price, monthly cash flow is $447 ($5k/yr) — positive.
- The deal already cash-flows at list — no discount required.
- Meets the 1% rule at list price ($3k rent vs $265k).
- Recommended offer: $249k (6.0% below list) — sets the bar for market timing.
Location & tenants
- Location reads 71/100 on livability (#155 in MD) — a middle-class / working-renter tenant base. Strengths: commute A+, housing A+, health & safety A; Watch: crime C-, schools F, amenities F.
- Prince George'S County Public Schools (suburban): math 8% / reading 24% proficiency, ranked #21 of 24 in MD (top 88%) — low school quality limits family demand, transient renter base, plan for 1-2y turnover.
- Market conditions: Rents rising fast (+5.9%/yr); 217 active listings in the ZIP; 40 comparable units currently listed for rent nearby; rentals at typical pace (median 24d on market — plan ~3-4 weeks tenant-placement turnaround); solid renter incomes; 1,481 units permitted in Prince George's County in 2024 (0 in 5+ unit buildings).
- This rent runs 45% of the median local income ($76k/yr) — at the standard rent-burdened threshold; future hikes will face affordability resistance.
Forward outlook
- Local home prices are declining (-3.0%/yr); year-one equity from $2k of loan paydown is wiped out by about $8k of value loss. Plan a longer hold.
- Prince George's County population projected at +18% by 2050 — long-run rental-demand tailwind backs the buy-and-hold thesis.
- At projected returns (-3.0% appreciation + 5.9% rent growth), your $74k cash investment doubles in ~10 years — after that, you're playing with house money.
Negotiation context
- It's been on market 63 days — a 6% lower offer ($249k) is reasonable based on typical stale-listing flexibility.
- 4 sale attempts since 23y ago with the ask held roughly flat each time — persistent listings suggest the price (not the market) is what's stuck; bring a comps-based counter.
- Current owner paid $147k; list at $265k implies a 80% gain — meaningful room to come down on a strong offer.
Risks & watch-outs
- Watch-outs: built in 1955 — expect roof / HVAC / electrical / plumbing capex.
- Climate carrying-cost: moderate wind risk, 22% chance of damaging wind over 30y; extreme-heat days projected 7→16/yr by 2055 (HVAC capex compounding) — expect insurance premiums to compound above CPI over the hold.
Questions for the listing agent
- It's been on market 63 days. Have you received any prior offers? Is the seller open to a 6% concession, seller financing, or rate buy-down credit?
- Built in 1955 — when were the roof, HVAC, electrical panel, plumbing, and water heater last replaced?
- Why hasn't it sold? Are there any deal-killer items the seller is aware of (foundation, flood, title, zoning, code violations)?
- Is there a deadline driving the sale (1031 exchange, divorce, estate, relocation)? That informs how much negotiation room exists.
- Schools are F-rated, which usually means shorter tenancies and higher turnover. Who's the typical renter profile here, and what's been the actual vacancy rate?
- What's the average days-on-market for RENTAL listings here right now (not sales)? A rising rental-DOM trend means longer vacancies and softer asking-rent achievability than the comps imply.
- What's the recent tenant-quality profile in this submarket — average credit score on applications, eviction rate, late-payment / NSF rate, and stable-employment percentage? A property-management company in the area should have these aggregated.
- How much new for-sale + rental construction is in the pipeline within 1–3 miles? Heavy new supply typically softens prices + rents 12–24 months out; constrained supply supports both.
Investment metrics
- 1% rule
- 1.07% ✓
- Cap rate
- 8.32%
- Cash-on-cash
- 7.23%
- DSCR
- 1.32
- GRM
- 7.8
CMA / ARV
- ARV (median comp)
- $363,236
- List price
- $265,000
- Delta
- -27.04%
- Verdict
- UNDERPRICED
- Comps
- 20 within 1.0 mi
Show comp detail 12 sales within ~0.75 mi
| Address | Dist | Beds/Ba | Sqft | Sold | Price | $/sf | Match |
|---|---|---|---|---|---|---|---|
| 623 Elfin Ave | 0.12mi | 3/2.0 (-1) | 1,064 (-3%) | 2mo | $320,000 | $301 | 79 |
| 5121 Cumberland St | 0.14mi | 4/2.0 | 1,080 (-1%) | 11mo | $300,000 | $278 | 78 |
| 509 Abel Ave | 0.22mi | 3/2.0 (-1) | 1,107 (+1%) | 9mo | $275,000 | $248 | 71 |
| 702 Capitol Heights Blvd | 0.21mi | 5/3.5 (+1) | 1,062 (-3%) | 2mo | $330,000 | $311 | 69 |
| 5109 Bass Pl SE | 0.60mi | 4/2.0 | 1,091 (-0%) | 4mo | $380,000 | $348 | 65 |
| 919 Mentor Ave | 0.30mi | 3/2.0 (-1) | 1,040 (-5%) | 7mo | $344,900 | $332 | 64 |
| 628 Clovis Ave | 0.14mi | 3/1.5 (-1) | 952 (-13%) | 3mo | $332,000 | $349 | 63 |
| 1009 Quietview Dr | 0.25mi | 3/1.0 (-1) | 1,191 (+9%) | 9mo | $263,700 | $221 | 61 |
| 709 Opus Ave | 0.15mi | 3/2.0 (-1) | 1,208 (+11%) | 11mo | $300,000 | $248 | 58 |
| 704 Clovis Ave | 0.16mi | 3/1.0 (-1) | 942 (-14%) | 9mo | $285,000 | $303 | 57 |
| 4807 Fable St | 0.33mi | 3/2.0 (-1) | 984 (-10%) | 8mo | $430,000 | $437 | 52 |
| 1011 Balboa | 0.56mi | 3/2.0 (-1) | 1,152 (+6%) | 6mo | $190,000 | $165 | 51 |
Match score weights: distance 35% · size 25% · config 20% · recency 20%. Top-matched comps best support the ARV.
Projected returns pro-forma
-3.0% appreciation · 5.9% rent growth · sell at horizon
- IRR
- -2.0%
- Equity multiple
- 0.92×
- Total profit
- $-5,907
- Equity at exit
- $39,512
- IRR
- 10.5%
- Equity multiple
- 1.93×
- Total profit
- $68,795
- Equity at exit
- $22,912
Cash invested: $74,200 (down + closing). Projections, not guarantees.
Landlord ↔ Tenant lean methodology
- Overall (STATE)
- 27 Tenant-Leaning
- State Maryland
- 27 Tenant-Leaning · D+14
- County
- — inherits STATE
- City
- — inherits STATE
ZIP-level market 20743
- Rents YoY
- 5.9%
- Active inventory
- 217
- Price-to-rent
- 7.8×
Monthly cashflow live
- Estimated rent
- $2,843 high interval (Pro) →
- Mortgage (P&I)
- −$1,390
- Tax from tax record
- −$299 /mo · $3,587/yr
- Insurance
- −$110
- HOA
- −$0
- Vacancy / Maint / Mgmt
- −$597
- Net cashflow
- $447
Break-even live
UW: 25.0% down · 7.5% · 30yr · 1.5% tax · 5.0% vac · 8.0% maint · 8.0% mgmt
Financing live
Cash to close
- Down payment
- $66,250
- Closing costs
- $7,950
- Reserves months
- —
- Total cash needed
- —
Loan-product check · same deal, 3 products live
Conventional
25% down · 7.5% · 30yr
- Down + closing
- —
- Monthly P&I
- —
- Monthly cashflow
- —
- DSCR
- —
- Eligible?
- —
Personal DTI + credit; lowest rate.
DSCR
20% down · 8.5% · 30yr
- Down + closing
- —
- Monthly P&I
- —
- Monthly cashflow
- —
- DSCR
- —
- Eligible?
- —
No personal income docs; deal must DSCR.
Hard money
10% down · 12.0% · 12mo
- Down + closing
- —
- Monthly P&I
- —
- Monthly cashflow
- —
- DSCR
- —
- Eligible?
- —
Short-term bridge; refi at stabilization.
Rent comps 40 comps
| Address | Beds | Baths | Sqft | Rent | $/sqft | DOM | Units | Dist |
|---|---|---|---|---|---|---|---|---|
| 5401 Call Pl SE Washington, DC | 2.0–3.0 | 1.0 | 1094 | $2,626 | $2.40 | 1d | 2 | 0.36mi |
| 5539 Central Ave SE Washington, DC | 3.0 | 2.0 | 1140 | $2,300 | $2.02 | 21d | 1 | 0.36mi |
| 22 Chamber Ave Capitol Heights, MD | 3.0 | 1.0 | 942 | $3,000 | $3.18 | 43d | 1 | 0.39mi |
| 912 Elfin Ave Capitol Heights, MD | 3.0 | 2.0 | 1028 | $2,000 | $1.95 | 43d | 1 | 0.39mi |
| 5401 Riba Ct Capitol Heights, MD | 4.0 | 3.0 | 1150 | $3,300 | $2.87 | 5d | 1 | 0.42mi |
| 5344 C St SE Unit 102 Washington, DC | 3.0 | 2.0 | 1000 | $2,499 | $2.50 | 24d | 1 | 0.44mi |
| 5344 C St SE Unit 302 Washington, DC | 3.0 | 2.0 | 1000 | $2,100 | $2.10 | 24d | 1 | 0.44mi |
| 17 Quire Ave Capitol Heights, MD | 5.0 | 2.0 | 1300 | $2,850 | $2.19 | 43d | 1 | 0.45mi |
| 416 Topeka Ave Unit A Capitol Heights, MD | 3.0 | 2.0 | 1170 | $2,800 | $2.39 | 43d | 1 | 0.52mi |
| 1205 Mentor Ave Capitol Heights, MD | 3.0 | 1.0 | 1400 | $3,000 | $2.14 | 43d | 1 | 0.52mi |
| 5119 E St SE Washington, DC | 3.0 | 1.0 | 941 | $4,000 | $4.25 | 18d | 1 | 0.55mi |
| 1111 Balboa Ave Capitol Heights, MD | 3.0 | 1.0 | 864 | $2,000 | $2.31 | 18d | 1 | 0.65mi |
| 5074 Central Ave SE Washington, DC | 4.0 | 2.0 | 1349 | $5,200 | $3.85 | 21d | 1 | 0.72mi |
| 1209 Brooke Rd Capitol Heights, MD | 3.0 | 2.0 | 1000 | $3,200 | $3.20 | 18d | 1 | 0.73mi |
| 5347 Ames St NE Washington, DC | 3.0 | 2.0 | 1428 | $3,000 | $2.10 | 24d | 1 | 0.74mi |
| 5037 Benning Rd SE Washington, DC | 3.0 | 2.0 | 1184 | $3,100 | $2.62 | 24d | 1 | 0.77mi |
| 1193 46th Pl SE Washington, DC | 3.0 | 1.0 | 1056 | $3,200 | $3.03 | 24d | 1 | 0.80mi |
| 1201 Benning Rd Capitol Heights, MD | 1.0–3.0 | 1.0 | 854 | $2,090 | $2.45 | 1d | 36 | 0.81mi |
| 4648 Hillside Rd SE Apt 1 Washington, DC | 4.0 | 2.0 | 1389 | $4,200 | $3.02 | 24d | 1 | 0.82mi |
| 4632 Hillside Rd SE Unit 1 Washington, DC | 4.0 | 2.0 | 1222 | $3,000 | $2.45 | 24d | 1 | 0.85mi |
| 4930 A St SE Unit 203 Washington, DC | 3.0 | 1.0 | 750 | $2,815 | $3.75 | 24d | 1 | 0.87mi |
| 1513 Pacific Ave Capitol Heights, MD | 3.0 | 1.0 | 1008 | $2,450 | $2.43 | 43d | 1 | 0.91mi |
| 324 61st St NE Unit 7 Washington, DC | 5.0 | 2.0 | 1250 | $7,000 | $5.60 | 24d | 1 | 0.92mi |
| 324 61st St NE Unit 4 Washington, DC | 3.0 | 1.5 | 850 | $2,800 | $3.29 | 24d | 1 | 0.92mi |
| 6340 Southern Ave NE Washington, DC | 4.0 | 2.0 | 1248 | $4,200 | $3.37 | 24d | 1 | 0.92mi |
| 5284 Marlboro Pike Capitol Heights, MD | 1.0–3.0 | 1.0–1.5 | 812 | $1,979 | $2.44 | 2d | 12 | 0.92mi |
| 44 49th St SE Unit A1 Washington, DC | 3.0 | 1.0 | 793 | $2,499 | $3.15 | 24d | 1 | 0.93mi |
| 5225 Marlboro Pike Capitol Heights, MD | 2.0–4.0 | 1.0–2.0 | 1050 | $2,400 | $2.29 | 1d | 3 | 0.94mi |
| 323 62nd St NE Washington, DC | 1.0–3.0 | 1.0–2.0 | 908 | $2,435 | $2.68 | 24d | 1 | 0.95mi |
| 337 54th St NE Unit A Washington, DC | 3.0 | 1.5 | 1184 | $2,850 | $2.41 | 24d | 1 | 0.95mi |
| 4686 A St SE Washington, DC | 4.0 | 3.0 | 1181 | $3,500 | $2.96 | 7d | 1 | 0.98mi |
| 5237 Marlboro Pike Capitol Heights, MD | 3.0 | 1.0 | 655 | $1,817 | $2.77 | 43d | 1 | 0.99mi |
| 1935 Brooks Dr Capitol Heights, MD | 1.0–3.0 | 1.0–1.5 | 865 | $1,785 | $2.06 | 1d | 9 | 1.03mi |
| 4601 Pistachio Ln Capitol Heights, MD | 3.0 | 2.5 | 1376 | $2,795 | $2.03 | 16d | 1 | 1.09mi |
| 1634 Brooksquare Dr Capitol Heights, MD | 3.0 | 1.5 | 1317 | $2,250 | $1.71 | 5d | 1 | 1.10mi |
| 4724 Blaine St NE Washington, DC | 3.0 | 2.0 | 1152 | $3,085 | $2.68 | 1d | 1 | 1.15mi |
| 505 69th St Capitol Heights, MD | 3.0 | 2.0 | 1000 | $2,500 | $2.50 | 18d | 1 | 1.16mi |
| 5811 Field Pl NE Unit 304 Washington, DC | 3.0 | 1.0 | 779 | $2,922 | $3.75 | 24d | 1 | 1.16mi |
| 4348 Southern Ave SE Washington, DC | 3.0 | 1.0 | 860 | $2,400 | $2.79 | 18d | 1 | 1.20mi |
| 608 Chaplin St SE Washington, DC | 3.0 | 2.0 | 832 | $2,200 | $2.64 | 17d | 1 | 1.20mi |
Listing history 25 events
-
2026-06-18days on market $265,000 Active 63 DOM
-
2026-06-17days on market $265,000 Active 62 DOM
-
2026-06-16days on market $265,000 Active 61 DOM
-
2026-06-15days on market $265,000 Active 60 DOM
-
2026-06-13days on market $265,000 Active 58 DOM
-
2026-06-10days on market $265,000 Active 54 DOM
-
2026-06-08days on market $265,000 Active 53 DOM
-
2026-06-07days on market $265,000 Active 52 DOM
-
2026-06-04days on market $265,000 Active 49 DOM
-
2026-06-03days on market $265,000 Active 48 DOM
-
2026-06-02days on market $265,000 Active 47 DOM
-
2026-06-01days on market $265,000 Active 46 DOM
-
2026-05-31days on market $265,000 Active 45 DOM
-
2026-05-15price $265,000 1018-char remark
Show marketing remark (1018 chars)
This charming Cape Cod-style home, built in 1955 with some renovated in 2020, offers a solid investment opportunity with a total finished area of 1,092 sq ft. Situated on a desirable corner lot, the property features a full basement with potential for additional living space. The exterior showcases a large corner fenced lot, complemented by ample four driveway/ off-street parking. Inside, the home boasts four bedrooms and 1.5 bathrooms, ideal for maximizing rental potential or investor to flip. The kitchen is recently upgraded with new cabinets equipped with stainless steel refrigerator, including a gas range and dishwasher, new hardwood floor in some areas, and some of the windows was recently change. Located less than a mile from public transportation options (Capitol Heights and Addison Metro station), this property is positioned for strong investor delight. With its average condition need some upgrades. , it presents a promising opportunity for investors in a growing market. Sold in As-Is condition.
-
2026-05-14status Active 1018-char remark
Show marketing remark (1018 chars)
This charming Cape Cod-style home, built in 1955 with some renovated in 2020, offers a solid investment opportunity with a total finished area of 1,092 sq ft. Situated on a desirable corner lot, the property features a full basement with potential for additional living space. The exterior showcases a large corner fenced lot, complemented by ample four driveway/ off-street parking. Inside, the home boasts four bedrooms and 1.5 bathrooms, ideal for maximizing rental potential or investor to flip. The kitchen is recently upgraded with new cabinets equipped with stainless steel refrigerator, including a gas range and dishwasher, new hardwood floor in some areas, and some of the windows was recently change. Located less than a mile from public transportation options (Capitol Heights and Addison Metro station), this property is positioned for strong investor delight. With its average condition need some upgrades. , it presents a promising opportunity for investors in a growing market. Sold in As-Is condition.
-
2026-05-03status Pending 1018-char remark
Show marketing remark (1018 chars)
This charming Cape Cod-style home, built in 1955 with some renovated in 2020, offers a solid investment opportunity with a total finished area of 1,092 sq ft. Situated on a desirable corner lot, the property features a full basement with potential for additional living space. The exterior showcases a large corner fenced lot, complemented by ample four driveway/ off-street parking. Inside, the home boasts four bedrooms and 1.5 bathrooms, ideal for maximizing rental potential or investor to flip. The kitchen is recently upgraded with new cabinets equipped with stainless steel refrigerator, including a gas range and dishwasher, new hardwood floor in some areas, and some of the windows was recently change. Located less than a mile from public transportation options (Capitol Heights and Addison Metro station), this property is positioned for strong investor delight. With its average condition need some upgrades. , it presents a promising opportunity for investors in a growing market. Sold in As-Is condition.
-
2026-04-20status Active 1018-char remark
Show marketing remark (1018 chars)
This charming Cape Cod-style home, built in 1955 with some renovated in 2020, offers a solid investment opportunity with a total finished area of 1,092 sq ft. Situated on a desirable corner lot, the property features a full basement with potential for additional living space. The exterior showcases a large corner fenced lot, complemented by ample four driveway/ off-street parking. Inside, the home boasts four bedrooms and 1.5 bathrooms, ideal for maximizing rental potential or investor to flip. The kitchen is recently upgraded with new cabinets equipped with stainless steel refrigerator, including a gas range and dishwasher, new hardwood floor in some areas, and some of the windows was recently change. Located less than a mile from public transportation options (Capitol Heights and Addison Metro station), this property is positioned for strong investor delight. With its average condition need some upgrades. , it presents a promising opportunity for investors in a growing market. Sold in As-Is condition.
-
2026-04-06historical 1018-char remark
Show marketing remark (1018 chars)
This charming Cape Cod-style home, built in 1955 with some renovated in 2020, offers a solid investment opportunity with a total finished area of 1,092 sq ft. Situated on a desirable corner lot, the property features a full basement with potential for additional living space. The exterior showcases a large corner fenced lot, complemented by ample four driveway/ off-street parking. Inside, the home boasts four bedrooms and 1.5 bathrooms, ideal for maximizing rental potential or investor to flip. The kitchen is recently upgraded with new cabinets equipped with stainless steel refrigerator, including a gas range and dishwasher, new hardwood floor in some areas, and some of the windows was recently change. Located less than a mile from public transportation options (Capitol Heights and Addison Metro station), this property is positioned for strong investor delight. With its average condition need some upgrades. , it presents a promising opportunity for investors in a growing market. Sold in As-Is condition.
-
2026-03-22$270,000 Active 1018-char remark
Show marketing remark (1018 chars)
This charming Cape Cod-style home, built in 1955 with some renovated in 2020, offers a solid investment opportunity with a total finished area of 1,092 sq ft. Situated on a desirable corner lot, the property features a full basement with potential for additional living space. The exterior showcases a large corner fenced lot, complemented by ample four driveway/ off-street parking. Inside, the home boasts four bedrooms and 1.5 bathrooms, ideal for maximizing rental potential or investor to flip. The kitchen is recently upgraded with new cabinets equipped with stainless steel refrigerator, including a gas range and dishwasher, new hardwood floor in some areas, and some of the windows was recently change. Located less than a mile from public transportation options (Capitol Heights and Addison Metro station), this property is positioned for strong investor delight. With its average condition need some upgrades. , it presents a promising opportunity for investors in a growing market. Sold in As-Is condition.
-
2004-08-12soldstatus $146,950
-
2004-08-12soldstatus $146,950
-
2004-05-06soldstatus $76,000
-
2004-01-16soldstatus $146,950
-
2003-12-09$147,000
-
2003-12-09historical
ⓘ Source: listings_history table (triggers on properties + properties_extension) + one-shot
backfill from property_details.listing_events for pre-trigger history.
Tax reassessment forecast MD · Partial reset (capped growth)
- Current annual tax
- $3,587 · $299/mo
- Projected year-2 tax
- $3,587 · $299/mo
- Expected delta
- $0/yr ($0/mo · 0.0%)
ⓘ Screening estimate from a state-policy table — verify with the county assessor before closing.
Climate risk First Street
- Flood 1/10 Low FEMA zone X (unshaded) · 0% chance over 30 yrs
- Wildfire 1/10 Low
- Heat 7/10 Severe 7 d/yr ≥103°F today · 16 d/yr by 30 yrs out
- Wind 5/10 Major 22% chance of damaging wind over 30 yrs
- Air quality 4/10 Moderate 4 unhealthy d/yr today · 5 by 30 yrs out
Nearby sold comps map
Loading sold comps map…
Walkable amenities ~0.75 mi
Loading nearby amenities…
Taxation est. · year 1
- Rental income
- $34,118
- − Mortgage interest
- −$14,844
- − Property taxes
- −$3,587
- − Insurance
- −$1,325
- − Repairs & maintenance
- −$2,729
- − Management
- −$2,729
- − Depreciation
- −$7,709
- Taxable income
- $1,194
- Est. tax owed @ 24.0%
- −$287
- After-tax cash flow
- $5,078/yr
For passive investors: Depreciation is non-cash, so a rental often shows a tax loss while cash-flowing — sheltering income. Rental losses are passive: they offset passive income freely, and up to $25,000/yr can offset ordinary (W-2) income if you actively participate and your MAGI is under $100k (phasing out to $0 by $150k); unused losses carry forward. On sale, claimed depreciation is recaptured at up to 25%, and gains may owe capital-gains tax (a 1031 exchange can defer both). Figures are a year-1 estimate at your 24.0% rate — not tax advice; consult a CPA.
Schools (NCES district)
- District
- Prince George'S County Public Schools
- NCES district ID
- 2400510
- Math proficiency
- 8% ▼ -11.00%
- Reading proficiency
- 24% ▼ -9.00%
- Median HH income
- $73,967
- Composite
- 16.82/100
- National rank
- #9151
- State rank
- #21 of 24 in MD
Livability — Capitol Heights
- Score
- 71/100
- State rank
- #155
- US rank
- #6934
Category grades
Schools grade is shown separately in the Schools card above.
Census & demographics
- Census place
- Capitol Heights, MD
- County
- Prince Georges County · 919,866 people
- City population
- 41,093
- Metro
- Washington-Arlington-Alexandria, DC-VA-MD-WV
- Population (ZIP)
- 41,093
- Household income
- $76,466
- Rent vs Own
- Severe rent burden
- 1418.0
Population outlook (Prince George's County) Hauer SSP2
- Today (2025)
- 1,005,426 people
- By 2030
- 1,048,416 · +4.3%
- By 2040
- 1,123,425 · +11.7%
- By 2050
- 1,183,220 · +17.7%
- By 2075
- 1,306,202 · +29.9%
- By 2100
- 1,408,179 · +40.1%
Race, ethnicity, and origin ACS 2023
- Neighborhood character
- Predominantly Black (78%)
- Race & ethnicity
- Black 78% Hispanic / Latino 16% Two or more races 4% White 3% Asian 1%
- Hispanic origin (detail)
- Mexican 2% Puerto Rican 2%
- Foreign-born
- 16% · Canada
- Languages at home
- 81% English-only · Spanish 13% French/Haitian/Cajun 1%
Political lean MEDSL · Prince George's
- 2024 margin
- Solid D (+75.2) · D 86.3% · R 11.2% · Other 2.5%
- 2008→2024 swing
- -3.3pp toward R · 2008: 78.5pp · 2024: 75.2pp
- All cycles
- 2024: D+75.2 2020: D+80.5 2016: D+81.0 2012: D+80.9 2008: D+78.5
Not yet ingested
- Civics
- —
Market trends
- HPI YoY
- ▼ -311.97%
- Current HPI
- 335.5152
- Rent YoY
- ▲ 5.90%
- Metro
- Washington-Arlington-Alexandria, DC-VA-MD-WV
- State GDP YoY
- ▲ 2.97%
- F500 in state
- 12
Industry mix (Fortune 500 HQ in MD)
| Industry | F500 HQs | Revenue |
|---|---|---|
| Aerospace / Defense | 1 | $71B |
|
||
| Utilities | 1 | $25B |
|
||
| Hotels | 1 | $24B |
|
||
| Consumer Goods | 1 | $7B |
|
||
| Real Estate | 1 | $6B |
|
||
| Chemicals | 1 | $2B |
|
||
Price history
+80.3% since first listed12 events — show timeline
- 2026-05-15 Price Changed $265,000 BRIGHT MLS
- 2026-05-14 Relisted — BRIGHT MLS
- 2026-05-03 Pending — BRIGHT MLS
- 2026-04-20 Relisted — BRIGHT MLS
- 2026-04-06 Listing Removed — BRIGHT MLS
- 2026-03-22 Listed $270,000 BRIGHT MLS
- 2004-08-12 Sold (Public Records) $146,950 Public Records
- 2004-08-12 Sold (Public Records) $146,950 Public Records
- 2004-05-06 Sold (Public Records) $76,000 Public Records
- 2004-01-16 Sold (MLS) $146,950 MRIS
- 2003-12-09 Delisted — MRIS
- 2003-12-09 Listed $147,000 MRIS
Property tax history
+5.1%/yrLatest (2025): $3,587 · -3.4% YoY. Source: county tax records.
Cash-flow waterfall
monthlySold comps — $/sqft
last 12 mo · ≤1 miLoading sold comps…