1139 Sargeant St · Baltimore, MD
Flood risk 1/10 · Minimal
- FEMA flood zone
- X (unshaded)
- Chance of flooding over 30 yrs
- 0.0%
- Est. flood insurance / yr
- $473 – $860
Fire risk 1/10 · Minimal
- Est. fire insurance / yr
- $755 – $1,403
Heat risk 8/10 · Major
- Hot days now (above 103°F)
- 7 days/yr
- Hot days in 30 yrs
- 15 days/yr
Wind risk 6/10 · Moderate
- Chance of severe wind over 30 yrs
- 27.0%
Air-quality risk 4/10 · Minor
- Unhealthy air days now
- 6 days/yr
- Unhealthy air days in 30 yrs
- 7 days/yr
Risk factors via First Street. Map © Google.
Why this score? — see what drove the B grade
The composite is a weighted blend of 9 inputs, each scored 0–100. Each bar is that input's sub-score; the figure is the points it added to the 100-point composite (weight × sub-score).
- Cash flow +30.0/30.0
- 1% rule +10.0/10.0
- DSCR +10.0/10.0
- ARV discount +8.5/15.0
- Rent growth +4.4/5.0
- Livability +3.8/5.0
- Condition / age +2.5/5.0
- Schools +1.0/10.0
- Appreciation +0.0/10.0
$105,000
🖨 Deal sheet 📄 Offer letter ✓ Due diligence
Listing remarks MLS
EXCELLENT OPPORTUNITY for a 1st Time Home Buyer in RED HOT Washington Village!! Renovation in '99 included NEW Central A/C, Furnace, Hot Water Heater, and ALL Appliances! Basement has 2 Fully Finished Rooms perfect for additional bedrooms, playroom, or home office. 2 BLOCKS TO CAMDEN CROSSING 250k+ TOWNHOMES !!
Key facts
- Built 1900
- Listed 3 days
Property features AI
Finance
- Other: Not in a federal flood zone
- Financial info: Ownership is ground rent; Ground rent amount $30 paid semi-annually; Annual ground rent listed in income/expense items
Exterior
- Parking: On-street parking
- Utilities: Public water; Public sewer; Municipal trash service
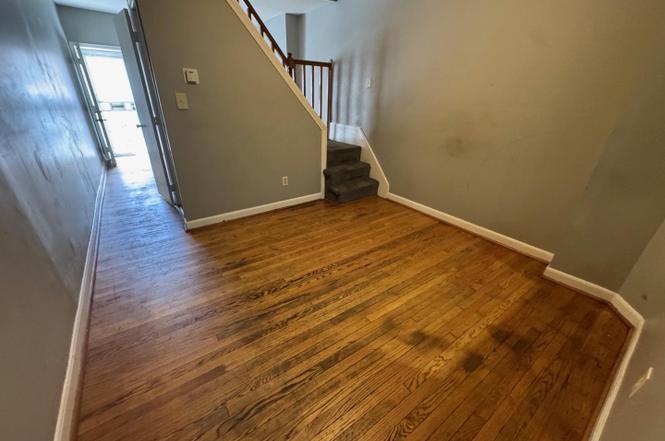
- Home design: Interior townhouse/rowhouse; Property in very good condition; Located within city limits
- Construction: Brick construction; Permanent foundation; Building not winterized
- Exterior features: Wood fencing; Ground rent exists (paid semi-annually)
Interior
- Bedrooms: Two bedrooms on the first upper level; One bedroom on the first lower level
- Bathrooms: One full bathroom (all upper levels)
- Heating & cooling: Central heating (natural gas); Central air conditioning; Electric hot water
- Interior features: Dining area; Unfinished basement
Neighborhood map
What this means for you Summary
Snapshot
- This is a 3-bed/1.0-bath townhouse listed at $105k.
Deal economics
- At list price, monthly cash flow is $640 ($8k/yr) — positive.
- The deal already cash-flows at list — no discount required.
- Meets the 1% rule at list price ($2k rent vs $105k).
- Cap rate 13.6% vs local median 6.0% in Baltimore — top-decile yield for the area; either an underpriced asset or a hidden risk that comps aren't pricing in. Stress-test before assuming the spread holds.
Location & tenants
- Location reads 76/100 on livability (#90 in MD, #3,396 nationally) — a middle-class / working-renter tenant base. Strengths: amenities A+, commute A+, housing A+; Watch: schools D, crime F.
- Baltimore City Public Schools (urban): math 7% / reading 16% proficiency, ranked #24 of 24 in MD (top 100%) — low school quality limits family demand, transient renter base, plan for 1-2y turnover; 79% free/reduced lunch — lower-income household profile, screen leases tightly.
- Market conditions: Rents rising fast (+7.5%/yr); 422 active listings in the ZIP; 40 comparable units currently listed for rent nearby; rentals at typical pace (median 24d on market — plan ~3-4 weeks tenant-placement turnaround); 1,273 units permitted in Baltimore city in 2024 (1,104 in 5+ unit buildings).
- At $1,736/mo this rent would consume 45% of the median local household income ($46k/yr) (locally 1755% of renters already pay >50% of income on rent) — very limited rent-growth headroom before tenants either downsize or default.
Forward outlook
- Local home prices are declining (-3.0%/yr); year-one equity from $726 of loan paydown is wiped out by about $3k of value loss. Plan a longer hold.
- Baltimore County population projected to shrink 4% by 2050 — rents likely to lag national; underwrite the cash flow, not the appreciation.
- At projected returns (-3.0% appreciation + 7.5% rent growth), your $29k cash investment doubles in ~4 years — after that, you're playing with house money.
Negotiation context
- Only 3 days on market — expect competitive offers; lowballing is unlikely to land.
- 3 sale attempts since 29y ago; this cycle's ask is 24% above the opening price — seller raised mid-cycle; expect resistance to lowballs.
- Current owner paid $86k; 22% above their basis — modest negotiation headroom, anchor on the comps not their cost.
Risks & watch-outs
- Watch-outs: built in 1900 — expect roof / HVAC / electrical / plumbing capex.
- Climate carrying-cost: major wind risk, 27% chance of damaging wind over 30y; extreme-heat days projected 7→15/yr by 2055 (HVAC capex compounding) — expect insurance premiums to compound above CPI over the hold.
Questions for the listing agent
- Built in 1900 — when were the roof, HVAC, electrical panel, plumbing, and water heater last replaced?
- Is there a deadline driving the sale (1031 exchange, divorce, estate, relocation)? That informs how much negotiation room exists.
- Schools are D-rated, which usually means shorter tenancies and higher turnover. Who's the typical renter profile here, and what's been the actual vacancy rate?
- Crime grade is F in this area — have there been break-ins, vandalism, or insurance claims at this property in the last 3 years? What carrier currently insures it and at what premium?
- What's the average days-on-market for RENTAL listings here right now (not sales)? A rising rental-DOM trend means longer vacancies and softer asking-rent achievability than the comps imply.
- What's the recent tenant-quality profile in this submarket — average credit score on applications, eviction rate, late-payment / NSF rate, and stable-employment percentage? A property-management company in the area should have these aggregated.
- How much new for-sale + rental construction is in the pipeline within 1–3 miles? Heavy new supply typically softens prices + rents 12–24 months out; constrained supply supports both.
Investment metrics
- 1% rule
- 1.65% ✓
- Cap rate
- 13.61%
- Cash-on-cash
- 26.14%
- DSCR
- 2.16
- GRM
- 5.0
CMA / ARV
- ARV (on-the-fly)
- $107,448
- Comps found
- 12
Show comp detail 12 sales within ~0.75 mi
| Address | Dist | Beds/Ba | Sqft | Sold | Price | $/sf | Match |
|---|---|---|---|---|---|---|---|
| 1133 Sargeant St | 0.01mi | 2/1.5 (-1) | 912 (+3%) | 2mo | $67,500 | $74 | 86 |
| 1121 Cleveland St | 0.16mi | 2/1.0 (-1) | 912 (+3%) | 2mo | $109,900 | $121 | 81 |
| 864 Carroll St | 0.16mi | 2/1.5 (-1) | 880 (-1%) | 3mo | $89,000 | $101 | 81 |
| 1241 W Lombard St | 0.34mi | 2/1.0 (-1) | 963 (+8%) | 3mo | $150,000 | $156 | 63 |
| 640 Dover St | 0.51mi | 3/2.0 | 936 (+5%) | 2mo | $220,000 | $235 | 62 |
| 119 S Carrollton Ave | 0.28mi | 2/1.5 (-1) | 800 (-10%) | 4mo | $83,000 | $104 | 61 |
| 305 S Calhoun St | 0.31mi | 3/1.0 | 1,008 (+14%) | 4mo | $40,000 | $40 | 60 |
| 1226 W Pratt St | 0.29mi | 2/1.5 (-1) | 1,000 (+13%) | 2mo | $80,000 | $80 | 57 |
| 1239 W Lombard St | 0.34mi | 2/1.0 (-1) | 1,000 (+13%) | 3mo | $150,000 | $150 | 56 |
| 802 W Barre St | 0.41mi | 3/3.0 | 990 (+12%) | 3mo | $285,000 | $288 | 51 |
| 105 S Schroeder St | 0.27mi | 2/2.0 (-1) | 1,020 (+15%) | 4mo | $67,000 | $66 | 50 |
| 703 Dover St | 0.46mi | 2/2.0 (-1) | 1,008 (+14%) | 1mo | $225,000 | $223 | 46 |
Match score weights: distance 35% · size 25% · config 20% · recency 20%. Top-matched comps best support the ARV.
Projected returns pro-forma
-3.0% appreciation · 7.51% rent growth · sell at horizon
- IRR
- 24.9%
- Equity multiple
- 2.09×
- Total profit
- $32,041
- Equity at exit
- $15,656
- IRR
- 35.4%
- Equity multiple
- 5.00×
- Total profit
- $117,650
- Equity at exit
- $9,078
Cash invested: $29,400 (down + closing). Projections, not guarantees.
Landlord ↔ Tenant lean methodology
- Overall (CITY)
- 12 Strongly Tenant-Friendly
- State Maryland
- 27 Tenant-Leaning · D+14
- County
- — inherits STATE
- City Baltimore
- 12 Strongly Tenant-Friendly · D+58
ZIP-level market 21223
- Rents YoY
- 7.5%
- Active inventory
- 422
- Price-to-rent
- 5.0×
Monthly cashflow live
- Estimated rent
- $1,736 high interval (Pro) →
- Mortgage (P&I)
- −$551
- Tax from tax record
- −$137 /mo · $1,644/yr
- Insurance
- −$44
- HOA
- −$0
- Vacancy / Maint / Mgmt
- −$365
- Net cashflow
- $640
Break-even live
UW: 25.0% down · 7.5% · 30yr · 1.5% tax · 5.0% vac · 8.0% maint · 8.0% mgmt
Financing live
Cash to close
- Down payment
- $26,250
- Closing costs
- $3,150
- Reserves months
- —
- Total cash needed
- —
Loan-product check · same deal, 3 products live
Conventional
25% down · 7.5% · 30yr
- Down + closing
- —
- Monthly P&I
- —
- Monthly cashflow
- —
- DSCR
- —
- Eligible?
- —
Personal DTI + credit; lowest rate.
DSCR
20% down · 8.5% · 30yr
- Down + closing
- —
- Monthly P&I
- —
- Monthly cashflow
- —
- DSCR
- —
- Eligible?
- —
No personal income docs; deal must DSCR.
Hard money
10% down · 12.0% · 12mo
- Down + closing
- —
- Monthly P&I
- —
- Monthly cashflow
- —
- DSCR
- —
- Eligible?
- —
Short-term bridge; refi at stabilization.
Rent comps 40 comps
| Address | Beds | Baths | Sqft | Rent | $/sqft | DOM | Units | Dist |
|---|---|---|---|---|---|---|---|---|
| 1142 Sargeant St Baltimore, MD | 3.0 | 2.0 | 1080 | $1,601 | $1.48 | 2d | 1 | 0.01mi |
| 1127 Sargeant St Baltimore, MD | 2.0 | 1.5 | 1080 | $1,275 | $1.18 | 23d | 1 | 0.03mi |
| 1160 Washington Blvd Baltimore, MD | 2.0 | 1.0 | 960 | $1,575 | $1.64 | 23d | 1 | 0.06mi |
| 1215 James St Baltimore, MD | 2.0 | 1.0 | 960 | $1,500 | $1.56 | 43d | 1 | 0.09mi |
| 1163 Washington Blvd Baltimore, MD | 2.0 | 2.5 | 1012 | $1,700 | $1.68 | 12d | 1 | 0.09mi |
| 923 McHenry St Baltimore, MD | 3.0 | 1.0 | 1008 | $1,625 | $1.61 | 43d | 1 | 0.13mi |
| 847 McHenry St Baltimore, MD | 2.0 | 2.0 | 952 | $1,795 | $1.89 | 4d | 1 | 0.17mi |
| 853 Reinhart St Baltimore, MD | 2.0 | 2.5 | 780 | $1,800 | $2.31 | 43d | 1 | 0.19mi |
| 805 Washington Blvd Unit A Baltimore, MD | 2.0 | 2.0 | 1050 | $1,650 | $1.57 | 43d | 1 | 0.26mi |
| 805 Washington Blvd Unit B Baltimore, MD | 2.0 | 2.0 | 1106 | $1,650 | $1.49 | 20d | 1 | 0.26mi |
| 305 S Calhoun St Baltimore, MD | 2.0 | 1.0 | 1000 | $1,300 | $1.30 | 21d | 1 | 0.29mi |
| 519 Scott St Unit 1 Baltimore, MD | 2.0 | 2.0 | 800 | $2,000 | $2.50 | 43d | 1 | 0.30mi |
| 48 S Carrollton Ave Unit 4 Baltimore, MD | 2.0 | 1.0 | 670 | $1,600 | $2.39 | 43d | 1 | 0.34mi |
| 1432 Carroll St Baltimore, MD | 2.0 | 1.5 | 912 | $1,900 | $2.08 | 43d | 1 | 0.35mi |
| 1125 Wicomico St Baltimore, MD | 3.0 | 3.0 | 1068 | $1,955 | $1.83 | 23d | 1 | 0.37mi |
| 1324 W Lombard St Unit 1 Baltimore, MD | 2.0 | 2.0 | 1100 | $1,500 | $1.36 | 23d | 1 | 0.37mi |
| 1324 W Lombard St Unit 2 Baltimore, MD | 2.0 | 1.5 | 1100 | $1,450 | $1.32 | 43d | 1 | 0.37mi |
| 1315 Hollins St Unit 2 Baltimore, MD | 3.0 | 2.0 | 1096 | $1,860 | $1.70 | 4d | 1 | 0.39mi |
| 1315 Hollins St Unit 2 Baltimore, MD | 3.0 | 2.0 | 1096 | $1,950 | $1.78 | 12d | 1 | 0.39mi |
| 812 S Paca St Baltimore, MD | 3.0 | 2.0 | 990 | $1,500 | $1.52 | 12d | 1 | 0.42mi |
| 638 S Paca St Unit 2404866494 Baltimore, MD | 3.0 | 1.5 | 1100 | $2,200 | $2.00 | 43d | 1 | 0.48mi |
| 101 N Schroeder St Baltimore, MD | 3.0 | 1.0–2.0 | 1037 | $3,185 | $3.07 | 2d | 12 | 0.50mi |
| 1601 Frederick Ave Unit 3 Baltimore, MD | 2.0 | 1.0 | 1050 | $1,050 | $1.00 | 4d | 1 | 0.58mi |
| 617 W Lexington St Baltimore, MD | 1.0–2.0 | 1.0 | 975 | $2,200 | $2.26 | 10d | 4 | 0.74mi |
| 1918 W Baltimore St Baltimore, MD | 2.0–3.0 | 1.0–2.0 | 857 | $1,434 | $1.67 | 43d | 1 | 0.82mi |
| 11 S Eutaw St Baltimore, MD | 1.0–2.0 | 1.0–2.0 | 1023 | $2,146 | $2.10 | 1d | 11 | 0.82mi |
| 300 W Lombard St Baltimore, MD | 2.0 | 1.0–2.0 | 686 | $1,835 | $2.67 | 2d | 7 | 0.83mi |
| 311 W Baltimore St Unit 504 Baltimore, MD | 2.0 | 2.0 | 1100 | $1,999 | $1.82 | 20d | 1 | 0.86mi |
| 8 N Howard St Baltimore, MD | 2.0 | 1.0–2.0 | 1433 | $3,600 | $2.51 | 1d | 36 | 0.90mi |
| 305 W Fayette St Baltimore, MD | 1.0–2.0 | 1.0–2.0 | 895 | $1,640 | $1.83 | 43d | 1 | 0.91mi |
| 123 W Barre St #112 Baltimore, MD | 2.0 | 1.5 | 975 | $2,200 | $2.26 | 43d | 1 | 0.91mi |
| 300 W Fayette St Baltimore, MD | 3.0 | 1.0–3.0 | 1267 | $2,250 | $1.78 | 3d | 9 | 0.92mi |
| 318 N Paca St Unit 10 Baltimore, MD | 2.0 | 1.0 | 600 | $1,200 | $2.00 | 21d | 1 | 0.94mi |
| 2 Hopkins Plaza Baltimore, MD | 2.0 | 1.0–2.0 | 942 | $3,115 | $3.31 | 2d | 12 | 0.98mi |
| 1315 Harlem Ave Unit C Baltimore, MD | 2.0 | 1.0 | 900 | $1,425 | $1.58 | 43d | 1 | 0.99mi |
| 1315 Harlem Ave Unit B Baltimore, MD | 2.0 | 1.0 | 900 | $1,425 | $1.58 | 23d | 1 | 0.99mi |
| 3 Andrew Pl Unit R98 Baltimore, MD | 2.0 | 2.0 | 975 | $2,100 | $2.15 | 12d | 1 | 1.01mi |
| 319 W Mulberry St Unit 2 Baltimore, MD | 2.0 | 2.0 | 1115 | $1,350 | $1.21 | 43d | 1 | 1.03mi |
| 101 W Cross St Baltimore, MD | 2.0 | 1.0–2.0 | 937 | $3,332 | $3.55 | 1d | 23 | 1.03mi |
| 1110 Shields Pl Unit 1129 Baltimore, MD | 2.0 | 1.0 | 770 | $1,100 | $1.43 | 43d | 1 | 1.04mi |
Listing history 6 events
-
2026-06-18days on market $105,000 Active 3 DOM
-
2026-06-17days on market $105,000 Active 2 DOM
-
2026-06-16statusdays on market $105,000 Active 1 DOM
-
2026-06-15days on market $105,000 Coming Soon 4 DOM
-
2026-06-13remarks 202-char remark
-
2026-06-13$105,000 Coming Soon 2 DOM
ⓘ Source: listings_history table (triggers on properties + properties_extension) + one-shot
backfill from property_details.listing_events for pre-trigger history.
Tax reassessment forecast MD · Partial reset (capped growth)
- Current annual tax
- $1,644 · $137/mo
- Projected year-2 tax
- $1,644 · $137/mo
- Expected delta
- $0/yr ($0/mo · 0.0%)
ⓘ Screening estimate from a state-policy table — verify with the county assessor before closing.
Climate risk First Street
- Flood 1/10 Low FEMA zone X (unshaded) · 0% chance over 30 yrs
- Wildfire 1/10 Low
- Heat 8/10 Severe 7 d/yr ≥103°F today · 15 d/yr by 30 yrs out
- Wind 6/10 Major 27% chance of damaging wind over 30 yrs
- Air quality 4/10 Moderate 6 unhealthy d/yr today · 7 by 30 yrs out
Nearby sold comps map
Loading sold comps map…
Walkable amenities ~0.75 mi
Loading nearby amenities…
Taxation est. · year 1
- Rental income
- $20,838
- − Mortgage interest
- −$5,882
- − Property taxes
- −$1,644
- − Insurance
- −$525
- − Repairs & maintenance
- −$1,667
- − Management
- −$1,667
- − Depreciation
- −$3,055
- Taxable income
- $6,398
- Est. tax owed @ 24.0%
- −$1,536
- After-tax cash flow
- $6,149/yr
For passive investors: Depreciation is non-cash, so a rental often shows a tax loss while cash-flowing — sheltering income. Rental losses are passive: they offset passive income freely, and up to $25,000/yr can offset ordinary (W-2) income if you actively participate and your MAGI is under $100k (phasing out to $0 by $150k); unused losses carry forward. On sale, claimed depreciation is recaptured at up to 25%, and gains may owe capital-gains tax (a 1031 exchange can defer both). Figures are a year-1 estimate at your 24.0% rate — not tax advice; consult a CPA.
Schools (NCES district)
- District
- Baltimore City Public Schools
- NCES district ID
- 2400090
- Math proficiency
- 7% ▼ -9.00%
- Reading proficiency
- 16% ▼ -5.00%
- Median HH income
- $42,108
- Composite
- 10.08/100
- National rank
- #9805
- State rank
- #24 of 24 in MD
Livability — Baltimore
- Score
- 76/100
- State rank
- #90
- US rank
- #3396
Category grades
Schools grade is shown separately in the Schools card above.
Census & demographics
- Census place
- Baltimore, MD
- County
- Baltimore City · 558,601 people
- City population
- 588,727
- Metro
- Baltimore-Columbia-Towson, MD
- Population (ZIP)
- 19,572
- Household income
- $45,840
- Rent vs Own
- Severe rent burden
- 1755.0
Population outlook (Baltimore County) Hauer SSP2
- Today (2025)
- 624,249 people
- By 2030
- 621,541 · -0.4%
- By 2040
- 609,756 · -2.3%
- By 2050
- 597,249 · -4.3%
- By 2075
- 552,236 · -11.5%
- By 2100
- 513,934 · -17.7%
Race, ethnicity, and origin ACS 2023
- Neighborhood character
- Predominantly Black (72%)
- Race & ethnicity
- Black 72% White 16% Hispanic / Latino 7% Two or more races 6% Asian 1%
- Hispanic origin (detail)
- Mexican 3% Puerto Rican 1%
- Common ancestry
- Romanian 1%
- Foreign-born
- 8% · Canada
- Languages at home
- 90% English-only · Spanish 6% French/Haitian/Cajun 2% Other Indo-European 1%
Political lean MEDSL · Baltimore
- 2024 margin
- Solid D (+73.0) · D 85.2% · R 12.2% · Other 2.6%
- 2008→2024 swing
- -2.5pp toward R · 2008: 75.5pp · 2024: 73.0pp
- All cycles
- 2024: D+73.0 2020: D+76.6 2016: D+74.6 2012: D+76.4 2008: D+75.5
Not yet ingested
- Civics
- —
Market trends
- HPI YoY
- ▼ -97.99%
- Current HPI
- 140.5836
- Rent YoY
- ▲ 7.51%
- Metro
- Baltimore-Columbia-Towson, MD
- State GDP YoY
- ▲ 2.97%
- F500 in state
- 12
Industry mix (Fortune 500 HQ in MD)
| Industry | F500 HQs | Revenue |
|---|---|---|
| Aerospace / Defense | 1 | $71B |
|
||
| Utilities | 1 | $25B |
|
||
| Hotels | 1 | $24B |
|
||
| Consumer Goods | 1 | $7B |
|
||
| Real Estate | 1 | $6B |
|
||
| Chemicals | 1 | $2B |
|
||
Price history
+2900.0% since first listed10 events — show timeline
- 2026-06-11 Coming Soon $105,000 BRIGHT MLS
- 2005-07-14 Sold (Public Records) $86,000 Public Records
- 2005-06-29 Sold (MLS) $86,000 MRIS
- 2005-02-25 Delisted — MRIS
- 2004-10-22 Listed $85,000 MRIS
- 2004-08-11 Delisted — MRIS
- 2004-08-05 Listed — MRIS
- 1998-05-14 Sold (MLS) $2,500 MRIS
- 1998-03-24 Delisted — MRIS
- 1997-10-22 Listed $3,500 MRIS
Property tax history
-1.7%/yrLatest (2025): $1,644 · -1.0% YoY. Source: county tax records.
Cash-flow waterfall
monthlySold comps — $/sqft
last 12 mo · ≤1 miLoading sold comps…