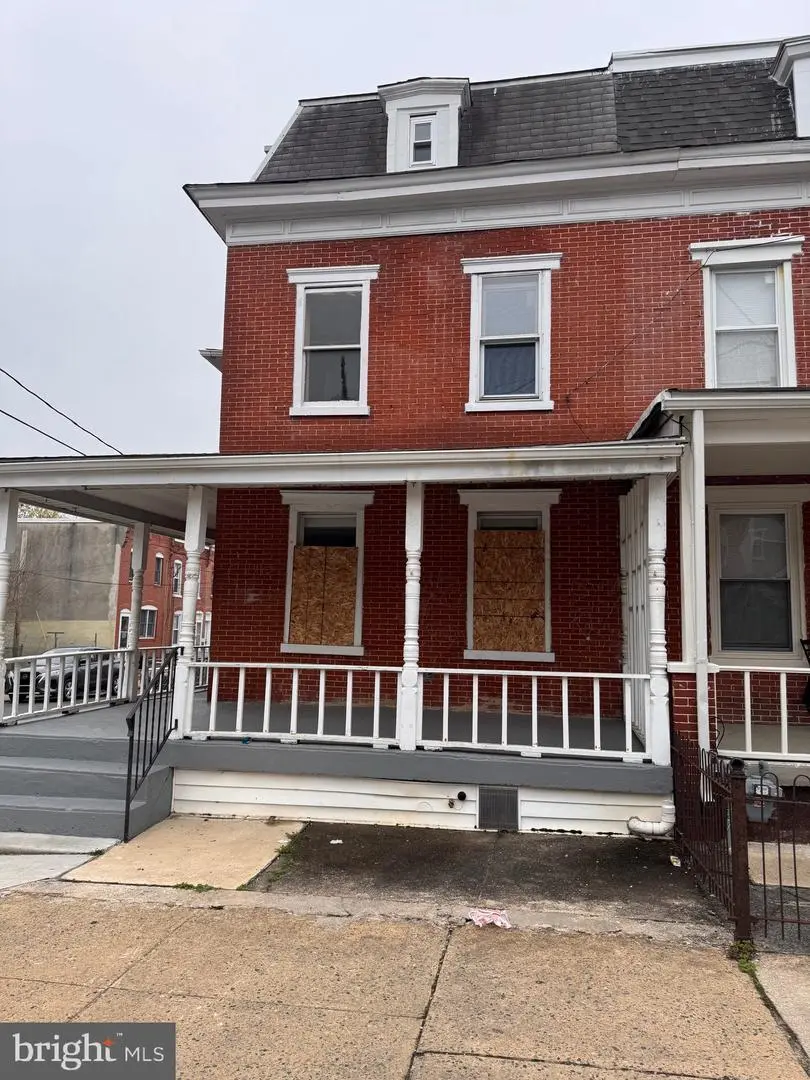
1010 N Lombard St · Wilmington, DE
Flood risk 1/10 · Minimal
- FEMA flood zone
- X (unshaded)
- Chance of flooding over 30 yrs
- 0.0%
- Est. flood insurance / yr
- $473 – $860
Fire risk 1/10 · Minimal
- Est. fire insurance / yr
- $476 – $884
Heat risk 8/10 · Major
- Hot days now (above 103°F)
- 7 days/yr
- Hot days in 30 yrs
- 16 days/yr
Wind risk 6/10 · Moderate
- Chance of severe wind over 30 yrs
- 27.0%
Air-quality risk 3/10 · Minor
- Unhealthy air days now
- 3 days/yr
- Unhealthy air days in 30 yrs
- 5 days/yr
Risk factors via First Street. Map © Google.
Why this score? — see what drove the B grade
The composite is a weighted blend of 9 inputs, each scored 0–100. Each bar is that input's sub-score; the figure is the points it added to the 100-point composite (weight × sub-score).
- Cash flow +30.0/30.0
- ARV discount +13.6/15.0
- DSCR +10.0/10.0
- 1% rule +7.7/10.0
- Livability +3.2/5.0
- Rent growth +2.9/5.0
- Schools +2.5/10.0
- Condition / age +2.5/5.0
- Appreciation +0.0/10.0
$179,900
🖨 Deal sheet 📄 Offer letter ✓ Due diligence
Listing remarks MLS
This property has tons of potentional. This is a 5 bedroom, 1.5 bath in Wilmington. There is some TLC needed, but overall the house is in great shape. It is a corner property, with deck that wraps around the side to the front door. Schedule your appointments today!
Key facts
- Deck wraps around
- Corner property
- Built 1900
Tags
Neighborhood map
What this means for you Summary
Snapshot
- This is a 5-bed/1.5-bath townhouse listed at $180k.
Deal economics
- At list price, monthly cash flow is $691 ($8k/yr) — positive.
- The deal already cash-flows at list — no discount required.
- Meets the 1% rule at list price ($2k rent vs $180k).
- Recommended offer: $169k (6.0% below list) — sets the bar for market timing.
- Cap rate 10.9% vs local median 5.6% in Wilmington — top-decile yield for the area; either an underpriced asset or a hidden risk that comps aren't pricing in. Stress-test before assuming the spread holds.
Location & tenants
- Location reads 64/100 on livability (#52 in DE) — a middle-class / working-renter tenant base. Strengths: cost of living A+, housing A; Watch: employment D+, schools D, commute D.
- Christina School District (suburban): math 22% / reading 33% proficiency, ranked #18 of 26 in DE (top 69%) — low school quality limits family demand, transient renter base, plan for 1-2y turnover.
- Market conditions: Rents rising (+1.6%/yr); 75 active listings in the ZIP; 5 comparable units currently listed for rent nearby; rentals at typical pace (median 24d on market — plan ~3-4 weeks tenant-placement turnaround); 40% of comp listings sitting > 30 days — soft ceiling on asking rent; 1,367 units permitted in New Castle County in 2024 (201 in 5+ unit buildings).
- At $2,280/mo this rent would consume 52% of the median local household income ($53k/yr) (locally 919% of renters already pay >50% of income on rent) — very limited rent-growth headroom before tenants either downsize or default.
Forward outlook
- Local home prices are declining (-3.0%/yr); year-one equity from $1k of loan paydown is wiped out by about $5k of value loss. Plan a longer hold.
- New Castle County population projected at +9% by 2050 — modest demand growth; plan on rents tracking national, not racing it.
- At projected returns (-3.0% appreciation + 1.6% rent growth), your $50k cash investment doubles in ~9 years — after that, you're playing with house money.
Negotiation context
- It's been on market 63 days — a 6% lower offer ($169k) is reasonable based on typical stale-listing flexibility.
- 6 sale attempts since 12y ago; this cycle's ask has dropped $20k (10%) from the opening price — seller is motivated, your offer sets the floor, not the list.
- Current owner paid $25k; list at $180k implies a 620% gain — meaningful room to come down on a strong offer.
Risks & watch-outs
- Watch-outs: built in 1900 — expect roof / HVAC / electrical / plumbing capex.
- Climate carrying-cost: major wind risk, 27% chance of damaging wind over 30y; extreme-heat days projected 7→16/yr by 2055 (HVAC capex compounding) — expect insurance premiums to compound above CPI over the hold.
Questions for the listing agent
- It's been on market 63 days. Have you received any prior offers? Is the seller open to a 6% concession, seller financing, or rate buy-down credit?
- Built in 1900 — when were the roof, HVAC, electrical panel, plumbing, and water heater last replaced?
- Why hasn't it sold? Are there any deal-killer items the seller is aware of (foundation, flood, title, zoning, code violations)?
- Is there a deadline driving the sale (1031 exchange, divorce, estate, relocation)? That informs how much negotiation room exists.
- Schools are D-rated, which usually means shorter tenancies and higher turnover. Who's the typical renter profile here, and what's been the actual vacancy rate?
- Crime grade is F in this area — have there been break-ins, vandalism, or insurance claims at this property in the last 3 years? What carrier currently insures it and at what premium?
- What's the average days-on-market for RENTAL listings here right now (not sales)? A rising rental-DOM trend means longer vacancies and softer asking-rent achievability than the comps imply.
- What's the recent tenant-quality profile in this submarket — average credit score on applications, eviction rate, late-payment / NSF rate, and stable-employment percentage? A property-management company in the area should have these aggregated.
- How much new for-sale + rental construction is in the pipeline within 1–3 miles? Heavy new supply typically softens prices + rents 12–24 months out; constrained supply supports both.
Investment metrics
- 1% rule
- 1.27% ✓
- Cap rate
- 10.90%
- Cash-on-cash
- 16.46%
- DSCR
- 1.73
- GRM
- 6.6
CMA / ARV
- ARV (median comp)
- $207,924
- List price
- $179,900
- Delta
- -13.48%
- Verdict
- UNDERPRICED
- Comps
- 20 within 1.0 mi
Show comp detail 12 sales within ~0.75 mi
| Address | Dist | Beds/Ba | Sqft | Sold | Price | $/sf | Match |
|---|---|---|---|---|---|---|---|
| 516 E 9th St | 0.11mi | 4/2.0 (-1) | 1,625 (-2%) | 2mo | $184,000 | $113 | 84 |
| 901 N Church St | 0.21mi | 4/1.0 (-1) | 1,575 (-4%) | 2mo | $184,000 | $117 | 74 |
| 1005 N Lombard St | 0.03mi | 4/2.5 (-1) | 1,725 (+4%) | 10mo | $245,000 | $142 | 74 |
| 834 N Lombard St | 0.13mi | 4/1.5 (-1) | 1,500 (-9%) | 11mo | $199,900 | $133 | 65 |
| 202 W 22nd St | 0.74mi | 4/1.5 (-1) | 1,650 (0%) | 13mo | $240,000 | $145 | 49 |
| 837 N Madison St | 0.71mi | 4/1.5 (-1) | 1,775 (+8%) | 0mo | $315,000 | $177 | 49 |
| 2 E 24th St | 0.71mi | 4/2.0 (-1) | 1,550 (-6%) | 3mo | $158,163 | $102 | 47 |
| 504 N Church St | 0.40mi | 4/1.5 (-1) | 1,450 (-12%) | 11mo | $249,000 | $172 | 47 |
| 36 E 23rd St | 0.64mi | 4/1.5 (-1) | 1,475 (-11%) | 4mo | $155,000 | $105 | 44 |
| 2112 N Pine St | 0.54mi | 5/2.5 | 1,875 (+14%) | 10mo | $140,000 | $75 | 40 |
| 2222 N Market St | 0.66mi | 4/1.0 (-1) | 1,775 (+8%) | 13mo | $107,000 | $60 | 39 |
| 501 W 3rd St | 0.73mi | 4/1.5 (-1) | 1,825 (+11%) | 12mo | $265,000 | $145 | 34 |
Match score weights: distance 35% · size 25% · config 20% · recency 20%. Top-matched comps best support the ARV.
Projected returns pro-forma
-3.0% appreciation · 1.59% rent growth · sell at horizon
- IRR
- 6.0%
- Equity multiple
- 1.23×
- Total profit
- $11,611
- Equity at exit
- $26,824
- IRR
- 14.2%
- Equity multiple
- 2.07×
- Total profit
- $53,853
- Equity at exit
- $15,554
Cash invested: $50,372 (down + closing). Projections, not guarantees.
Landlord ↔ Tenant lean methodology
- Overall (STATE)
- 70 Landlord-Friendly
- State Delaware
- 70 Landlord-Friendly · D+7
- County
- — inherits STATE
- City
- — inherits STATE
ZIP-level market 19801
- Rents YoY
- 1.6%
- Active inventory
- 75
- Price-to-rent
- 6.6×
Monthly cashflow live
- Estimated rent
- $2,280 high interval (Pro) →
- Mortgage (P&I)
- −$943
- Tax from tax record
- −$92 /mo · $1,102/yr
- Insurance
- −$75
- HOA
- −$0
- Vacancy / Maint / Mgmt
- −$479
- Net cashflow
- $691
Break-even live
UW: 25.0% down · 7.5% · 30yr · 1.5% tax · 5.0% vac · 8.0% maint · 8.0% mgmt
Financing live
Cash to close
- Down payment
- $44,975
- Closing costs
- $5,397
- Reserves months
- —
- Total cash needed
- —
Loan-product check · same deal, 3 products live
Conventional
25% down · 7.5% · 30yr
- Down + closing
- —
- Monthly P&I
- —
- Monthly cashflow
- —
- DSCR
- —
- Eligible?
- —
Personal DTI + credit; lowest rate.
DSCR
20% down · 8.5% · 30yr
- Down + closing
- —
- Monthly P&I
- —
- Monthly cashflow
- —
- DSCR
- —
- Eligible?
- —
No personal income docs; deal must DSCR.
Hard money
10% down · 12.0% · 12mo
- Down + closing
- —
- Monthly P&I
- —
- Monthly cashflow
- —
- DSCR
- —
- Eligible?
- —
Short-term bridge; refi at stabilization.
Rent comps 5 comps
| Address | Beds | Baths | Sqft | Rent | $/sqft | DOM | Units | Dist |
|---|---|---|---|---|---|---|---|---|
| 125 W 23rd St Wilmington, DE | 4.0 | 2.0 | 1672 | $1,995 | $1.19 | 43d | 1 | 0.77mi |
| 2518 N Tatnall St Wilmington, DE | 4.0 | 1.5 | 1575 | $1,995 | $1.27 | 43d | 1 | 0.82mi |
| 2401 N West St Wilmington, DE | 4.0 | 1.0 | 1650 | $1,900 | $1.15 | 15d | 1 | 0.82mi |
| 1029 Lancaster Ave Wilmington, DE | 4.0 | 1.5 | 1375 | $1,900 | $1.38 | 24d | 1 | 1.13mi |
| 1301 Lancaster Ave Wilmington, DE | 4.0 | 2.0 | 1200 | $1,800 | $1.50 | 11d | 1 | 1.27mi |
Listing history 27 events
-
2026-06-08statusdays on market $179,900 Pending 63 DOM
-
2026-06-07days on market $179,900 Active 62 DOM
-
2026-06-04days on market $179,900 Active 59 DOM
-
2026-06-03days on market $179,900 Active 58 DOM
-
2026-06-02days on market $179,900 Active 57 DOM
-
2026-06-01days on market $179,900 Active 56 DOM
-
2026-05-31days on market $179,900 Active 55 DOM
-
2026-04-26price $189,900 265-char remark
Show marketing remark (265 chars)
This property has tons of potentional. This is a 5 bedroom, 1.5 bath in Wilmington. There is some TLC needed, but overall the house is in great shape. It is a corner property, with deck that wraps around the side to the front door. Schedule your appointments today!
-
2026-04-06$199,900 Active 265-char remark
Show marketing remark (265 chars)
This property has tons of potentional. This is a 5 bedroom, 1.5 bath in Wilmington. There is some TLC needed, but overall the house is in great shape. It is a corner property, with deck that wraps around the side to the front door. Schedule your appointments today!
-
2019-01-09historical 79-char remark
Show marketing remark (79 chars)
Large five bedroom, one and a half bath home located in the City of Wilmington.
-
2018-10-26soldstatus $25,000 Closed 79-char remark
Show marketing remark (79 chars)
Large five bedroom, one and a half bath home located in the City of Wilmington.
-
2018-10-12status Pending 79-char remark
Show marketing remark (79 chars)
Large five bedroom, one and a half bath home located in the City of Wilmington.
-
2018-09-17price $32,000 79-char remark
Show marketing remark (79 chars)
Large five bedroom, one and a half bath home located in the City of Wilmington.
-
2018-07-11status Active 79-char remark
Show marketing remark (79 chars)
Large five bedroom, one and a half bath home located in the City of Wilmington.
-
2018-07-06status Pending 79-char remark
Show marketing remark (79 chars)
Large five bedroom, one and a half bath home located in the City of Wilmington.
-
2018-06-28price $35,000 79-char remark
Show marketing remark (79 chars)
Large five bedroom, one and a half bath home located in the City of Wilmington.
-
2017-10-27$36,500 Active 79-char remark
Show marketing remark (79 chars)
Large five bedroom, one and a half bath home located in the City of Wilmington.
-
2017-06-01historical
-
2016-10-10$80,000
-
2014-03-19soldstatus $23,250
-
2014-03-19soldstatus $23,250 Sold
-
2014-02-27status Under Contract
-
2014-02-27historical
-
2014-02-17$17,999
-
2014-02-17$17,999 Active
-
1995-11-20soldstatus $45,000
-
1984-05-01soldstatus $15,000
ⓘ Source: listings_history table (triggers on properties + properties_extension) + one-shot
backfill from property_details.listing_events for pre-trigger history.
Tax reassessment forecast DE · Partial reset (capped growth)
- Current annual tax
- $1,102 · $92/mo
- Projected year-2 tax
- $1,102 · $92/mo
- Expected delta
- $0/yr ($0/mo · 0.0%)
ⓘ Screening estimate from a state-policy table — verify with the county assessor before closing.
Climate risk First Street
- Flood 1/10 Low FEMA zone X (unshaded) · 0% chance over 30 yrs
- Wildfire 1/10 Low
- Heat 8/10 Severe 7 d/yr ≥103°F today · 16 d/yr by 30 yrs out
- Wind 6/10 Major 27% chance of damaging wind over 30 yrs
- Air quality 3/10 Moderate 3 unhealthy d/yr today · 5 by 30 yrs out
Nearby sold comps map
Loading sold comps map…
Walkable amenities ~0.75 mi
Loading nearby amenities…
Taxation est. · year 1
- Rental income
- $27,358
- − Mortgage interest
- −$10,077
- − Property taxes
- −$1,102
- − Insurance
- −$900
- − Repairs & maintenance
- −$2,189
- − Management
- −$2,189
- − Depreciation
- −$5,233
- Taxable income
- $5,668
- Est. tax owed @ 24.0%
- −$1,360
- After-tax cash flow
- $6,930/yr
For passive investors: Depreciation is non-cash, so a rental often shows a tax loss while cash-flowing — sheltering income. Rental losses are passive: they offset passive income freely, and up to $25,000/yr can offset ordinary (W-2) income if you actively participate and your MAGI is under $100k (phasing out to $0 by $150k); unused losses carry forward. On sale, claimed depreciation is recaptured at up to 25%, and gains may owe capital-gains tax (a 1031 exchange can defer both). Figures are a year-1 estimate at your 24.0% rate — not tax advice; consult a CPA.
Schools (NCES district)
- District
- Christina School District
- NCES district ID
- 1000200
- Math proficiency
- 22% ▼ -12.00%
- Reading proficiency
- 33% ▼ -5.00%
- Median HH income
- $58,838
- Composite
- 24.93/100
- National rank
- #7567
- State rank
- #18 of 26 in DE
Livability — Wilmington
- Score
- 64/100
- State rank
- #52
- US rank
- #14251
Category grades
Schools grade is shown separately in the Schools card above.
Census & demographics
- Census place
- Wilmington, DE
- County
- New Castle County · 483,412 people
- City population
- 173,480
- Metro
- Philadelphia-Camden-Wilmington, PA-NJ-DE-MD
- Population (ZIP)
- 16,327
- Household income
- $52,810
- Rent vs Own
- Severe rent burden
- 919.0
Population outlook (New Castle County) Hauer SSP2
- Today (2025)
- 594,686 people
- By 2030
- 609,164 · +2.4%
- By 2040
- 632,154 · +6.3%
- By 2050
- 649,068 · +9.1%
- By 2075
- 687,771 · +15.7%
- By 2100
- 694,961 · +16.9%
Race, ethnicity, and origin ACS 2023
- Neighborhood character
- Predominantly Black (67%)
- Race & ethnicity
- Black 67% White 15% Hispanic / Latino 9% Two or more races 7% Asian 4%
- Hispanic origin (detail)
- Mexican 3% Puerto Rican 4%
- Common ancestry
- Romanian 1% Slovak 1% Italian 1%
- Foreign-born
- 9% · Canada, China, Vietnam
- Languages at home
- 87% English-only · Spanish 7% Other Indo-European 2% Chinese 1%
Political lean MEDSL · New Castle
- 2024 margin
- Solid D (+32.6) · D 65.5% · R 32.9% · Other 1.6%
- 2008→2024 swing
- -8.1pp toward R · 2008: 40.6pp · 2024: 32.6pp
- All cycles
- 2024: D+32.6 2020: D+37.1 2016: D+29.6 2012: D+34.1 2008: D+40.6
Not yet ingested
- Civics
- —
Market trends
- HPI YoY
- ▼ -112.65%
- Current HPI
- 151.1288
- Rent YoY
- ▲ 1.59%
- Metro
- Philadelphia-Camden-Wilmington, PA-NJ-DE-MD
- State GDP YoY
- —
- F500 in state
- 0
Price history
+1166.0% since first listed20 events — show timeline
- 2026-04-26 Price Changed $189,900 BRIGHT MLS
- 2026-04-06 Listed $199,900 BRIGHT MLS
- 2019-01-09 Listing Removed — BRIGHT MLS
- 2018-10-26 Sold (MLS) $25,000 BRIGHT MLS
- 2018-10-12 Pending — BRIGHT MLS
- 2018-09-17 Price Changed $32,000 BRIGHT MLS
- 2018-07-11 Relisted — BRIGHT MLS
- 2018-07-06 Pending — BRIGHT MLS
- 2018-06-28 Price Changed $35,000 BRIGHT MLS
- 2017-10-27 Listed $36,500 BRIGHT MLS
- 2017-06-01 Listing Removed — BRIGHT MLS
- 2016-10-10 Listed $80,000 BRIGHT MLS
- 2014-03-19 Sold (MLS) $23,250 TREND
- 2014-03-19 Sold (MLS) $23,250 BRIGHT MLS
- 2014-02-27 Pending — TREND
- 2014-02-27 Listing Removed — BRIGHT MLS
- 2014-02-17 Listed $17,999 TREND
- 2014-02-17 Listed $17,999 BRIGHT MLS
- 1995-11-20 Sold (Public Records) $45,000 Public Records
- 1984-05-01 Sold (Public Records) $15,000 Public Records
Property tax history
+3.9%/yrLatest (2024): $1,102 · +2.6% YoY. Source: county tax records.
Cash-flow waterfall
monthlySold comps — $/sqft
last 12 mo · ≤1 miLoading sold comps…