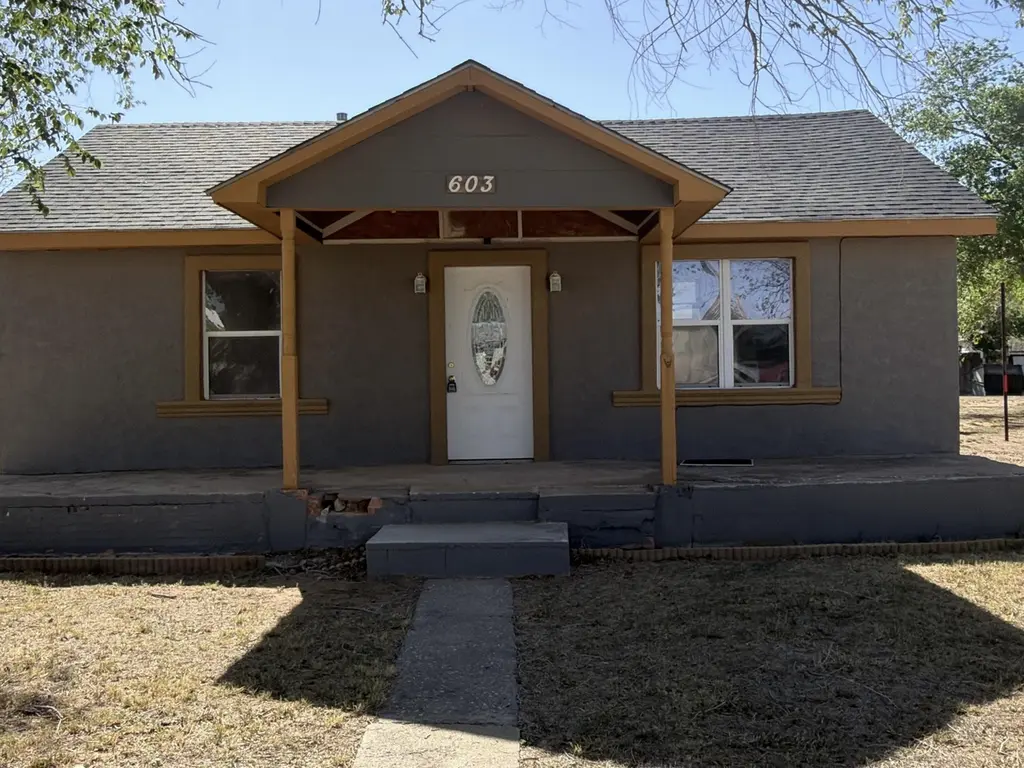
603 N Avenue D · Denver City, TX
Flood risk 1/10 · Minimal
- FEMA flood zone
- —
- Chance of flooding over 30 yrs
- 0.0%
- Est. flood insurance / yr
- —
Fire risk 2/10 · Minimal
- Est. fire insurance / yr
- $1,222 – $2,270
Heat risk 5/10 · Moderate
- Hot days now (above 99°F)
- 6 days/yr
- Hot days in 30 yrs
- 17 days/yr
Wind risk 2/10 · Minimal
- Chance of severe wind over 30 yrs
- 1.0%
Air-quality risk 1/10 · Minimal
- Unhealthy air days now
- 0 days/yr
- Unhealthy air days in 30 yrs
- 0 days/yr
Risk factors via First Street. Map © Google.
Why this score? — see what drove the C- grade
The composite is a weighted blend of 9 inputs, each scored 0–100. Each bar is that input's sub-score; the figure is the points it added to the 100-point composite (weight × sub-score).
- Cash flow +20.4/30.0
- ARV discount +7.5/15.0
- 1% rule +6.8/10.0
- DSCR +6.5/10.0
- Livability +3.7/5.0
- Schools +2.9/10.0
- Rent growth +2.5/5.0
- Condition / age +2.5/5.0
- Appreciation +0.0/10.0
$83,500
🖨 Deal sheet (PDF) 📄 Offer letter ✓ Due diligence
Listing remarks MLS
Have you been on the hunt for a home under $130,000? Here is your chance to owe a remodeled 3 bed 1 bath home with a 1 car detached garage! This home sits on a large lot and has too many updates to name. Don't let this one split by. Perfect for a first time home buyer or investor looking to add a great property to your portfolio. Schedule your showing before it is too late!
Key facts
- 8,276 sq ft lot
- Garage
- Built 1955
Property features AI
Exterior
- Parking: Detached garage; Driveway; 1 garage space
- Utilities: Public water; Public sewer; Electricity connected; Natural gas connected and available
- Home design: Single family residence; One-story
- Construction: Stucco exterior; Composition roof; Pillar/post/pier foundation; Built as a residential single-family home
- Exterior features: Private yard; Porch; Fenced backyard; Asphalt road frontage (city street, publicly maintained)
Interior
- Kitchen: Oven; Refrigerator
- Flooring: Carpet; Wood
- Bathrooms: 1 full bathroom
- Heating & cooling: Central heating (natural gas); Central electric air conditioning
- Interior features: Open floorplan; Soaking tub
- Laundry & utility: Indoor laundry; Gas water heater
Neighborhood map
What this means for you Summary
Snapshot
- This is a 3-bed/1.0-bath single-family listed at $84k.
Deal economics
- At list price, monthly cash flow is $109 ($1k/yr) — positive.
- The deal already cash-flows at list — no discount required.
- Meets the 1% rule at list price ($985 rent vs $84k).
- Recommended offer: $81k (3.0% below list) — sets the bar for market timing.
Location & tenants
- Location reads 73/100 on livability (#223 in TX) — a middle-class / working-renter tenant base. Strengths: cost of living A+, housing A+, crime A; Watch: amenities F, commute F, health & safety F.
- Denver City ISD (town): math 32% / reading 33% proficiency, ranked #547 of 826 in TX (top 66%) — families likely to look elsewhere, expect single-tenant / working-renter base with shorter leases.
- Zoned schools: Kelley El (math 37% / reading 31%, grade F, #2,149 of 4,322 statewide, top 50%, 325 students, 64% FRL); William G Gravitt J H (math 27% / reading 32%, grade F, #1,077 of 1,662 statewide, top 66%, 364 students, 63% FRL); Denver City H S (math 37% / reading 42%, grade F, #821 of 1,632 statewide, top 53%, 521 students, 47% FRL).
- Market conditions: 39 active listings in the ZIP; 6 units permitted in Yoakum County in 2024 (0 in 5+ unit buildings).
Forward outlook
- Local home prices are declining (-3.0%/yr); year-one equity from $577 of loan paydown is wiped out by about $3k of value loss. Plan a longer hold.
- Yoakum County population projected at +48% by 2050 — long-run rental-demand tailwind backs the buy-and-hold thesis.
Negotiation context
- It's been on market 54 days — a 3% lower offer ($81k) is reasonable based on typical stale-listing flexibility.
- 2 sale attempts since 5y ago; this cycle's ask has dropped $8k (8%) from the opening price — seller is motivated, your offer sets the floor, not the list.
Risks & watch-outs
- Watch-outs: property tax is 2.8% of price; built in 1955 — expect roof / HVAC / electrical / plumbing capex.
- Climate carrying-cost: extreme-heat days projected 6→17/yr by 2055 (HVAC capex compounding) — expect insurance premiums to compound above CPI over the hold.
Questions for the listing agent
- It's been on market 54 days. Have you received any prior offers? Is the seller open to a 3% concession, seller financing, or rate buy-down credit?
- Built in 1955 — when were the roof, HVAC, electrical panel, plumbing, and water heater last replaced?
- Property tax is high relative to price — has the assessment been appealed recently, and will the sale trigger a re-assessment?
- Is there a deadline driving the sale (1031 exchange, divorce, estate, relocation)? That informs how much negotiation room exists.
- Schools are D-rated, which usually means shorter tenancies and higher turnover. Who's the typical renter profile here, and what's been the actual vacancy rate?
- What's the average days-on-market for RENTAL listings here right now (not sales)? A rising rental-DOM trend means longer vacancies and softer asking-rent achievability than the comps imply.
- What's the recent tenant-quality profile in this submarket — average credit score on applications, eviction rate, late-payment / NSF rate, and stable-employment percentage? A property-management company in the area should have these aggregated.
- How much new for-sale + rental construction is in the pipeline within 1–3 miles? Heavy new supply typically softens prices + rents 12–24 months out; constrained supply supports both.
Investment metrics
- 1% rule
- 1.18% ✓
- Cap rate
- 7.86%
- Cash-on-cash
- 5.59%
- DSCR
- 1.25
- GRM
- 7.1
CMA / ARV
No comps found within radius.
Projected returns pro-forma
-3.0% appreciation · 3.0% rent growth · sell at horizon
- IRR
- -7.6%
- Equity multiple
- 0.72×
- Total profit
- $-6,521
- Equity at exit
- $12,450
- IRR
- 2.1%
- Equity multiple
- 1.15×
- Total profit
- $3,545
- Equity at exit
- $7,220
Cash invested: $23,380 (down + closing). Projections, not guarantees.
Landlord ↔ Tenant lean methodology
- Overall (STATE)
- 87 Strongly Landlord-Friendly
- State Texas
- 87 Strongly Landlord-Friendly · R+5
- County
- — inherits STATE
- City
- — inherits STATE
ZIP-level market 79323
- Active inventory
- 39
- Price-to-rent
- 7.1×
Monthly cashflow live
- Estimated rent
- $985 medium interval (Pro) →
- Mortgage (P&I)
- −$438
- Tax from tax record
- −$196 /mo · $2,357/yr
- Insurance
- −$35
- HOA
- −$0
- Lot rent
- −$0
- Vacancy / Maint / Mgmt
- −$207
- Net cashflow
- $109
Break-even live
Sensitivity live
| Price | -10% $156 | -5% $133 | +0% $109 | +5% $85 | +10% $62 |
|---|---|---|---|---|---|
| Rent | -10% $31 | -5% $70 | +0% $109 | +5% $148 | +10% $187 |
| Rate | -1.0pp $151 | -0.5pp $130 | base $109 | +0.5pp $87 | +1.0pp $65 |
UW: 25.0% down · 7.5% · 30yr · 1.5% tax · 5.0% vac · 8.0% maint · 8.0% mgmt
Financing live
Cash to close
- Down payment
- $20,875
- Closing costs
- $2,505
- Reserves months
- —
- Total cash needed
- —
Loan-product check · same deal, 3 products live
Conventional
25% down · 7.5% · 30yr
- Down + closing
- —
- Monthly P&I
- —
- Monthly cashflow
- —
- DSCR
- —
- Eligible?
- —
Personal DTI + credit; lowest rate.
DSCR
20% down · 8.5% · 30yr
- Down + closing
- —
- Monthly P&I
- —
- Monthly cashflow
- —
- DSCR
- —
- Eligible?
- —
No personal income docs; deal must DSCR.
Hard money
10% down · 12.0% · 12mo
- Down + closing
- —
- Monthly P&I
- —
- Monthly cashflow
- —
- DSCR
- —
- Eligible?
- —
Short-term bridge; refi at stabilization.
Listing history 25 events
-
2026-06-22days on market $83,500 Active 54 DOM
-
2026-06-21days on market $83,500 Active 53 DOM
-
2026-06-21days on market $83,500 Active 52 DOM
-
2026-06-18days on market $83,500 Active 50 DOM
-
2026-06-17days on market $83,500 Active 49 DOM
-
2026-06-16days on market $83,500 Active 48 DOM
-
2026-06-15days on market $83,500 Active 47 DOM
-
2026-06-13days on market $83,500 Active 45 DOM
-
2026-06-12days on market $83,500 Active 44 DOM
-
2026-06-09days on market $83,500 Active 41 DOM
-
2026-06-09price $83,500 Active 40 DOM
-
2026-06-08days on market $91,000 Active 40 DOM
-
2026-06-08days on market $91,000 Active 39 DOM
-
2026-06-05days on market $91,000 Active 37 DOM
-
2026-06-03days on market $91,000 Active 35 DOM
-
2026-06-02days on market $91,000 Active 34 DOM
-
2026-06-01days on market $91,000 Active 33 DOM
-
2026-05-31days on market $91,000 Active 32 DOM
-
2026-04-29$91,000 Active 143-char remark
-
2026-01-28soldstatus
-
2025-10-11price $125,000
-
2022-06-17soldstatus Closed
Show marketing remark (376 chars)
Have you been on the hunt for a home under $130,000? Here is your chance to owe a remodeled 3 bed 1 bath home with a 1 car detached garage! This home sits on a large lot and has too many updates to name. Don't let this one split by. Perfect for a first time home buyer or investor looking to add a great property to your portfolio. Schedule your showing before it is too late!
-
2022-05-05historical
Show marketing remark (376 chars)
Have you been on the hunt for a home under $130,000? Here is your chance to owe a remodeled 3 bed 1 bath home with a 1 car detached garage! This home sits on a large lot and has too many updates to name. Don't let this one split by. Perfect for a first time home buyer or investor looking to add a great property to your portfolio. Schedule your showing before it is too late!
-
2021-06-15$120,000
Show marketing remark (376 chars)
Have you been on the hunt for a home under $130,000? Here is your chance to owe a remodeled 3 bed 1 bath home with a 1 car detached garage! This home sits on a large lot and has too many updates to name. Don't let this one split by. Perfect for a first time home buyer or investor looking to add a great property to your portfolio. Schedule your showing before it is too late!
-
2007-05-02soldstatus
ⓘ Source: listings_history table (triggers on properties + properties_extension) + one-shot
backfill from property_details.listing_events for pre-trigger history.
Tax reassessment forecast TX · Resets to sale price
- Current annual tax
- $2,357 · $196/mo
- Projected year-2 tax
- $2,357 · $196/mo
- Expected delta
- $0/yr ($0/mo · 0.0%)
ⓘ Screening estimate from a state-policy table — verify with the county assessor before closing.
Climate risk First Street
- Flood 1/10 Low 0% chance over 30 yrs
- Wildfire 2/10 Low
- Heat 5/10 Major 6 d/yr ≥99°F today · 17 d/yr by 30 yrs out
- Wind 2/10 Low 100% chance of damaging wind over 30 yrs
- Air quality 1/10 Low 0 unhealthy d/yr today · 0 by 30 yrs out
Nearby sold comps map
Loading sold comps map…
Walkable amenities ~0.75 mi
Loading nearby amenities…
Taxation est. · year 1
- Rental income
- $11,818
- − Mortgage interest
- −$4,677
- − Property taxes
- −$2,357
- − Insurance
- −$418
- − Repairs & maintenance
- −$945
- − Management
- −$945
- − Depreciation
- −$2,429
- Taxable income
- $46
- Est. tax owed @ 24.0%
- −$11
- After-tax cash flow
- $1,296/yr
For passive investors: Depreciation is non-cash, so a rental often shows a tax loss while cash-flowing — sheltering income. Rental losses are passive: they offset passive income freely, and up to $25,000/yr can offset ordinary (W-2) income if you actively participate and your MAGI is under $100k (phasing out to $0 by $150k); unused losses carry forward. On sale, claimed depreciation is recaptured at up to 25%, and gains may owe capital-gains tax (a 1031 exchange can defer both). Figures are a year-1 estimate at your 24.0% rate — not tax advice; consult a CPA.
Schools (NCES district)
- District
- Denver City ISD
- NCES district ID
- 4816770
- Math proficiency
- 32% ▼ -12.00%
- Reading proficiency
- 33% ▼ -7.00%
- Median HH income
- $54,908
- Composite
- 28.74/100
- National rank
- #6677
- State rank
- #547 of 826 in TX
Livability — Denver City
- Score
- 73/100
- State rank
- #223
- US rank
- #5491
Category grades
Schools grade is shown separately in the Schools card above.
Census & demographics
- Census place
- Denver City, TX
- Population (ZIP)
- 7,115
Population outlook (Yoakum County) Hauer SSP2
- Today (2025)
- 9,976 people
- By 2030
- 10,821 · +8.5%
- By 2040
- 12,727 · +27.6%
- By 2050
- 14,807 · +48.4%
- By 2075
- 20,536 · +105.9%
- By 2100
- 24,737 · +148.0%
Race, ethnicity, and origin ACS 2023
- Neighborhood character
- Predominantly Hispanic (74%)
- Race & ethnicity
- Hispanic / Latino 74% Two or more races 30% White 26% Native American 1%
- Hispanic origin (detail)
- Mexican 70%
- Common ancestry
- German 3% Lithuanian 1% Serbian 1%
- Foreign-born
- 24% · Canada
- Languages at home
- 42% English-only · Spanish 52% German/W. Germanic 6%
Political lean MEDSL · Yoakum
- 2024 margin
- Solid R (+70.9) · D 14.3% · R 85.2%
- 2008→2024 swing
- -8.3pp toward R · 2008: -62.6pp · 2024: -70.9pp
- All cycles
- 2024: R+70.9 2020: R+66.7 2016: R+59.6 2012: R+60.6 2008: R+62.6
Not yet ingested
- Civics
- —
Market trends
- HPI YoY
- ▼ -99.51%
- Current HPI
- 138.436
- Rent YoY
- —
- Metro
- —
- State GDP YoY
- ▲ 3.95%
- F500 in state
- 110
Industry mix (Fortune 500 HQ in TX)
| Industry | F500 HQs | Revenue |
|---|---|---|
| Energy | 16 | $1,198B |
|
||
| Technology | 5 | $198B |
|
||
| Engineering / Construction | 4 | $72B |
|
||
| Energy Services | 3 | $60B |
|
||
| Utilities | 3 | $41B |
|
||
| Healthcare | 2 | $330B |
|
||
Price history
-30.4% since first listed8 events — show timeline
- 2026-06-08 Price Changed $83,500 LARMLS
- 2026-04-29 Listed $91,000 LARMLS
- 2026-01-28 Sold (Public Records) — Public Records
- 2025-10-11 Price Changed $125,000 LARMLS
- 2022-06-17 Sold (MLS) — LARMLS
- 2022-05-05 Delisted — LARMLS
- 2021-06-15 Listed $120,000 LARMLS
- 2007-05-02 Sold (Public Records) — Public Records
Property tax history
+10.1%/yrLatest (2025): $2,357 · +25.3% YoY. Source: county tax records.
Cash-flow waterfall
monthlySold comps — $/sqft
last 12 mo · ≤1 miLoading sold comps…