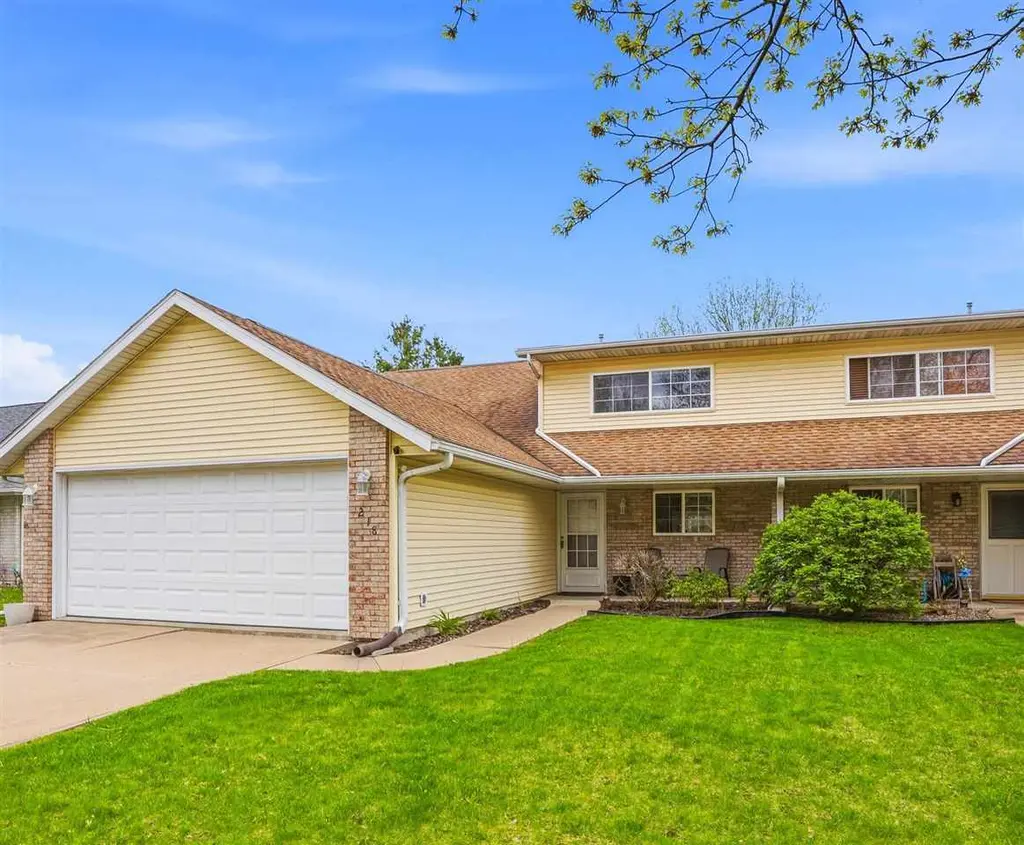
218 Stephans St · Tiffin, IA
Flood risk 1/10 · Minimal
- FEMA flood zone
- X (shaded)
- Chance of flooding over 30 yrs
- 0.0%
- Est. flood insurance / yr
- $507 – $1,088
Fire risk 3/10 · Minor
- Est. fire insurance / yr
- $902 – $1,676
Heat risk 3/10 · Minor
- Hot days now (above 104°F)
- 7 days/yr
- Hot days in 30 yrs
- 16 days/yr
Wind risk 2/10 · Minimal
- Chance of severe wind over 30 yrs
- —
Air-quality risk 2/10 · Minimal
- Unhealthy air days now
- 1 days/yr
- Unhealthy air days in 30 yrs
- 2 days/yr
Risk factors via First Street. Map © Google.
Why this score? — see what drove the D+ grade
The composite is a weighted blend of 9 inputs, each scored 0–100. Each bar is that input's sub-score; the figure is the points it added to the 100-point composite (weight × sub-score).
- ARV discount +15.0/15.0
- Cash flow +12.6/30.0
- Schools +6.4/10.0
- Livability +3.8/5.0
- DSCR +3.7/10.0
- 1% rule +3.4/10.0
- Rent growth +2.5/5.0
- Condition / age +2.5/5.0
- Appreciation +0.0/10.0
$280,000
🖨 Deal sheet (PDF) 📄 Offer letter ✓ Due diligence
Listing remarks
Accepted Offer- Continue to show for Back-up offers. Well-maintained 3 bedroom 2 bathroom zero-lot home in desirable Tiffin! This inviting property features a bright solarium sunroom - perfect for relaxing year-round- along with a fully fenced backyard ideal for pets, play, or entertaining. The functional kitchen, living space and 2 main floor bedrooms with recently updated LVP flooring. Conveniently located main level laundry, with full bath. A large Upper loft bedroom/family room with walk-in closet and private bath offer more functional space. 2 Car attached garage, Newer fence and a New Patio Slider 2020. Note that Seller to close on or after 8/10/2026
Key facts
- Private bath
- New patio slider
- Solarium sunroom
Tags
Property features AI
Finance
- Other: Located in the Tiffin East subdivision
- HOA & community: Association fees billed annually
Exterior
- Parking: Attached garage with 2 parking spaces
- Utilities: Public water; Public sewer
- Home design: Residential property; Zero-lot property; 2 stories
- Construction: Vinyl siding, brick and frame construction; Slab foundation
- Exterior features: Patio; Fenced yard; Contaminant control for improved indoor air quality; Sidewalks and street lights in the community
Interior
- Kitchen: Dishwasher; Microwave; Refrigerator; Water softener (owned)
- Bedrooms: Master downstairs
- Flooring: Carpet; Vinyl
- Bathrooms: 2 full bathrooms
- Heating & cooling: Central air conditioning; Electric and natural gas heating; Baseboard heat
- Interior features: Vaulted ceilings; Master bedroom on the main level; Skylight(s); Gas fireplace in the living room
- Laundry & utility: Washer and dryer included; Main-level laundry room
Neighborhood map
What this means for you Summary
Snapshot
- This is a 3-bed/2.0-bath single-family listed at $280k.
Deal economics
- At list price, monthly cash flow is $-37 ($-443/yr) — negative.
- To cash-flow at today's rent, offer at most $273k (2.3% below list).
- To meet the 1% rule (rent ≥ 1% of price), the offer needs to be $236k (15.6% below list).
- Recommended offer: $236k (15.6% below list) — sets the bar for 1% rule.
- Cap rate 6.1% vs local median 4.2% in Tiffin — top-decile yield for the area; either an underpriced asset or a hidden risk that comps aren't pricing in. Stress-test before assuming the spread holds.
Location & tenants
- Location reads 75/100 on livability (#220 in IA, #4,085 nationally) — a middle-class / working-renter tenant base. Strengths: crime A+, employment A+, cost of living A+; Watch: health & safety D, amenities F, commute F.
- Clear Creek Amana Community School District (rural): math 73% / reading 75% proficiency, ranked #72 of 289 in IA (top 25%) — strong family-tenant draw, lease renewals of 3-5y typical; only 17% free/reduced lunch — higher-income household profile.
- Zoned schools: Tiffin Elementary (math 67% / reading 52%, grade B-, #390 of 616 statewide, top 69%, 400 students, 30% FRL); Clear Creek Amana Middle School (math 76% / reading 76%, grade A, #59 of 246 statewide, top 26%, 640 students, 29% FRL); Clear Creek Amana High School (math 71% / reading 85%, grade A-, #53 of 336 statewide, top 16%, 728 students, 23% FRL).
- Market conditions: 216 active listings in the ZIP; 3 comparable units currently listed for rent nearby; rentals at typical pace (median 16d on market — plan ~3-4 weeks tenant-placement turnaround); solid renter incomes; 714 units permitted in Johnson County in 2024 (158 in 5+ unit buildings).
Forward outlook
- Local home prices are declining (-3.0%/yr); year-one equity from $2k of loan paydown is wiped out by about $8k of value loss. Plan a longer hold.
- Johnson County population projected at +60% by 2050 — long-run rental-demand tailwind backs the buy-and-hold thesis.
Negotiation context
- It's been on market 31 days — a 3% lower offer ($272k) is reasonable based on typical stale-listing flexibility.
- Current owner paid $202k; 39% above their basis — modest negotiation headroom, anchor on the comps not their cost.
Questions for the listing agent
- What do current leases actually rent for vs. the listed asking? Can we see a recent rent roll and the last 12 months of T-12 income?
- It's been on market 31 days. Have you received any prior offers? Is the seller open to a 16% concession, seller financing, or rate buy-down credit?
- Is there a deadline driving the sale (1031 exchange, divorce, estate, relocation)? That informs how much negotiation room exists.
- Schools are A-rated — typically a magnet for longer-tenancy family renters. What's the average tenant stay here, and is there a school-zone premium baked into asking?
- The area grade is low — what's the realistic commute time and amenity access for the typical tenant pool here? Any planned neighborhood developments (good or bad) we should know about?
- What's the average days-on-market for RENTAL listings here right now (not sales)? A rising rental-DOM trend means longer vacancies and softer asking-rent achievability than the comps imply.
- What's the recent tenant-quality profile in this submarket — average credit score on applications, eviction rate, late-payment / NSF rate, and stable-employment percentage? A property-management company in the area should have these aggregated.
- How much new for-sale + rental construction is in the pipeline within 1–3 miles? Heavy new supply typically softens prices + rents 12–24 months out; constrained supply supports both.
Investment metrics
- 1% rule
- 0.84% ✗
- Cap rate
- 6.13%
- Cash-on-cash
- -0.56%
- DSCR
- 0.97
- GRM
- 9.9
CMA / ARV
- ARV (on-the-fly)
- $343,362
- Comps found
- 12
Show comp detail 12 sales within ~0.75 mi
| Address | Dist | Beds/Ba | Sqft | Sold | Price | $/sf | Match |
|---|---|---|---|---|---|---|---|
| 716 Croell Ave | 0.44mi | 4/2.5 (+1) | 1,924 (-0%) | 1mo | $300,000 | $156 | 71 |
| 812 Croell Ave | 0.52mi | 3/3.0 | 1,993 (+3%) | 2mo | $339,000 | $170 | 65 |
| 701 E Goldfinch Dr | 0.46mi | 4/3.0 (+1) | 2,042 (+6%) | 2mo | $369,990 | $181 | 58 |
| 725 E Goldfinch Dr | 0.51mi | 4/3.0 (+1) | 2,042 (+6%) | 1mo | $367,390 | $180 | 57 |
| 611 Croell Ave | 0.30mi | 4/3.0 (+1) | 2,160 (+12%) | 0mo | $343,000 | $159 | 56 |
| 910 Hillside Dr | 0.75mi | 3/3.0 | 1,811 (-6%) | 1mo | $306,000 | $169 | 50 |
| 608 Maddie Ln | 0.41mi | 4/3.0 (+1) | 2,191 (+14%) | 1mo | $399,990 | $183 | 48 |
| 304 Nightingale Dr | 0.62mi | 4/3.0 (+1) | 1,766 (-8%) | 2mo | $351,000 | $199 | 47 |
| 911 Hillside Dr | 0.73mi | 3/3.0 | 2,130 (+10%) | 2mo | $347,000 | $163 | 43 |
| 729 E Goldfinch Dr | 0.52mi | 4/3.0 (+1) | 2,191 (+14%) | 2mo | $389,990 | $178 | 42 |
| 732 E Goldfinch Dr | 0.55mi | 4/3.0 (+1) | 2,190 (+14%) | 1mo | $393,990 | $180 | 42 |
| 724 E Goldfinch Dr | 0.53mi | 4/3.0 (+1) | 2,191 (+14%) | 2mo | $384,990 | $176 | 42 |
Match score weights: distance 35% · size 25% · config 20% · recency 20%. Top-matched comps best support the ARV.
Projected returns pro-forma
-3.0% appreciation · 3.0% rent growth · sell at horizon
- IRR
- -17.2%
- Equity multiple
- 0.39×
- Total profit
- $-47,704
- Equity at exit
- $41,749
- IRR
- -9.2%
- Equity multiple
- 0.43×
- Total profit
- $-44,497
- Equity at exit
- $24,209
Cash invested: $78,400 (down + closing). Projections, not guarantees.
Landlord ↔ Tenant lean methodology
- Overall (STATE)
- 83 Strongly Landlord-Friendly
- State Iowa
- 83 Strongly Landlord-Friendly · R+6
- County
- — inherits STATE
- City
- — inherits STATE
ZIP-level market 52340
- Home prices YoY
- -8.8%
- Active inventory
- 216
- Price-to-rent
- 9.9×
Monthly cashflow live
- Estimated rent
- $2,363 medium interval (Pro) →
- Mortgage (P&I)
- −$1,468
- Tax from tax record
- −$319 /mo · $3,826/yr
- Insurance
- −$117
- HOA
- −$0
- Lot rent
- −$0
- Vacancy / Maint / Mgmt
- −$496
- Net cashflow
- $-37
Break-even live
Sensitivity live
| Price | -10% $122 | -5% $42 | +0% $-37 | +5% $-116 | +10% $-195 |
|---|---|---|---|---|---|
| Rent | -10% $-224 | -5% $-130 | +0% $-37 | +5% $56 | +10% $150 |
| Rate | -1.0pp $104 | -0.5pp $34 | base $-37 | +0.5pp $-109 | +1.0pp $-183 |
UW: 25.0% down · 7.5% · 30yr · 1.5% tax · 5.0% vac · 8.0% maint · 8.0% mgmt
Financing live
Cash to close
- Down payment
- $70,000
- Closing costs
- $8,400
- Reserves months
- —
- Total cash needed
- —
Loan-product check · same deal, 3 products live
Conventional
25% down · 7.5% · 30yr
- Down + closing
- —
- Monthly P&I
- —
- Monthly cashflow
- —
- DSCR
- —
- Eligible?
- —
Personal DTI + credit; lowest rate.
DSCR
20% down · 8.5% · 30yr
- Down + closing
- —
- Monthly P&I
- —
- Monthly cashflow
- —
- DSCR
- —
- Eligible?
- —
No personal income docs; deal must DSCR.
Hard money
10% down · 12.0% · 12mo
- Down + closing
- —
- Monthly P&I
- —
- Monthly cashflow
- —
- DSCR
- —
- Eligible?
- —
Short-term bridge; refi at stabilization.
Rent comps 3 comps
| Address | Beds | Baths | Sqft | Rent | $/sqft | DOM | Units | Dist |
|---|---|---|---|---|---|---|---|---|
| 628 Catherine Dr Tiffin, IA | 3.0 | 3.5 | 1795 | $2,350 | $1.31 | 15d | 1 | 0.76mi |
| 630 Catherine Dr Tiffin, IA | 3.0 | 3.5 | 1795 | $2,350 | $1.31 | 15d | 1 | 0.76mi |
| 425 Bainberry St Tiffin, IA | 3.0 | 2.5 | 1750 | $2,045 | $1.17 | 46d | 2 | 1.06mi |
Listing history 10 events
-
2026-06-07statusdays on market $280,000 Pending 31 DOM
-
2026-06-05days on market $280,000 Active 28 DOM
-
2026-06-03remarks 665-char remark
-
2026-06-03days on market $280,000 Active 27 DOM
-
2026-06-02days on market $280,000 Active 26 DOM
-
2026-06-01days on market $280,000 Active 25 DOM
-
2026-05-31days on market $280,000 Active 24 DOM
-
2026-05-30days on market $280,000 Active 23 DOM
-
2026-05-07$280,000 Active
-
2019-06-19soldstatus $202,000
ⓘ Source: listings_history table (triggers on properties + properties_extension) + one-shot
backfill from property_details.listing_events for pre-trigger history.
Tax reassessment forecast IA · Partial reset (capped growth)
- Current annual tax
- $3,826 · $319/mo
- Projected year-2 tax
- $4,111 · $343/mo
- Expected delta
- +$285/yr (+$24/mo · 7.4%)
ⓘ Screening estimate from a state-policy table — verify with the county assessor before closing.
Climate risk First Street
- Flood 1/10 Low FEMA zone X (shaded) · 0% chance over 30 yrs
- Wildfire 3/10 Moderate
- Heat 3/10 Moderate 7 d/yr ≥104°F today · 16 d/yr by 30 yrs out
- Wind 2/10 Low
- Air quality 2/10 Low 1 unhealthy d/yr today · 2 by 30 yrs out
Nearby sold comps map
Loading sold comps map…
Walkable amenities ~0.75 mi
Loading nearby amenities…
Taxation est. · year 1
- Rental income
- $28,359
- − Mortgage interest
- −$15,684
- − Property taxes
- −$3,826
- − Insurance
- −$1,400
- − Repairs & maintenance
- −$2,269
- − Management
- −$2,269
- − Depreciation
- −$8,145
- Taxable loss
- −$5,234
- Est. tax savings @ 24.0%
- +$1,256
- After-tax cash flow
- $814/yr
For passive investors: Depreciation is non-cash, so a rental often shows a tax loss while cash-flowing — sheltering income. Rental losses are passive: they offset passive income freely, and up to $25,000/yr can offset ordinary (W-2) income if you actively participate and your MAGI is under $100k (phasing out to $0 by $150k); unused losses carry forward. On sale, claimed depreciation is recaptured at up to 25%, and gains may owe capital-gains tax (a 1031 exchange can defer both). Figures are a year-1 estimate at your 24.0% rate — not tax advice; consult a CPA.
Schools (NCES district)
- District
- Clear Creek Amana Community School District
- NCES district ID
- 1907590
- Math proficiency
- 73% ▼ -6.00%
- Reading proficiency
- 75% ▼ -1.00%
- Median HH income
- $62,915
- Composite
- 63.92/100
- National rank
- #586
- State rank
- #72 of 289 in IA
Livability — Tiffin
- Score
- 75/100
- State rank
- #220
- US rank
- #4085
Category grades
Schools grade is shown separately in the Schools card above.
Census & demographics
- Census place
- Tiffin, IA
- County
- Johnson County · 132,710 people
- City population
- 6,128
- Metro
- Iowa City, IA
- Population (ZIP)
- 6,128
- Household income
- $98,393
- Rent vs Own
- Severe rent burden
- 149.0
Population outlook (Johnson County) Hauer SSP2
- Today (2025)
- 180,405 people
- By 2030
- 200,014 · +10.9%
- By 2040
- 241,428 · +33.8%
- By 2050
- 288,144 · +59.7%
- By 2075
- 420,009 · +132.8%
- By 2100
- 546,596 · +203.0%
Race, ethnicity, and origin ACS 2023
- Neighborhood character
- Predominantly White (80%)
- Race & ethnicity
- White 80% Two or more races 7% Black 5% Hispanic / Latino 5% Asian 3%
- Common ancestry
- Italian 7% Portuguese 5% Romanian 3%
- Foreign-born
- 4% · China, United Kingdom, Canada
- Languages at home
- 95% English-only · Chinese 1% Spanish 1% French/Haitian/Cajun 1%
Political lean MEDSL · Johnson
- 2024 margin
- Solid D (+38.1) · D 68.4% · R 30.3% · Other 1.3%
- 2008→2024 swing
- -3.4pp toward R · 2008: 41.5pp · 2024: 38.1pp
- All cycles
- 2024: D+38.1 2020: D+43.2 2016: D+38.3 2012: D+35.4 2008: D+41.5
Not yet ingested
- Civics
- —
Market trends
- HPI YoY
- ▼ -16.59%
- Current HPI
- 172.251
- Rent YoY
- —
- Metro
- Iowa City, IA
- State GDP YoY
- ▲ 2.48%
- F500 in state
- 4
Industry mix (Fortune 500 HQ in IA)
| Industry | F500 HQs | Revenue |
|---|---|---|
| Financial Services | 1 | $16B |
|
||
| Retail / Convenience | 1 | $15B |
|
||
Price history
+38.6% since first listed2 events — show timeline
- 2026-05-07 Listed $280,000 ICAARMLS
- 2019-06-19 Sold (Public Records) $202,000 Public Records
Property tax history
+3.6%/yrLatest (2025): $3,826 · +3.4% YoY. Source: county tax records.
Cash-flow waterfall
monthlySold comps — $/sqft
last 12 mo · ≤1 miLoading sold comps…