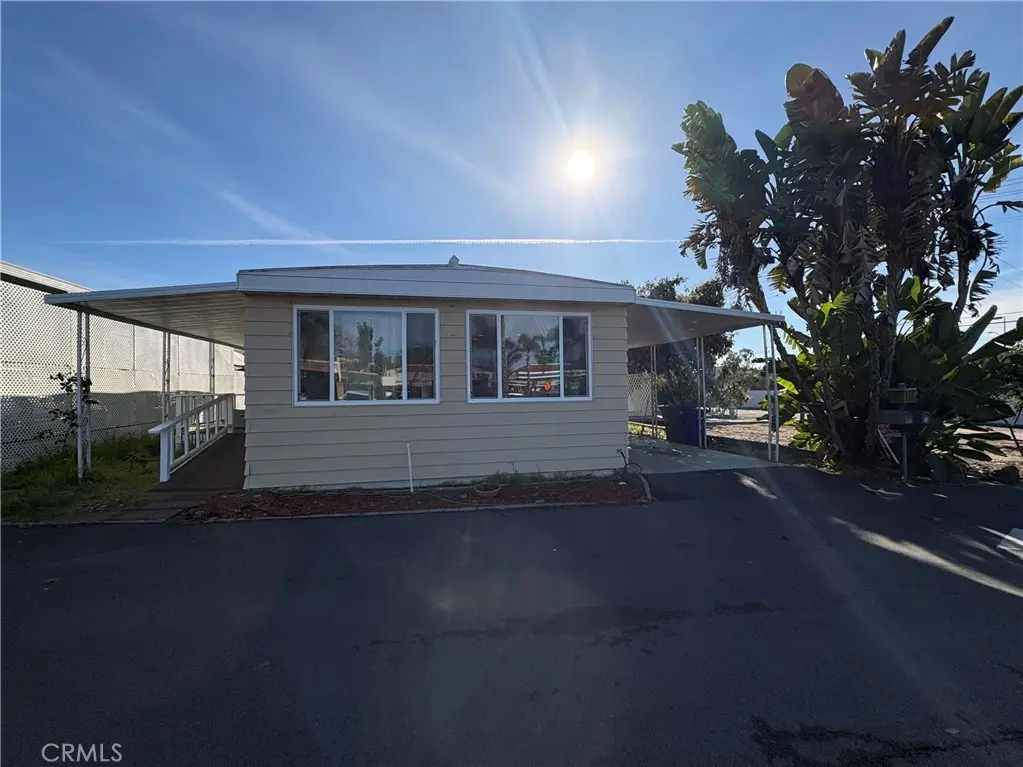
718 Sycamore Ave #19 · Vista, CA
Flood risk 1/10 · Minimal
- FEMA flood zone
- X (unshaded)
- Chance of flooding over 30 yrs
- 0.0%
- Est. flood insurance / yr
- $507 – $1,088
Fire risk 2/10 · Minimal
- Est. fire insurance / yr
- $659 – $1,223
Heat risk 4/10 · Minor
- Hot days now (above 91°F)
- 7 days/yr
- Hot days in 30 yrs
- 21 days/yr
Wind risk 1/10 · Minimal
- Chance of severe wind over 30 yrs
- —
Air-quality risk 3/10 · Minor
- Unhealthy air days now
- 4 days/yr
- Unhealthy air days in 30 yrs
- 4 days/yr
Risk factors via First Street. Map © Google.
Why this score? — see what drove the B- grade
The composite is a weighted blend of 9 inputs, each scored 0–100. Each bar is that input's sub-score; the figure is the points it added to the 100-point composite (weight × sub-score).
- Cash flow +30.0/30.0
- 1% rule +10.0/10.0
- DSCR +10.0/10.0
- Schools +5.4/10.0
- ARV discount +4.2/15.0
- Condition / age +3.8/5.0
- Rent growth +3.4/5.0
- Livability +3.0/5.0
- Appreciation +0.0/10.0
$160,000
🖨 Deal sheet 📄 Offer letter ✓ Due diligence
Listing remarks MLS
Welcome to this beautifully updated double-wide mobile home located in a desirable 55+ community. This well-maintained home features 2 bedrooms and 2 full bathrooms, with a remodeled kitchen showcasing quartz countertops, newer cabinetry, and convenient in-kitchen laundry. Laminate flooring runs throughout the home, creating a clean, modern feel. Enjoy the covered carport and low-maintenance living in a friendly park setting. Community amenities include a clubhouse with pool and spa, billiards room, and library. Ideally located close to shopping with easy access to Highway 78. Monthly space rent is $1,450.
Key facts
- Quartz countertops
- Laminate flooring
- Covered carport
Tags
Neighborhood map
What this means for you Summary
Snapshot
- This is a 2-bed/2.0-bath manufactured listed at $160k. Condition is rated good.
Deal economics
- At list price, monthly cash flow is $1k ($15k/yr) — positive.
- The deal already cash-flows at list — no discount required.
- Meets the 1% rule at list price ($3k rent vs $160k).
- Recommended offer: $146k (9.0% below list) — sets the bar for market timing.
- Cap rate 15.8% vs local median 2.4% in Vista — top-decile yield for the area; either an underpriced asset or a hidden risk that comps aren't pricing in. Stress-test before assuming the spread holds.
Location & tenants
- Location reads 60/100 on livability (#584 in CA) — a middle-class / working-renter tenant base. Strengths: commute A+, employment A-; Watch: schools F, amenities F, cost of living F.
- San Marcos Unified (suburban): math 52% / reading 67% proficiency, ranked #249 of 1,400 in CA (top 18%) — acceptable for families but not a draw, mixed tenant base, ~2y average lease.
- Market conditions: Rents rising (+3.4%/yr); 74 active listings in the ZIP; 20 comparable units currently listed for rent nearby; rentals leasing fast (median 10d on market — plan ~1-2 weeks tenant-placement turnaround); solid renter incomes; 11,759 units permitted in San Diego County in 2024 (7,244 in 5+ unit buildings).
- This rent runs 41% of the median local income ($87k/yr) — at the standard rent-burdened threshold; future hikes will face affordability resistance.
Forward outlook
- Local home prices are declining (-3.0%/yr); year-one equity from $1k of loan paydown is wiped out by about $5k of value loss. Plan a longer hold.
- San Diego County population projected at +20% by 2050 — long-run rental-demand tailwind backs the buy-and-hold thesis.
- At projected returns (-3.0% appreciation + 3.4% rent growth), your $45k cash investment doubles in ~4 years — after that, you're playing with house money.
Negotiation context
- It's been on market 114 days — a 9% lower offer ($146k) is reasonable based on typical stale-listing flexibility.
- 3 sale attempts since 6y ago with the ask held roughly flat each time — persistent listings suggest the price (not the market) is what's stuck; bring a comps-based counter.
- Current owner paid $55k; list at $160k implies a 191% gain — meaningful room to come down on a strong offer.
Questions for the listing agent
- It's been on market 114 days. Have you received any prior offers? Is the seller open to a 9% concession, seller financing, or rate buy-down credit?
- Built in 1968 — when were the roof, HVAC, electrical panel, plumbing, and water heater last replaced?
- Why hasn't it sold? Are there any deal-killer items the seller is aware of (foundation, flood, title, zoning, code violations)?
- Is there a deadline driving the sale (1031 exchange, divorce, estate, relocation)? That informs how much negotiation room exists.
- Schools are F-rated, which usually means shorter tenancies and higher turnover. Who's the typical renter profile here, and what's been the actual vacancy rate?
- What's the average days-on-market for RENTAL listings here right now (not sales)? A rising rental-DOM trend means longer vacancies and softer asking-rent achievability than the comps imply.
- What's the recent tenant-quality profile in this submarket — average credit score on applications, eviction rate, late-payment / NSF rate, and stable-employment percentage? A property-management company in the area should have these aggregated.
- How much new for-sale + rental construction is in the pipeline within 1–3 miles? Heavy new supply typically softens prices + rents 12–24 months out; constrained supply supports both.
Investment metrics
- 1% rule
- 1.88% ✓
- Cap rate
- 15.81%
- Cash-on-cash
- 33.98%
- DSCR
- 2.51
- GRM
- 4.4
CMA / ARV
- ARV (median comp)
- $149,000
- List price
- $160,000
- Delta
- 7.38%
- Verdict
- FAIR
- Comps
- 5 within 1.0 mi
Show comp detail 9 sales within ~0.75 mi
| Address | Dist | Beds/Ba | Sqft | Sold | Price | $/sf | Match |
|---|---|---|---|---|---|---|---|
| 718 Sycamore Ave Ave #157 | 0.03mi | 2/2.0 | 1,260 (+3%) | 15mo | $195,000 | $155 | 81 |
| 718 Sycamore Ave #134 | 0.13mi | 2/2.0 | 1,120 (-8%) | 6mo | $140,000 | $125 | 75 |
| 718 Sycamore Ave #193 | 0.13mi | 2/2.0 | 1,368 (+12%) | 1mo | $149,000 | $109 | 74 |
| 718 Sycamore Ave #115 | 0.07mi | 2/2.0 | 1,392 (+14%) | 6mo | $90,000 | $65 | 68 |
| 718 Sycamore Ave #133 | 0.13mi | 2/2.0 | 1,344 (+10%) | 12mo | $186,700 | $139 | 67 |
| 718 Sycamore Ave #173 | 0.13mi | 2/2.0 | 1,368 (+12%) | 11mo | $265,000 | $194 | 65 |
| 718 Sycamore Ave #100 | 0.13mi | 3/2.0 (+1) | 1,173 (-4%) | 20mo | $282,000 | $240 | 65 |
| 718 Sycamore #22 | 0.07mi | 2/2.5 | 1,116 (-9%) | 20mo | $250,000 | $224 | 63 |
| 718 Sycamore Ave #145 | 0.13mi | 2/2.0 | 1,040 (-15%) | 16mo | $190,000 | $183 | 55 |
Match score weights: distance 35% · size 25% · config 20% · recency 20%. Top-matched comps best support the ARV.
Projected returns pro-forma
-3.0% appreciation · 3.44% rent growth · sell at horizon
- IRR
- 29.8%
- Equity multiple
- 2.26×
- Total profit
- $56,247
- Equity at exit
- $23,857
- IRR
- 37.4%
- Equity multiple
- 4.54×
- Total profit
- $158,728
- Equity at exit
- $13,834
Cash invested: $44,800 (down + closing). Projections, not guarantees.
Landlord ↔ Tenant lean methodology
- Overall (STATE)
- 18 Strongly Tenant-Friendly
- State California
- 18 Strongly Tenant-Friendly · D+13
- County
- — inherits STATE
- City
- — inherits STATE
ZIP-level market 92083
- Rents YoY
- 3.4%
- Active inventory
- 74
- Price-to-rent
- 4.4×
Monthly cashflow live
- Estimated rent
- $3,005 high interval (Pro) →
- Mortgage (P&I)
- −$839
- Tax est. 1.5%
- −$200 /mo · $2,400/yr
- Insurance
- −$67
- HOA
- −$0
- Vacancy / Maint / Mgmt
- −$631
- Net cashflow
- $1,269
Break-even live
UW: 25.0% down · 7.5% · 30yr · 1.5% tax · 5.0% vac · 8.0% maint · 8.0% mgmt
Financing live
Cash to close
- Down payment
- $40,000
- Closing costs
- $4,800
- Reserves months
- —
- Total cash needed
- —
Loan-product check · same deal, 3 products live
Conventional
25% down · 7.5% · 30yr
- Down + closing
- —
- Monthly P&I
- —
- Monthly cashflow
- —
- DSCR
- —
- Eligible?
- —
Personal DTI + credit; lowest rate.
DSCR
20% down · 8.5% · 30yr
- Down + closing
- —
- Monthly P&I
- —
- Monthly cashflow
- —
- DSCR
- —
- Eligible?
- —
No personal income docs; deal must DSCR.
Hard money
10% down · 12.0% · 12mo
- Down + closing
- —
- Monthly P&I
- —
- Monthly cashflow
- —
- DSCR
- —
- Eligible?
- —
Short-term bridge; refi at stabilization.
Rent comps 20 comps
| Address | Beds | Baths | Sqft | Rent | $/sqft | DOM | Units | Dist |
|---|---|---|---|---|---|---|---|---|
| 856 Heatherwood Ln Vista, CA | 1.0–2.0 | 1.0–2.0 | 786 | $2,950 | $3.75 | 2d | 8 | 0.41mi |
| 1941 Wellington Ln #7 Vista, CA | 2.0 | 2.0 | 924 | $2,750 | $2.98 | 43d | 1 | 0.42mi |
| 1982 Wellington Ln Vista, CA | 1.0–2.0 | 1.0–2.0 | 852 | $3,036 | $3.56 | 2d | 3 | 0.42mi |
| 920 Sycamore Ave Vista, CA | 2.0 | 2.0 | 950 | $2,675 | $2.82 | 2d | 1 | 0.46mi |
| 972 Ashton Ct Vista, CA | 3.0 | 2.5 | 1482 | $4,388 | $2.96 | 4d | 1 | 0.57mi |
| 221 Smilax Rd Vista, CA | 1.0–2.0 | 1.0–2.0 | 855 | $2,799 | $3.27 | 2d | 8 | 0.63mi |
| 2183 Primrose Ave Unit B Vista, CA | 1.0 | 1.0 | 850 | $2,075 | $2.44 | 24d | 1 | 0.64mi |
| 1961 Anna Ln Vista, CA | 3.0 | 2.0 | 1407 | $3,700 | $2.63 | 12d | 1 | 0.65mi |
| 1906 Northbrook Ct Vista, CA | 3.0 | 2.0 | 1488 | $4,500 | $3.02 | 1d | 1 | 0.70mi |
| 320 Smilax Rd San Marcos, CA | 2.0 | 1.0 | 875 | $2,675 | $3.06 | 43d | 1 | 0.72mi |
| 320 Smilax Rd San Marcos, CA | 2.0 | 1.0 | 875 | $2,675 | $3.06 | 24d | 1 | 0.72mi |
| 2144 University Dr Vista, CA | 2.0 | 1.0–2.0 | 748 | $2,815 | $3.76 | 10d | 1 | 0.72mi |
| 300 Smilax Rd Unit 11 San Marcos, CA | 2.0 | 1.0 | 875 | $2,675 | $3.06 | 24d | 1 | 0.74mi |
| 266 Avenida de Suerte San Marcos, CA | 3.0 | 2.0 | 1132 | $3,495 | $3.09 | 21d | 1 | 0.78mi |
| 122 Palmyra Dr Vista, CA | 2.0 | 1.5 | 1054 | $2,588 | $2.46 | 43d | 1 | 0.79mi |
| 420 Smilax Rd San Marcos, CA | 2.0 | 2.0 | 896 | $2,445 | $2.73 | 2d | 3 | 0.88mi |
| 2080 Buena Creek Rd Vista, CA | 2.0 | 1.0 | 978 | $3,000 | $3.07 | 2d | 1 | 1.17mi |
| 258 Mar Vista Dr Vista, CA | 3.0 | 2.0 | 1134 | $4,250 | $3.75 | 17d | 1 | 1.25mi |
| 2000 S Melrose Dr Vista, CA | 1.0–2.0 | 1.0–2.0 | 841 | $3,105 | $3.69 | 1d | 8 | 1.44mi |
| 1580 Shadowridge Dr Vista, CA | 1.0–2.0 | 1.0–2.0 | 800 | $3,014 | $3.77 | 1d | 8 | 1.47mi |
Listing history 20 events
-
2026-06-18days on market $160,000 Active 114 DOM
-
2026-06-17days on market $160,000 Active 113 DOM
-
2026-06-16days on market $160,000 Active 112 DOM
-
2026-06-15days on market $160,000 Active 111 DOM
-
2026-06-13days on market $160,000 Active 109 DOM
-
2026-06-09days on market $160,000 Active 105 DOM
-
2026-06-08days on market $160,000 Active 104 DOM
-
2026-06-07days on market $160,000 Active 103 DOM
-
2026-06-04days on market $160,000 Active 100 DOM
-
2026-06-03days on market $160,000 Active 99 DOM
-
2026-06-02days on market $160,000 Active 98 DOM
-
2026-06-01days on market $160,000 Active 97 DOM
-
2026-05-31days on market $160,000 Active 96 DOM
-
2026-02-24$160,000 Active 613-char remark
Show marketing remark (613 chars)
Welcome to this beautifully updated double-wide mobile home located in a desirable 55+ community. This well-maintained home features 2 bedrooms and 2 full bathrooms, with a remodeled kitchen showcasing quartz countertops, newer cabinetry, and convenient in-kitchen laundry. Laminate flooring runs throughout the home, creating a clean, modern feel. Enjoy the covered carport and low-maintenance living in a friendly park setting. Community amenities include a clubhouse with pool and spa, billiards room, and library. Ideally located close to shopping with easy access to Highway 78. Monthly space rent is $1,450.
-
2020-08-14soldstatus $55,000 Closed Sale 584-char remark
Show marketing remark (584 chars)
No property taxes! Spacious yard with two porches and two sheds. Handicap ramp. Painted white walls. Some upgraded laminate floors. Built in hutch in Dining room. Dining bar in Kitchen. Walk in closet in Master Bedroom. Conveniently located across from guest parking, close to highway 78 & walking distance to Stater Brothers, pharmacies, Wallgreens, Walmart, Target, Petsmart, dining, & more! Can be sold mostly furnished!. Neighborhoods: Grandview Terrace Complex Features: , ,, Equipment: Dryer, Range/Oven, Washer Other Fees: 0 Sewer: Sewer Connected Topography: LL
-
2020-08-14soldstatus $55,000 Sold 584-char remark
Show marketing remark (584 chars)
No property taxes! Spacious yard with two porches and two sheds. Handicap ramp. Painted white walls. Some upgraded laminate floors. Built in hutch in Dining room. Dining bar in Kitchen. Walk in closet in Master Bedroom. Conveniently located across from guest parking, close to highway 78 & walking distance to Stater Brothers, pharmacies, Wallgreens, Walmart, Target, Petsmart, dining, & more! Can be sold mostly furnished!. Neighborhoods: Grandview Terrace Complex Features: , ,, Equipment: Dryer, Range/Oven, Washer Other Fees: 0 Sewer: Sewer Connected Topography: LL
-
2020-07-22status Pending 584-char remark
Show marketing remark (584 chars)
No property taxes! Spacious yard with two porches and two sheds. Handicap ramp. Painted white walls. Some upgraded laminate floors. Built in hutch in Dining room. Dining bar in Kitchen. Walk in closet in Master Bedroom. Conveniently located across from guest parking, close to highway 78 & walking distance to Stater Brothers, pharmacies, Wallgreens, Walmart, Target, Petsmart, dining, & more! Can be sold mostly furnished!. Neighborhoods: Grandview Terrace Complex Features: , ,, Equipment: Dryer, Range/Oven, Washer Other Fees: 0 Sewer: Sewer Connected Topography: LL
-
2020-07-22status Pending Sale 584-char remark
Show marketing remark (584 chars)
No property taxes! Spacious yard with two porches and two sheds. Handicap ramp. Painted white walls. Some upgraded laminate floors. Built in hutch in Dining room. Dining bar in Kitchen. Walk in closet in Master Bedroom. Conveniently located across from guest parking, close to highway 78 & walking distance to Stater Brothers, pharmacies, Wallgreens, Walmart, Target, Petsmart, dining, & more! Can be sold mostly furnished!. Neighborhoods: Grandview Terrace Complex Features: , ,, Equipment: Dryer, Range/Oven, Washer Other Fees: 0 Sewer: Sewer Connected Topography: LL
-
2020-06-26$59,900 Active 584-char remark
Show marketing remark (584 chars)
No property taxes! Spacious yard with two porches and two sheds. Handicap ramp. Painted white walls. Some upgraded laminate floors. Built in hutch in Dining room. Dining bar in Kitchen. Walk in closet in Master Bedroom. Conveniently located across from guest parking, close to highway 78 & walking distance to Stater Brothers, pharmacies, Wallgreens, Walmart, Target, Petsmart, dining, & more! Can be sold mostly furnished!. Neighborhoods: Grandview Terrace Complex Features: , ,, Equipment: Dryer, Range/Oven, Washer Other Fees: 0 Sewer: Sewer Connected Topography: LL
-
2020-06-25$59,900 Active 584-char remark
Show marketing remark (584 chars)
No property taxes! Spacious yard with two porches and two sheds. Handicap ramp. Painted white walls. Some upgraded laminate floors. Built in hutch in Dining room. Dining bar in Kitchen. Walk in closet in Master Bedroom. Conveniently located across from guest parking, close to highway 78 & walking distance to Stater Brothers, pharmacies, Wallgreens, Walmart, Target, Petsmart, dining, & more! Can be sold mostly furnished!. Neighborhoods: Grandview Terrace Complex Features: , ,, Equipment: Dryer, Range/Oven, Washer Other Fees: 0 Sewer: Sewer Connected Topography: LL
ⓘ Source: listings_history table (triggers on properties + properties_extension) + one-shot
backfill from property_details.listing_events for pre-trigger history.
Climate risk First Street
- Flood 1/10 Low FEMA zone X (unshaded) · 0% chance over 30 yrs
- Wildfire 2/10 Low
- Heat 4/10 Moderate 7 d/yr ≥91°F today · 21 d/yr by 30 yrs out
- Wind 1/10 Low
- Air quality 3/10 Moderate 4 unhealthy d/yr today · 4 by 30 yrs out
Nearby sold comps map
Loading sold comps map…
Walkable amenities ~0.75 mi
Loading nearby amenities…
Taxation est. · year 1
- Rental income
- $36,064
- − Mortgage interest
- −$8,962
- − Property taxes
- −$2,400
- − Insurance
- −$800
- − Repairs & maintenance
- −$2,885
- − Management
- −$2,885
- − Depreciation
- −$4,655
- Taxable income
- $13,477
- Est. tax owed @ 24.0%
- −$3,234
- After-tax cash flow
- $11,988/yr
For passive investors: Depreciation is non-cash, so a rental often shows a tax loss while cash-flowing — sheltering income. Rental losses are passive: they offset passive income freely, and up to $25,000/yr can offset ordinary (W-2) income if you actively participate and your MAGI is under $100k (phasing out to $0 by $150k); unused losses carry forward. On sale, claimed depreciation is recaptured at up to 25%, and gains may owe capital-gains tax (a 1031 exchange can defer both). Figures are a year-1 estimate at your 24.0% rate — not tax advice; consult a CPA.
Condition & rehab AI · 10 photos
This well-maintained double-wide mobile home in a desirable 55+ community features updated kitchens and bathrooms, laminate flooring, and a low-maintenance exterior. It is ready for a new owner to move in and enjoy the community amenities.
Value-add opportunities
- Both Paint exterior — Enhances curb appeal and value
- Both Clean gutters — Improves drainage and property value
Renovation cost estimate screening
Value-add ROI direction
- Both Paint exterior — Enhances curb appeal and value ↑
- Both Clean gutters — Improves drainage and property value ↑
ⓘ Cost ranges are severity-bucket heuristics (US national rule-of-thumb). Get contractor quotes + a written scope before underwriting a rehab budget.
Schools (NCES district)
- District
- San Marcos Unified
- NCES district ID
- 0634880
- Math proficiency
- 52% ▲ 1.00%
- Reading proficiency
- 67% ▲ 2.00%
- Median HH income
- $64,752
- Composite
- 53.67/100
- National rank
- #3093
- State rank
- #249 of 1400 in CA
Livability — Vista
- Score
- 60/100
- State rank
- #584
- US rank
- #18990
Category grades
Schools grade is shown separately in the Schools card above.
Census & demographics
- County
- San Diego County · 3,178,799 people
- City population
- 117,104
- Metro
- San Diego-Chula Vista-Carlsbad, CA
- Population (ZIP)
- 38,375
- Household income
- $86,974
- Rent vs Own
- Severe rent burden
- 1813.0
Population outlook (San Diego County) Hauer SSP2
- Today (2025)
- 3,678,185 people
- By 2030
- 3,856,546 · +4.8%
- By 2040
- 4,171,407 · +13.4%
- By 2050
- 4,421,607 · +20.2%
- By 2075
- 4,831,599 · +31.4%
- By 2100
- 4,832,502 · +31.4%
Race, ethnicity, and origin ACS 2023
- Neighborhood character
- Majority Hispanic (62%)
- Race & ethnicity
- Hispanic / Latino 62% Two or more races 33% White 27% Asian 4% Black 2% Native American 2% Pacific Islander 1%
- Hispanic origin (detail)
- Mexican 57%
- Common ancestry
- Lithuanian 2% Slovak 1% Romanian 1%
- Foreign-born
- 28% · Canada, Vietnam
- Languages at home
- 49% English-only · Spanish 47% Other Asian/Pacific 1% Tagalog/Filipino 1%
Political lean MEDSL · San Diego
- 2024 margin
- D (+16.8) · D 56.9% · R 40.1% · Other 2.9%
- 2008→2024 swing
- +6.6pp toward D · 2008: 10.2pp · 2024: 16.8pp
- All cycles
- 2024: D+16.8 2020: D+22.8 2016: D+17.8 2012: D+5.1 2008: D+10.2
Not yet ingested
- Civics
- —
Market trends
- HPI YoY
- ▼ -560.30%
- Current HPI
- 417.0863
- Rent YoY
- ▲ 3.44%
- Metro
- San Diego-Chula Vista-Carlsbad, CA
- State GDP YoY
- ▲ 3.21%
- F500 in state
- 116
Industry mix (Fortune 500 HQ in CA)
| Industry | F500 HQs | Revenue |
|---|---|---|
| Technology | 27 | $1,492B |
|
||
| Financial Services | 3 | $174B |
|
||
| Retail | 3 | $44B |
|
||
| Insurance | 3 | $26B |
|
||
| Media / Entertainment | 2 | $115B |
|
||
| Pharmaceuticals / Biotech | 2 | $62B |
|
||
Price history
+167.1% since first listed7 events — show timeline
- 2026-02-24 Listed $160,000 CRMLS
- 2020-08-14 Sold (MLS) $55,000 SDMLS
- 2020-08-14 Sold (MLS) $55,000 CRMLS
- 2020-07-22 Pending — SDMLS
- 2020-07-22 Pending — CRMLS
- 2020-06-26 Listed $59,900 CRMLS
- 2020-06-25 Listed $59,900 SDMLS
Cash-flow waterfall
monthlySold comps — $/sqft
last 12 mo · ≤1 miLoading sold comps…