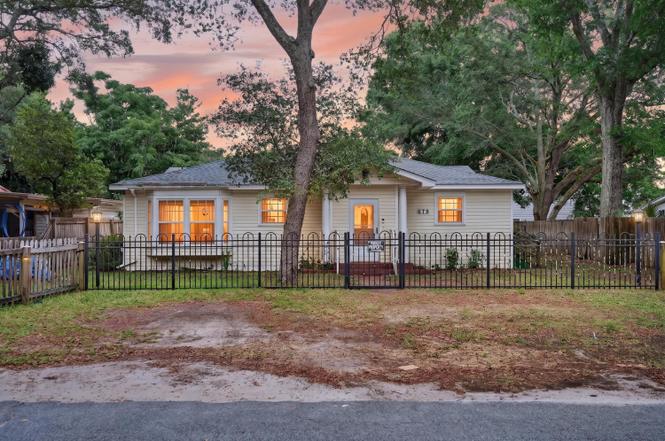
679 Anderson Dr · Wright, FL
Flood risk 1/10 · Minimal
- FEMA flood zone
- X (unshaded)
- Chance of flooding over 30 yrs
- 0.0%
- Est. flood insurance / yr
- $507 – $1,088
Fire risk 1/10 · Minimal
- Est. fire insurance / yr
- $947 – $1,759
Heat risk 10/10 · Severe
- Hot days now (above 104°F)
- 7 days/yr
- Hot days in 30 yrs
- 22 days/yr
Wind risk 9/10 · Severe
- Chance of severe wind over 30 yrs
- 99.0%
Air-quality risk 2/10 · Minimal
- Unhealthy air days now
- 1 days/yr
- Unhealthy air days in 30 yrs
- 2 days/yr
Risk factors via First Street. Map © Google.
Why this score? — see what drove the D+ grade
The composite is a weighted blend of 9 inputs, each scored 0–100. Each bar is that input's sub-score; the figure is the points it added to the 100-point composite (weight × sub-score).
- ARV discount +15.0/15.0
- Cash flow +12.9/30.0
- Schools +5.2/10.0
- Livability +4.0/5.0
- DSCR +3.9/10.0
- Rent growth +2.5/5.0
- Condition / age +2.5/5.0
- 1% rule +2.4/10.0
- Appreciation +0.0/10.0
$260,000
🖨 Deal sheet 📄 Offer letter ✓ Due diligence
Listing remarks
This 4 bedroom, 2 bathroom home is bursting with potential and ready for your personal touch. The expensive, heavy lifting has already been done for you: features include a 2023 roof , a 2019 A/C with brand-new ductwork and returns (2025), and an updated electrical panel and wiring (upgraded 11/2025). Inside, you'll find a mix of tile and classic wood flooring waiting to be restored to its original glory. The primary suite is oversized, complete with an en-suite bathroom. Outside, the large yard is fully secured with a mix of wood and metal fencing. With the major mechanical systems completely taken care of, this home just needs fresh paint and some cosmetic love to shine like new. Being so
Key facts
- Fully secured yard
- Large yard
- 2023 roof
Tags
Property features AI
Finance
- Other: Zoned County, Residential Multi-Family
- HOA & community: Subdivision: MH S RNG 23 & 24 (222000.20)
Exterior
- Parking: 2 driveway spaces
- Security: Smoke detector(s)
- Utilities: Public water; Public sewer; Electric service; Phone service; TV cable
- Home design: Traditional style; Single-story; Built in 1963; County road frontage (paved)
- Construction: Vinyl siding and vinyl trim; Composite shingle roof; Slab foundation
- Exterior features: Fenced lot (full); Porch
Interior
- Kitchen: Pantry; Dishwasher
- Bedrooms: 3 bedrooms; Primary bedroom on the first floor with shower-only master bathroom
- Flooring: Hardwood; Laminate; Tile; Carpet
- Bathrooms: 2 full bathrooms
- Heating & cooling: Central heating; Central air conditioning; Ceiling fans; Electric heat control
- Interior features: Pantry; Split bedroom floor plan; Washer/dryer hookup; Smoke detectors
- Laundry & utility: Laundry room on the first floor; Washer/dryer hookup; Electric water heater
Neighborhood map
What this means for you Summary
Snapshot
- This is a 3-bed/2.0-bath single-family listed at $260k.
Deal economics
- At list price, monthly cash flow is $-17 ($-208/yr) — negative.
- To cash-flow at today's rent, offer at most $257k (1.2% below list).
- To meet the 1% rule (rent ≥ 1% of price), the offer needs to be $192k (26.1% below list).
- Recommended offer: $192k (26.1% below list) — sets the bar for 1% rule.
- Cap rate 6.2% vs local median 4.2% in Wright — top-decile yield for the area; either an underpriced asset or a hidden risk that comps aren't pricing in. Stress-test before assuming the spread holds.
Location & tenants
- Location reads 80/100 on livability (#117 in FL, #1,790 nationally) — a professional / high-income tenant draw. Strengths: commute A+, cost of living A+, housing A+; Watch: amenities F.
- Okaloosa (other): math 60% / reading 60% proficiency, ranked #12 of 73 in FL (top 16%) — acceptable for families but not a draw, mixed tenant base, ~2y average lease.
- Zoned schools: Wright Elementary School (math 48% / reading 49%, grade D, #1,152 of 2,144 statewide, top 55%, 635 students, 73% FRL); Choctawhatchee Senior High School (math 42% / reading 50%, grade D-, #220 of 667 statewide, top 33%, 1,677 students, 52% FRL) — zoned schools average 62% FRL vs 36% district-wide (26 pts higher); higher-poverty schools than district average — tighter screening recommended.
- Zoned-school proficiency averages 47% at this address vs 60% district-wide (-13 pts) — the specific schools serving this property underperform the Okaloosa average; the district grade overstates school quality for this exact location.
- Market conditions: Rents soft (-0.1%/yr); 224 active listings in the ZIP; 40 comparable units currently listed for rent nearby; rentals lingering (median 44d on market — plan ~5-8 weeks vacancy on turnover, expect pricing pressure); 62% of comp listings sitting > 30 days — soft ceiling on asking rent; 1,268 units permitted in Okaloosa County in 2024 (175 in 5+ unit buildings).
- This rent runs 33% of the median local income ($71k/yr) — at the standard rent-burdened threshold; future hikes will face affordability resistance.
Forward outlook
- Local home prices are declining (-3.0%/yr); year-one equity from $2k of loan paydown is wiped out by about $8k of value loss. Plan a longer hold.
- Okaloosa County population projected at +37% by 2050 — long-run rental-demand tailwind backs the buy-and-hold thesis.
Negotiation context
- Only 2 days on market — expect competitive offers; lowballing is unlikely to land.
Risks & watch-outs
- Climate carrying-cost: severe wind risk, 99% chance of damaging wind over 30y; extreme-heat days projected 7→22/yr by 2055 (HVAC capex compounding) — expect insurance premiums to compound above CPI over the hold.
Questions for the listing agent
- What do current leases actually rent for vs. the listed asking? Can we see a recent rent roll and the last 12 months of T-12 income?
- Built in 1963 — when were the roof, HVAC, electrical panel, plumbing, and water heater last replaced?
- Is there a deadline driving the sale (1031 exchange, divorce, estate, relocation)? That informs how much negotiation room exists.
- Schools are D-rated, which usually means shorter tenancies and higher turnover. Who's the typical renter profile here, and what's been the actual vacancy rate?
- The area grade is low — what's the realistic commute time and amenity access for the typical tenant pool here? Any planned neighborhood developments (good or bad) we should know about?
- What's the average days-on-market for RENTAL listings here right now (not sales)? A rising rental-DOM trend means longer vacancies and softer asking-rent achievability than the comps imply.
- What's the recent tenant-quality profile in this submarket — average credit score on applications, eviction rate, late-payment / NSF rate, and stable-employment percentage? A property-management company in the area should have these aggregated.
- How much new for-sale + rental construction is in the pipeline within 1–3 miles? Heavy new supply typically softens prices + rents 12–24 months out; constrained supply supports both.
Investment metrics
- 1% rule
- 0.74% ✗
- Cap rate
- 6.21%
- Cash-on-cash
- -0.29%
- DSCR
- 0.99
- GRM
- 11.3
CMA / ARV
- ARV (on-the-fly)
- $357,060
- Comps found
- 12
Show comp detail 12 sales within ~0.75 mi
| Address | Dist | Beds/Ba | Sqft | Sold | Price | $/sf | Match |
|---|---|---|---|---|---|---|---|
| 125 Newcastle Cir | 0.32mi | 3/2.0 | 1,599 (-2%) | 2mo | $315,000 | $197 | 81 |
| 770 Lloyd St | 0.25mi | 4/2.0 (+1) | 1,560 (-4%) | 3mo | $350,000 | $224 | 74 |
| 634 Mayflower Ave | 0.41mi | 3/2.0 | 1,539 (-5%) | 3mo | $309,000 | $201 | 70 |
| 301 Priscilla Dr | 0.50mi | 3/2.0 | 1,572 (-3%) | 3mo | $390,000 | $248 | 69 |
| 130 Valencia Dr | 0.41mi | 3/1.5 | 1,452 (-10%) | 3mo | $229,900 | $158 | 59 |
| 734 Green St | 0.32mi | 3/2.0 | 1,392 (-14%) | 4mo | $375,000 | $269 | 58 |
| 520 Justin St | 0.54mi | 3/2.0 | 1,450 (-11%) | 2mo | $350,000 | $241 | 55 |
| 936 Central Ave | 0.73mi | 3/2.0 | 1,688 (+4%) | 5mo | $375,000 | $222 | 55 |
| 6 NW Chelsea Dr | 0.71mi | 3/3.0 | 1,700 (+5%) | 1mo | $310,000 | $182 | 54 |
| 33 Circle Dr | 0.69mi | 3/2.0 | 1,460 (-10%) | 1mo | $195,000 | $134 | 50 |
| 701 Russell Blvd | 0.73mi | 3/2.0 | 1,455 (-10%) | 6mo | $320,000 | $220 | 44 |
| 112 Alden Dr | 0.66mi | 3/2.0 | 1,848 (+14%) | 5mo | $369,000 | $200 | 42 |
Match score weights: distance 35% · size 25% · config 20% · recency 20%. Top-matched comps best support the ARV.
Projected returns pro-forma
-3.0% appreciation · 0.0% rent growth · sell at horizon
- IRR
- -19.7%
- Equity multiple
- 0.33×
- Total profit
- $-48,997
- Equity at exit
- $38,767
- IRR
- -19.4%
- Equity multiple
- 0.09×
- Total profit
- $-66,379
- Equity at exit
- $22,480
Cash invested: $72,800 (down + closing). Projections, not guarantees.
Landlord ↔ Tenant lean methodology
- Overall (STATE)
- 87 Strongly Landlord-Friendly
- State Florida
- 87 Strongly Landlord-Friendly · R+3
- County
- — inherits STATE
- City
- — inherits STATE
ZIP-level market 32547
- Home prices YoY
- -29.3%
- Rents YoY
- -0.1%
- Active inventory
- 224
- Price-to-rent
- 11.3×
Monthly cashflow live
- Estimated rent
- $1,921 high interval (Pro) →
- Mortgage (P&I)
- −$1,363
- Tax from tax record
- −$63 /mo · $755/yr
- Insurance
- −$108
- HOA
- −$0
- Vacancy / Maint / Mgmt
- −$403
- Net cashflow
- $-17
Break-even live
UW: 25.0% down · 7.5% · 30yr · 1.5% tax · 5.0% vac · 8.0% maint · 8.0% mgmt
Financing live
Cash to close
- Down payment
- $65,000
- Closing costs
- $7,800
- Reserves months
- —
- Total cash needed
- —
Loan-product check · same deal, 3 products live
Conventional
25% down · 7.5% · 30yr
- Down + closing
- —
- Monthly P&I
- —
- Monthly cashflow
- —
- DSCR
- —
- Eligible?
- —
Personal DTI + credit; lowest rate.
DSCR
20% down · 8.5% · 30yr
- Down + closing
- —
- Monthly P&I
- —
- Monthly cashflow
- —
- DSCR
- —
- Eligible?
- —
No personal income docs; deal must DSCR.
Hard money
10% down · 12.0% · 12mo
- Down + closing
- —
- Monthly P&I
- —
- Monthly cashflow
- —
- DSCR
- —
- Eligible?
- —
Short-term bridge; refi at stabilization.
Rent comps 40 comps
| Address | Beds | Baths | Sqft | Rent | $/sqft | DOM | Units | Dist |
|---|---|---|---|---|---|---|---|---|
| 2415 Suwanee Ln Fort Walton Beach, FL | 2.0 | 1.5 | 1250 | $1,700 | $1.36 | 43d | 1 | 0.15mi |
| 2404 Suwanee Ln Fort Walton Beach, FL | 2.0 | 1.5 | 1242 | $1,700 | $1.37 | 21d | 1 | 0.17mi |
| 2400 Suwanee Ln Fort Walton Beach, FL | 2.0 | 1.5 | 1242 | $1,700 | $1.37 | 21d | 1 | 0.18mi |
| 585 Bob Sikes Blvd Fort Walton Beach, FL | 2.0 | 1.0 | 1190 | $1,550 | $1.30 | 43d | 1 | 0.24mi |
| 589 Bob Sikes Blvd Fort Walton Beach, FL | 2.0 | 1.0 | 1190 | $1,500 | $1.26 | 43d | 1 | 0.25mi |
| 615 Bob Sikes Blvd #7 Fort Walton Beach, FL | 2.0 | 1.0 | 1190 | $1,500 | $1.26 | 13d | 1 | 0.36mi |
| 615 Bob Sikes Blvd #5 Fort Walton Beach, FL | 2.0 | 1.5 | 1190 | $1,450 | $1.22 | 43d | 1 | 0.36mi |
| 321 Woodrow St NE Fort Walton Beach, FL | 1.0–3.0 | 1.0–2.0 | 1017 | $1,850 | $1.82 | 13d | 6 | 0.40mi |
| 104 Hydac Rd Unit B Fort Walton Beach, FL | 2.0 | 1.5 | 1144 | $1,650 | $1.44 | 21d | 1 | 0.42mi |
| 106 Valencia Dr Fort Walton Beach, FL | 3.0 | 1.5 | 1320 | $1,450 | $1.10 | 21d | 1 | 0.48mi |
| 829 Jonleen Dr Fort Walton Beach, FL | 3.0 | 2.5 | 1500 | $1,995 | $1.33 | 43d | 1 | 0.51mi |
| 831 Jonleen Dr Fort Walton Beach, FL | 3.0 | 2.5 | 1500 | $1,895 | $1.26 | 43d | 1 | 0.51mi |
| 833 Jonleen Dr Fort Walton Beach, FL | 3.0 | 2.5 | 1500 | $1,895 | $1.26 | 43d | 1 | 0.53mi |
| 713 Trowbridge Ave Fort Walton Beach, FL | 3.0 | 2.0 | 1550 | $2,350 | $1.52 | 13d | 1 | 0.55mi |
| 400 Rhonda Kay Ct #66 Fort Walton Beach, FL | 3.0 | 1.5 | 1256 | $1,650 | $1.31 | 43d | 1 | 0.60mi |
| 16 Chelsea Dr NW Fort Walton Beach, FL | 4.0 | 3.0 | 2089 | $2,895 | $1.39 | 21d | 1 | 0.65mi |
| 940 Central Ave #16 Fort Walton Beach, FL | 3.0 | 2.0 | 1320 | $1,800 | $1.36 | 13d | 1 | 0.73mi |
| 204 Devon Ct Fort Walton Beach, FL | 3.0 | 2.0 | 1599 | $2,000 | $1.25 | 44d | 1 | 0.76mi |
| 712 Newport Dr Fort Walton Beach, FL | 3.0 | 1.0 | 1100 | $1,650 | $1.50 | 43d | 1 | 0.78mi |
| 422 Bear Rd Unit A Fort Walton Beach, FL | 2.0 | 1.5 | 1175 | $1,600 | $1.36 | 13d | 1 | 0.82mi |
| 508 Parkview Rd NW Fort Walton Beach, FL | 2.0 | 2.0 | 1250 | $1,575 | $1.26 | 43d | 1 | 0.86mi |
| 1102 Tiki Too Ave Fort Walton Beach, FL | 2.0 | 2.5 | 1141 | $1,600 | $1.40 | 43d | 1 | 1.03mi |
| 509 Trenton St Fort Walton Beach, FL | 4.0 | 1.5 | 1296 | $2,000 | $1.54 | 21d | 1 | 1.04mi |
| 216 Cloverdale Blvd Unit C Fort Walton Beach, FL | 2.0 | 1.5 | 1224 | $1,700 | $1.39 | 43d | 1 | 1.10mi |
| 214 Tooke St Unit A Fort Walton Beach, FL | 2.0 | 2.5 | 1144 | $1,750 | $1.53 | 43d | 1 | 1.14mi |
| 964 Southern Oaks Ct Fort Walton Beach, FL | 3.0 | 2.0 | 1315 | $2,000 | $1.52 | 43d | 1 | 1.14mi |
| 805 Hayley Marie Ct Fort Walton Beach, FL | 2.0 | 2.0 | 1095 | $1,650 | $1.51 | 43d | 1 | 1.15mi |
| 618 Country Club Ave NE Fort Walton Beach, FL | 4.0 | 2.0 | 2120 | $4,200 | $1.98 | 13d | 1 | 1.19mi |
| 348 Woodham Ct Fort Walton Beach, FL | 2.0 | 2.0 | 1251 | $2,800 | $2.24 | 43d | 1 | 1.20mi |
| 905 Piedmont Pl Fort Walton Beach, FL | 3.0 | 2.0 | 1303 | $1,695 | $1.30 | 43d | 1 | 1.22mi |
| 16 Woodham Ave Fort Walton Beach, FL | 4.0 | 3.0 | 1600 | $2,000 | $1.25 | 43d | 1 | 1.22mi |
| 121 Tooke St Fort Walton Beach, FL | 3.0 | 2.5 | 1510 | $2,000 | $1.32 | 43d | 1 | 1.23mi |
| 349 Woodham Ct Fort Walton Beach, FL | 2.0 | 1.5 | 1184 | $1,450 | $1.22 | 43d | 1 | 1.23mi |
| 337 Woodham Ct Fort Walton Beach, FL | 2.0 | 1.5 | 1184 | $1,895 | $1.60 | 21d | 1 | 1.24mi |
| 333 Woodham Ct Fort Walton Beach, FL | 2.0 | 1.5 | 1200 | $1,600 | $1.33 | 43d | 1 | 1.25mi |
| 848 Stonegate Ct Unit 848 Fort Walton Beach, FL | 2.0 | 1.5 | 1200 | $1,500 | $1.25 | 43d | 1 | 1.25mi |
| 836 Stonegate Ct #836 Fort Walton Beach, FL | 2.0 | 1.5 | 1200 | $1,500 | $1.25 | 43d | 1 | 1.26mi |
| 2100 Pomegranate Ct Fort Walton Beach, FL | 3.0 | 2.5 | 1743 | $2,025 | $1.16 | 21d | 1 | 1.30mi |
| 977 Scenic Oak Ln Fort Walton Beach, FL | 2.0 | 2.5 | 1248 | $1,650 | $1.32 | 43d | 1 | 1.32mi |
| 1839 Sod Dr Fort Walton Beach, FL | 3.0 | 2.0 | 1425 | $1,925 | $1.35 | 21d | 1 | 1.33mi |
Listing history 3 events
-
2026-06-18days on market $260,000 Active 2 DOM
-
2026-06-17remarks 699-char remark
-
2026-06-17$260,000 Active 1 DOM
ⓘ Source: listings_history table (triggers on properties + properties_extension) + one-shot
backfill from property_details.listing_events for pre-trigger history.
Tax reassessment forecast FL · Resets to sale price
- Current annual tax
- $755 · $63/mo
- Projected year-2 tax
- $2,158 · $180/mo
- Expected delta
- +$1,403/yr (+$117/mo · 185.6%)
ⓘ Screening estimate from a state-policy table — verify with the county assessor before closing.
Climate risk First Street
- Flood 1/10 Low FEMA zone X (unshaded) · 0% chance over 30 yrs
- Wildfire 1/10 Low
- Heat 10/10 Extreme 7 d/yr ≥104°F today · 22 d/yr by 30 yrs out
- Wind 9/10 Extreme 99% chance of damaging wind over 30 yrs
- Air quality 2/10 Low 1 unhealthy d/yr today · 2 by 30 yrs out
Nearby sold comps map
Loading sold comps map…
Walkable amenities ~0.75 mi
Loading nearby amenities…
Taxation est. · year 1
- Rental income
- $23,049
- − Mortgage interest
- −$14,564
- − Property taxes
- −$755
- − Insurance
- −$1,300
- − Repairs & maintenance
- −$1,844
- − Management
- −$1,844
- − Depreciation
- −$7,564
- Taxable loss
- −$4,822
- Est. tax savings @ 24.0%
- +$1,157
- After-tax cash flow
- $949/yr
For passive investors: Depreciation is non-cash, so a rental often shows a tax loss while cash-flowing — sheltering income. Rental losses are passive: they offset passive income freely, and up to $25,000/yr can offset ordinary (W-2) income if you actively participate and your MAGI is under $100k (phasing out to $0 by $150k); unused losses carry forward. On sale, claimed depreciation is recaptured at up to 25%, and gains may owe capital-gains tax (a 1031 exchange can defer both). Figures are a year-1 estimate at your 24.0% rate — not tax advice; consult a CPA.
Schools (NCES district)
- District
- Okaloosa
- NCES district ID
- 1201380
- Math proficiency
- 60% ▼ -12.00%
- Reading proficiency
- 60% ▼ -4.00%
- Median HH income
- $55,601
- Composite
- 51.62/100
- National rank
- #1705
- State rank
- #12 of 73 in FL
Livability — Wright
- Score
- 80/100
- State rank
- #117
- US rank
- #1790
Category grades
Schools grade is shown separately in the Schools card above.
Census & demographics
- Census place
- Wright, FL
- County
- Okaloosa County · 194,352 people
- City population
- 35,522
- Metro
- Crestview-Fort Walton Beach-Destin, FL
- Population (ZIP)
- 35,527
- Household income
- $70,711
- Rent vs Own
- Severe rent burden
- 1203.0
Population outlook (Okaloosa County) Hauer SSP2
- Today (2025)
- 235,133 people
- By 2030
- 253,483 · +7.8%
- By 2040
- 289,537 · +23.1%
- By 2050
- 322,954 · +37.3%
- By 2075
- 399,624 · +70.0%
- By 2100
- 425,311 · +80.9%
Race, ethnicity, and origin ACS 2023
- Neighborhood character
- Diverse neighborhood (Simpson 0.60)
- Race & ethnicity
- White 59% Hispanic / Latino 19% Two or more races 14% Black 11% Asian 3%
- Hispanic origin (detail)
- Mexican 5% Puerto Rican 3% Dominican 1%
- Common ancestry
- Slovak 2% Lithuanian 2% Scotch-Irish 2%
- Foreign-born
- 15% · Canada, Vietnam, Jamaica
- Languages at home
- 81% English-only · Spanish 14% Other Indo-European 1% Vietnamese 1%
Political lean MEDSL · Okaloosa
- 2024 margin
- Solid R (+42.4) · D 28.2% · R 70.7% · Other 1.1%
- 2008→2024 swing
- +2.5pp toward D · 2008: -44.9pp · 2024: -42.4pp
- All cycles
- 2024: R+42.4 2020: R+39.1 2016: R+47.8 2012: R+49.4 2008: R+44.9
Not yet ingested
- Civics
- —
Market trends
- HPI YoY
- ▼ -111.28%
- Current HPI
- 268.6497
- Rent YoY
- ▼ -0.13%
- Metro
- Crestview-Fort Walton Beach-Destin, FL
- State GDP YoY
- ▲ 3.28%
- F500 in state
- 36
Industry mix (Fortune 500 HQ in FL)
| Industry | F500 HQs | Revenue |
|---|---|---|
| Industrial Technology | 2 | $29B |
|
||
| Insurance | 2 | $17B |
|
||
| Retail | 1 | $60B |
|
||
| Technology Distribution | 1 | $58B |
|
||
| Homebuilding | 1 | $35B |
|
||
| Technology Manufacturing | 1 | $35B |
|
||
Price history
1 event — show timeline
- 2026-06-15 Listed $260,000 ECAR
Property tax history
+5.2%/yrLatest (2025): $755 · +4.0% YoY. Source: county tax records.
Cash-flow waterfall
monthlySold comps — $/sqft
last 12 mo · ≤1 miLoading sold comps…