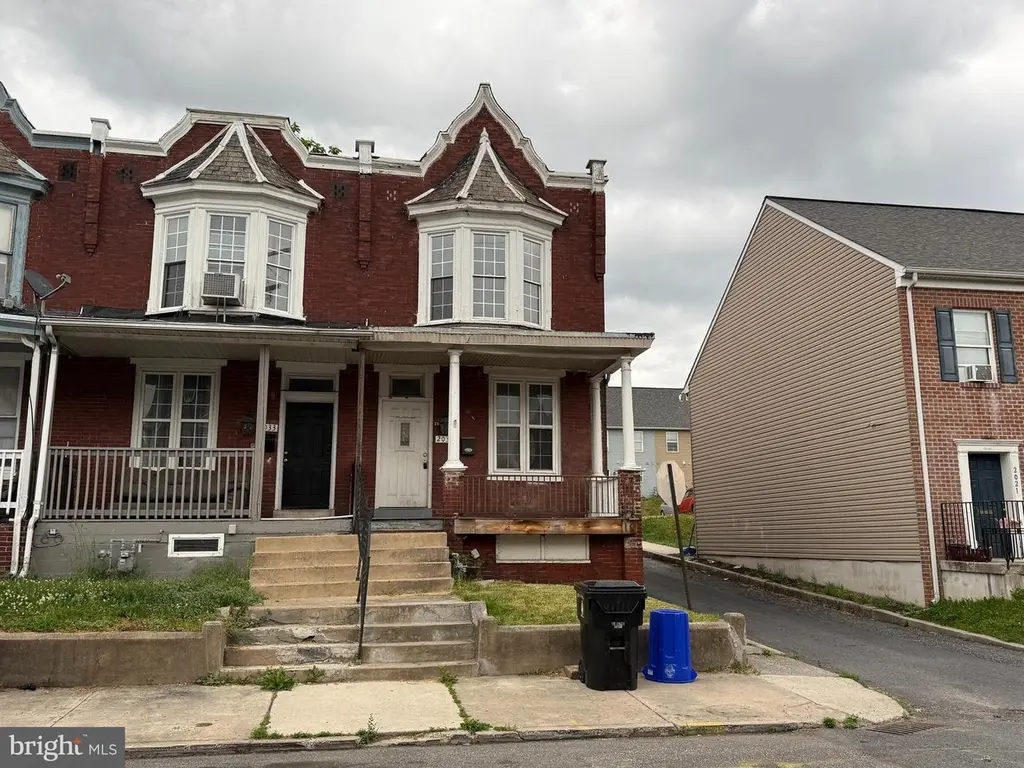
2031 N 4th St · Harrisburg, PA
Flood risk 3/10 · Minor
- FEMA flood zone
- X (unshaded)
- Chance of flooding over 30 yrs
- 0.09%
- Est. flood insurance / yr
- $473 – $860
Fire risk 1/10 · Minimal
- Est. fire insurance / yr
- $511 – $949
Heat risk 6/10 · Moderate
- Hot days now (above 101°F)
- 7 days/yr
- Hot days in 30 yrs
- 15 days/yr
Wind risk 3/10 · Minor
- Chance of severe wind over 30 yrs
- 5.0%
Air-quality risk 2/10 · Minimal
- Unhealthy air days now
- 1 days/yr
- Unhealthy air days in 30 yrs
- 3 days/yr
Risk factors via First Street. Map © Google.
Why this score? — see what drove the B grade
The composite is a weighted blend of 9 inputs, each scored 0–100. Each bar is that input's sub-score; the figure is the points it added to the 100-point composite (weight × sub-score).
- Cash flow +29.7/30.0
- ARV discount +15.0/15.0
- DSCR +10.0/10.0
- 1% rule +8.9/10.0
- Livability +4.2/5.0
- Rent growth +3.6/5.0
- Condition / age +2.5/5.0
- Schools +0.8/10.0
- Appreciation +0.0/10.0
$115,000
🖨 Deal sheet 📄 Offer letter ✓ Due diligence
Listing remarks
Great INVESTMENT or OWNER-OCCUPANCY Opportunity! Roof replaced in 2023. Conveniently located close to highway on/off ramps, public transportation, schools, shopping, Riverfront Park, the Farm Show Complex, Governor’s Mansion, and so much more, this property offers both location and potential. Step inside and you'll find a spacious first floor featuring a welcoming living room with a decorative fireplace that adds charm and character, a convenient half bath, and a generously sized dining room complete with a storage closet. The kitchen offers great functionality with a pantry closet, electric stove, refrigerator, dishwasher, microwave, and a built-in corner hutch that adds both style a
Key facts
- Decorative fireplace
- Spacious first floor
- Conveniently located
Tags
Property features AI
Finance
- Other: Fee simple ownership; Ground rent paid annually; Property condition listed as average
Exterior
- Parking: On-street parking
- Security: Building not winterized
- Utilities: 100 Amp electric service; Public water; Public sewer; Municipal trash service
- Home design: Brick construction
- Construction: Brick exterior; Brick/mortar and stone foundation
- Exterior features: End-of-row townhouse; Not in a federal flood zone; Property manager present; Above- and below-grade structures
Interior
- Kitchen: Stove; Refrigerator; Dishwasher; Microwave
- Bedrooms: 3 bedrooms on the upper level (Bedrooms 1–3 listed)
- Flooring: Hardwood; Carpet; Vinyl; Ceramic tile
- Bathrooms: 1 full bathroom (upper level); 1 half bathroom (main level)
- Heating & cooling: Forced air heating; Natural gas fuel; Electric hot water
- Interior features: Drywall walls and ceilings; Full, unfinished basement; Non-functioning fireplace (1)
- Laundry & utility: Washer/dryer hookup on lower floor
Neighborhood map
What this means for you Summary
Snapshot
- This is a 4-bed/1.0-bath townhouse listed at $115k.
Deal economics
- At list price, monthly cash flow is $419 ($5k/yr) — positive.
- The deal already cash-flows at list — no discount required.
- Meets the 1% rule at list price ($2k rent vs $115k).
- Recommended offer: $113k (1.5% below list) — sets the bar for market timing.
- Cap rate 10.7% vs local median 6.6% in Harrisburg — top-decile yield for the area; either an underpriced asset or a hidden risk that comps aren't pricing in. Stress-test before assuming the spread holds.
Location & tenants
- Location reads 84/100 on livability (#107 in PA, #826 nationally) — a professional / high-income tenant draw. Strengths: amenities A+, commute A+, cost of living A+; Watch: employment D, crime F.
- Harrisburg City SD (urban): math 6% / reading 13% proficiency, ranked #535 of 539 in PA (top 99%) — low school quality limits family demand, transient renter base, plan for 1-2y turnover; 82% free/reduced lunch — lower-income household profile, screen leases tightly.
- Zoned schools: Harrisburg Hs (math 24% / reading 10%, grade F, #399 of 437 statewide, top 92%, 1,230 students, 100% FRL) — zoned schools average 100% FRL vs 82% district-wide (18 pts higher); higher-poverty schools than district average — tighter screening recommended.
- Market conditions: Rents rising fast (+4.3%/yr); 58 active listings in the ZIP; 29 comparable units currently listed for rent nearby; rentals lingering (median 44d on market — plan ~5-8 weeks vacancy on turnover, expect pricing pressure); 59% of comp listings sitting > 30 days — soft ceiling on asking rent; 540 units permitted in Dauphin County in 2024 (194 in 5+ unit buildings).
- This rent runs 35% of the median local income ($55k/yr) — at the standard rent-burdened threshold; future hikes will face affordability resistance.
Forward outlook
- Local home prices are declining (-3.0%/yr); year-one equity from $795 of loan paydown is wiped out by about $3k of value loss. Plan a longer hold.
- At projected returns (-3.0% appreciation + 4.3% rent growth), your $32k cash investment doubles in ~7 years — after that, you're playing with house money.
Negotiation context
- It's been on market 28 days — a 2% lower offer ($113k) is reasonable based on typical stale-listing flexibility.
- 5 sale attempts since 16y ago with the ask held roughly flat each time — persistent listings suggest the price (not the market) is what's stuck; bring a comps-based counter.
- Current owner paid $41k; list at $115k implies a 180% gain — meaningful room to come down on a strong offer.
Risks & watch-outs
- Watch-outs: built in 1906 — expect roof / HVAC / electrical / plumbing capex.
- Climate carrying-cost: extreme-heat days projected 7→15/yr by 2055 (HVAC capex compounding) — expect insurance premiums to compound above CPI over the hold.
Questions for the listing agent
- Built in 1906 — when were the roof, HVAC, electrical panel, plumbing, and water heater last replaced?
- Is there a deadline driving the sale (1031 exchange, divorce, estate, relocation)? That informs how much negotiation room exists.
- Crime grade is F in this area — have there been break-ins, vandalism, or insurance claims at this property in the last 3 years? What carrier currently insures it and at what premium?
- What's the average days-on-market for RENTAL listings here right now (not sales)? A rising rental-DOM trend means longer vacancies and softer asking-rent achievability than the comps imply.
- What's the recent tenant-quality profile in this submarket — average credit score on applications, eviction rate, late-payment / NSF rate, and stable-employment percentage? A property-management company in the area should have these aggregated.
- How much new for-sale + rental construction is in the pipeline within 1–3 miles? Heavy new supply typically softens prices + rents 12–24 months out; constrained supply supports both.
Investment metrics
- 1% rule
- 1.39% ✓
- Cap rate
- 10.67%
- Cash-on-cash
- 15.62%
- DSCR
- 1.70
- GRM
- 6.0
CMA / ARV
- ARV (on-the-fly)
- $188,700
- Comps found
- 12
Show comp detail 12 sales within ~0.75 mi
| Address | Dist | Beds/Ba | Sqft | Sold | Price | $/sf | Match |
|---|---|---|---|---|---|---|---|
| 427 Muench St | 0.16mi | 5/1.0 (+1) | 1,612 (-5%) | 2mo | $112,000 | $69 | 78 |
| 215 Muench St | 0.26mi | 4/1.5 | 1,776 (+4%) | 3mo | $214,900 | $121 | 76 |
| 2119 Green St | 0.20mi | 4/2.0 | 1,600 (-6%) | 2mo | $176,000 | $110 | 75 |
| 1702 Penn St | 0.38mi | 3/1.0 (-1) | 1,680 (-1%) | 3mo | $230,000 | $137 | 73 |
| 542 Seneca St | 0.43mi | 5/1.5 (+1) | 1,722 (+1%) | 2mo | $170,000 | $99 | 69 |
| 1914 Penn St | 0.25mi | 3/2.5 (-1) | 1,599 (-6%) | 4mo | $222,000 | $139 | 64 |
| 448 Hamilton St | 0.33mi | 3/1.5 (-1) | 1,584 (-7%) | 2mo | $145,000 | $92 | 64 |
| 1717 N 3rd St | 0.31mi | 3/2.5 (-1) | 1,608 (-5%) | 2mo | $255,000 | $159 | 64 |
| 409 Emerald St | 0.27mi | 3/1.5 (-1) | 1,535 (-10%) | 4mo | $140,000 | $91 | 61 |
| 2414 Reel St | 0.44mi | 4/1.5 | 1,522 (-10%) | 3mo | $168,500 | $111 | 58 |
| 1330 Susquehanna St | 0.64mi | 4/1.5 | 1,872 (+10%) | 1mo | $190,000 | $101 | 50 |
| 2447 N 2nd St | 0.56mi | 3/1.5 (-1) | 1,540 (-9%) | 3mo | $230,000 | $149 | 48 |
Match score weights: distance 35% · size 25% · config 20% · recency 20%. Top-matched comps best support the ARV.
Projected returns pro-forma
-3.0% appreciation · 4.29% rent growth · sell at horizon
- IRR
- 8.0%
- Equity multiple
- 1.32×
- Total profit
- $10,223
- Equity at exit
- $17,147
- IRR
- 18.4%
- Equity multiple
- 2.63×
- Total profit
- $52,365
- Equity at exit
- $9,943
Cash invested: $32,200 (down + closing). Projections, not guarantees.
Landlord ↔ Tenant lean methodology
- Overall (STATE)
- 62 Landlord-Friendly
- State Pennsylvania
- 62 Landlord-Friendly · EVEN
- County
- — inherits STATE
- City
- — inherits STATE
ZIP-level market 17102
- Home prices YoY
- -3.9%
- Rents YoY
- 4.3%
- Active inventory
- 58
- Price-to-rent
- 6.0×
Monthly cashflow live
- Estimated rent
- $1,600 high interval (Pro) →
- Mortgage (P&I)
- −$603
- Tax from tax record
- −$194 /mo · $2,325/yr
- Insurance
- −$48
- HOA
- −$0
- Vacancy / Maint / Mgmt
- −$336
- Net cashflow
- $419
Break-even live
UW: 25.0% down · 7.5% · 30yr · 1.5% tax · 5.0% vac · 8.0% maint · 8.0% mgmt
Financing live
Cash to close
- Down payment
- $28,750
- Closing costs
- $3,450
- Reserves months
- —
- Total cash needed
- —
Loan-product check · same deal, 3 products live
Conventional
25% down · 7.5% · 30yr
- Down + closing
- —
- Monthly P&I
- —
- Monthly cashflow
- —
- DSCR
- —
- Eligible?
- —
Personal DTI + credit; lowest rate.
DSCR
20% down · 8.5% · 30yr
- Down + closing
- —
- Monthly P&I
- —
- Monthly cashflow
- —
- DSCR
- —
- Eligible?
- —
No personal income docs; deal must DSCR.
Hard money
10% down · 12.0% · 12mo
- Down + closing
- —
- Monthly P&I
- —
- Monthly cashflow
- —
- DSCR
- —
- Eligible?
- —
Short-term bridge; refi at stabilization.
Rent comps 29 comps
| Address | Beds | Baths | Sqft | Rent | $/sqft | DOM | Units | Dist |
|---|---|---|---|---|---|---|---|---|
| 2042 N 4th St Harrisburg, PA | 3.0 | 1.0 | 1090 | $1,400 | $1.28 | 43d | 1 | 0.05mi |
| 320 Maclay St Harrisburg, PA | 3.0 | 2.5 | 2237 | $1,750 | $0.78 | 13d | 1 | 0.10mi |
| 2118 N 4th St Harrisburg, PA | 4.0 | 1.0 | 1383 | $1,595 | $1.15 | 43d | 1 | 0.12mi |
| 1841 N 4th St Harrisburg, PA | 3.0 | 1.0 | 1376 | $1,399 | $1.02 | 23d | 1 | 0.14mi |
| 2032 Susquehanna St Harrisburg, PA | 4.0 | 1.5 | 1600 | $1,595 | $1.00 | 43d | 1 | 0.17mi |
| 1841 N 3rd St Harrisburg, PA | 3.0 | 1.0 | 1376 | $1,399 | $1.02 | 13d | 1 | 0.18mi |
| 2235 Logan St Harrisburg, PA | 3.0 | 1.0 | 1406 | $1,495 | $1.06 | 43d | 1 | 0.25mi |
| 1834 Green St Harrisburg, PA | 4.0 | 1.0 | 1792 | $1,495 | $0.83 | 23d | 1 | 0.26mi |
| 2153 Penn St Harrisburg, PA | 4.0 | 2.0 | 1620 | $1,995 | $1.23 | 43d | 1 | 0.28mi |
| 339 Emerald St Harrisburg, PA | 3.0 | 1.5 | 1420 | $1,650 | $1.16 | 13d | 1 | 0.28mi |
| 640 Kelker St Harrisburg, PA | 3.0 | 1.0 | 1294 | $1,650 | $1.28 | 43d | 1 | 0.31mi |
| 644 Kelker St Harrisburg, PA | 3.0 | 1.0 | 1294 | $1,295 | $1.00 | 43d | 1 | 0.32mi |
| 652 Emerald St Harrisburg, PA | 5.0 | 1.0 | 1550 | $1,740 | $1.12 | 43d | 1 | 0.39mi |
| 2406 Reel St Harrisburg, PA | 4.0 | 1.0 | 1500 | $1,395 | $0.93 | 43d | 1 | 0.43mi |
| 514 Radnor St Harrisburg, PA | 4.0 | 1.0 | 1498 | $1,600 | $1.07 | 43d | 1 | 0.66mi |
| 2615 Waldo St Harrisburg, PA | 3.0 | 1.0 | 1400 | $1,095 | $0.78 | 43d | 1 | 0.74mi |
| 1202 Penn St Harrisburg, PA | 4.0 | 1.0 | 1706 | $1,495 | $0.88 | 43d | 1 | 0.77mi |
| 2715 N 6th St Harrisburg, PA | 4.0 | 1.0 | 1620 | $1,650 | $1.02 | 13d | 1 | 0.81mi |
| 2728 N 6th St Harrisburg, PA | 4.0 | 2.0 | 1786 | $1,750 | $0.98 | 13d | 1 | 0.84mi |
| 919 Penn St Harrisburg, PA | 3.0 | 2.0 | 1458 | $1,795 | $1.23 | 23d | 1 | 0.91mi |
| 2801 N 2nd St Apt A2 Harrisburg, PA | 3.0 | 1.5 | 1200 | $1,495 | $1.25 | 43d | 1 | 0.93mi |
| 616 N Front St Lemoyne, PA | 3.0 | 1.0 | 1408 | $1,650 | $1.17 | 43d | 1 | 1.36mi |
| 52 Balm St Harrisburg, PA | 3.0 | 1.0 | 1950 | $1,495 | $0.77 | 21d | 1 | 1.38mi |
| 400 W Crestwood Dr Camp Hill, PA | 1.0–3.0 | 1.0–2.0 | 1042 | $2,071 | $1.99 | 13d | 14 | 1.40mi |
| 21 Summit St Harrisburg, PA | 3.0 | 1.0 | 1200 | $1,550 | $1.29 | 13d | 1 | 1.41mi |
| 3216 Green St Harrisburg, PA | 4.0 | 2.0 | 1550 | $2,200 | $1.42 | 13d | 1 | 1.45mi |
| 1251 Bailey St Harrisburg, PA | 3.0 | 1.0 | 1200 | $1,500 | $1.25 | 43d | 1 | 1.46mi |
| 1517 Walnut St Harrisburg, PA | 3.0 | 1.0 | 1172 | $1,150 | $0.98 | 43d | 1 | 1.48mi |
| 1207 Market St Harrisburg, PA | 4.0 | 1.5 | 1423 | $1,995 | $1.40 | 43d | 1 | 1.48mi |
Listing history 32 events
-
2026-06-18days on market $115,000 Active 28 DOM
-
2026-06-17days on market $115,000 Active 27 DOM
-
2026-06-16days on market $115,000 Active 26 DOM
-
2026-06-15days on market $115,000 Active 25 DOM
-
2026-06-14days on market $115,000 Active 23 DOM
-
2026-06-13days on market $115,000 Active 22 DOM
-
2026-06-10days on market $115,000 Active 20 DOM
-
2026-06-09days on market $115,000 Active 19 DOM
-
2026-06-08days on market $115,000 Active 18 DOM
-
2026-06-07days on market $115,000 Active 17 DOM
-
2026-06-03days on market $115,000 Active 13 DOM
-
2026-06-02days on market $115,000 Active 12 DOM
-
2026-06-01days on market $115,000 Active 11 DOM
-
2026-05-31days on market $115,000 Active 10 DOM
-
2026-05-31days on market $115,000 Active 9 DOM
-
2026-05-21$119,000 Active
-
2025-11-17historical
-
2025-10-11price $134,700
-
2025-09-29price $136,500
-
2025-08-25$139,500 Active
-
2025-06-03historical
-
2025-04-22price $144,500
-
2025-03-27price $149,500
-
2025-03-12$155,000 Active
-
2020-07-20soldstatus $41,000 Closed
-
2020-06-23status Pending
-
2020-06-17$44,900 Active
-
2010-08-26soldstatus $26,000
-
2010-07-27historical
-
2010-05-06$29,900
-
1998-10-28soldstatus $50,000
-
1995-07-07soldstatus $12,000
ⓘ Source: listings_history table (triggers on properties + properties_extension) + one-shot
backfill from property_details.listing_events for pre-trigger history.
Tax reassessment forecast PA · Partial reset (capped growth)
- Current annual tax
- $2,325 · $194/mo
- Projected year-2 tax
- $2,325 · $194/mo
- Expected delta
- $0/yr ($0/mo · 0.0%)
ⓘ Screening estimate from a state-policy table — verify with the county assessor before closing.
Climate risk First Street
- Flood 3/10 Moderate FEMA zone X (unshaded) · 9% chance over 30 yrs
- Wildfire 1/10 Low
- Heat 6/10 Major 7 d/yr ≥101°F today · 15 d/yr by 30 yrs out
- Wind 3/10 Moderate 5% chance of damaging wind over 30 yrs
- Air quality 2/10 Low 1 unhealthy d/yr today · 3 by 30 yrs out
Nearby sold comps map
Loading sold comps map…
Walkable amenities ~0.75 mi
Loading nearby amenities…
Taxation est. · year 1
- Rental income
- $19,199
- − Mortgage interest
- −$6,442
- − Property taxes
- −$2,325
- − Insurance
- −$575
- − Repairs & maintenance
- −$1,536
- − Management
- −$1,536
- − Depreciation
- −$3,345
- Taxable income
- $3,440
- Est. tax owed @ 24.0%
- −$826
- After-tax cash flow
- $4,205/yr
For passive investors: Depreciation is non-cash, so a rental often shows a tax loss while cash-flowing — sheltering income. Rental losses are passive: they offset passive income freely, and up to $25,000/yr can offset ordinary (W-2) income if you actively participate and your MAGI is under $100k (phasing out to $0 by $150k); unused losses carry forward. On sale, claimed depreciation is recaptured at up to 25%, and gains may owe capital-gains tax (a 1031 exchange can defer both). Figures are a year-1 estimate at your 24.0% rate — not tax advice; consult a CPA.
Schools (NCES district)
- District
- Harrisburg City SD
- NCES district ID
- 4211580
- Math proficiency
- 6% ▼ -6.00%
- Reading proficiency
- 13% ▼ -10.00%
- Median HH income
- $33,432
- Composite
- 7.6/100
- National rank
- #9945
- State rank
- #535 of 539 in PA
Livability — Harrisburg
- Score
- 84/100
- State rank
- #107
- US rank
- #826
Category grades
Schools grade is shown separately in the Schools card above.
Census & demographics
- Census place
- Harrisburg, PA
- County
- Dauphin County · 247,857 people
- City population
- 184,296
- Metro
- Harrisburg-Carlisle, PA
- Population (ZIP)
- 8,118
- Household income
- $54,573
- Rent vs Own
- Severe rent burden
- 720.0
Population outlook (Dauphin County) Hauer SSP2
- Today (2025)
- 281,628 people
- By 2030
- 283,549 · +0.7%
- By 2040
- 285,385 · +1.3%
- By 2050
- 286,188 · +1.6%
- By 2075
- 291,053 · +3.3%
- By 2100
- 282,374 · +0.3%
Race, ethnicity, and origin ACS 2023
- Neighborhood character
- Diverse neighborhood (Simpson 0.62)
- Race & ethnicity
- White 54% Black 25% Hispanic / Latino 14% Two or more races 7% Asian 2%
- Hispanic origin (detail)
- Mexican 1% Puerto Rican 8% Dominican 2%
- Common ancestry
- Romanian 5% Italian 2% Lithuanian 2%
- Foreign-born
- 7% · Canada, Vietnam, South Korea
- Languages at home
- 86% English-only · Spanish 9% Arabic 1% Other Asian/Pacific 1%
Political lean MEDSL · Dauphin
- 2024 margin
- Lean D (+5.9) · D 52.4% · R 46.5% · Other 1.1%
- 2008→2024 swing
- -3.1pp toward R · 2008: 9.1pp · 2024: 5.9pp
- All cycles
- 2024: D+5.9 2020: D+8.5 2016: D+2.8 2012: D+6.0 2008: D+9.1
Not yet ingested
- Civics
- —
Market trends
- HPI YoY
- ▼ -18.43%
- Current HPI
- 451.4739
- Rent YoY
- ▲ 4.29%
- Metro
- Harrisburg-Carlisle, PA
- State GDP YoY
- ▲ 1.68%
- F500 in state
- 34
Industry mix (Fortune 500 HQ in PA)
| Industry | F500 HQs | Revenue |
|---|---|---|
| Healthcare | 2 | $309B |
|
||
| Insurance | 2 | $27B |
|
||
| Telecommunications / Media | 1 | $124B |
|
||
| Industrial Distribution | 1 | $22B |
|
||
| Financial Services | 1 | $20B |
|
||
| Chemicals / Materials | 1 | $18B |
|
||
Price history
+891.7% since first listed17 events — show timeline
- 2026-05-21 Listed $119,000 BRIGHT MLS
- 2025-11-17 Listing Removed — BRIGHT MLS
- 2025-10-11 Price Changed $134,700 BRIGHT MLS
- 2025-09-29 Price Changed $136,500 BRIGHT MLS
- 2025-08-25 Listed $139,500 BRIGHT MLS
- 2025-06-03 Listing Removed — BRIGHT MLS
- 2025-04-22 Price Changed $144,500 BRIGHT MLS
- 2025-03-27 Price Changed $149,500 BRIGHT MLS
- 2025-03-12 Listed $155,000 BRIGHT MLS
- 2020-07-20 Sold (MLS) $41,000 BRIGHT MLS
- 2020-06-23 Pending — BRIGHT MLS
- 2020-06-17 Listed $44,900 BRIGHT MLS
- 2010-08-26 Sold (MLS) $26,000 BRIGHT MLS
- 2010-07-27 Listing Removed — BRIGHT MLS
- 2010-05-06 Listed $29,900 BRIGHT MLS
- 1998-10-28 Sold (Public Records) $50,000 Public Records
- 1995-07-07 Sold (Public Records) $12,000 Public Records
Property tax history
+1.0%/yrLatest (2026): $2,325 · +1.6% YoY. Source: county tax records.
Cash-flow waterfall
monthlySold comps — $/sqft
last 12 mo · ≤1 miLoading sold comps…