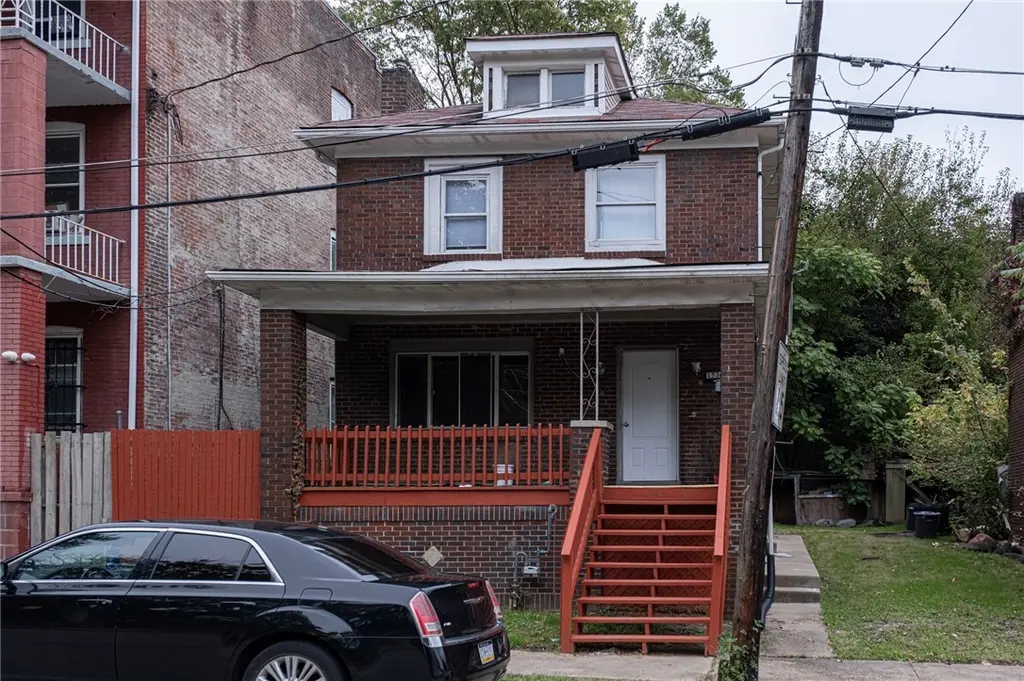
1536 Hunter St · Wilkinsburg, PA
Flood risk 7/10 · Major
- FEMA flood zone
- X (unshaded)
- Chance of flooding over 30 yrs
- 0.77%
- Est. flood insurance / yr
- $473 – $860
Fire risk 1/10 · Minimal
- Est. fire insurance / yr
- $511 – $949
Heat risk 4/10 · Minor
- Hot days now (above 96°F)
- 7 days/yr
- Hot days in 30 yrs
- 17 days/yr
Wind risk 2/10 · Minimal
- Chance of severe wind over 30 yrs
- 0.0%
Air-quality risk 4/10 · Minor
- Unhealthy air days now
- 4 days/yr
- Unhealthy air days in 30 yrs
- 5 days/yr
Risk factors via First Street. Map © Google.
Why this score? — see what drove the B- grade
The composite is a weighted blend of 9 inputs, each scored 0–100. Each bar is that input's sub-score; the figure is the points it added to the 100-point composite (weight × sub-score).
- Cash flow +30.0/30.0
- 1% rule +10.0/10.0
- DSCR +10.0/10.0
- ARV discount +7.5/15.0
- Livability +3.8/5.0
- Rent growth +3.5/5.0
- Condition / age +2.5/5.0
- Schools +1.5/10.0
- Appreciation +0.0/10.0
$95,000
🖨 Deal sheet 📄 Offer letter ✓ Due diligence
Listing remarks MLS
1536 Hunter St in the heart of Wilkinsburg offers major potential for the right buyer. Minutes from the parkway, shopping, and Hunter Park! Public transportation is conveniently close to the home.
Key facts
- Heart of wilkinsburg
- Close to hunter park
- 1,481 sq ft lot
Tags
Neighborhood map
What this means for you Summary
Snapshot
- This is a 3-bed/1.0-bath single-family listed at $95k.
Deal economics
- At list price, monthly cash flow is $516 ($6k/yr) — positive.
- The deal already cash-flows at list — no discount required.
- Meets the 1% rule at list price ($2k rent vs $95k).
- Recommended offer: $84k (12.0% below list) — sets the bar for market timing.
Location & tenants
- Location reads 76/100 on livability (#411 in PA, #3,754 nationally) — a middle-class / working-renter tenant base. Strengths: commute A+, cost of living A+, housing A+; Watch: schools D+, health & safety D+, crime F.
- Wilkinsburg Borough SD (suburban): math 14% / reading 23% proficiency, ranked #503 of 539 in PA (top 93%) — low school quality limits family demand, transient renter base, plan for 1-2y turnover; 96% free/reduced lunch — lower-income household profile, screen leases tightly.
- Market conditions: Rents rising (+3.9%/yr); 118 active listings in the ZIP; 19 comparable units currently listed for rent nearby; rentals at typical pace (median 24d on market — plan ~3-4 weeks tenant-placement turnaround); 2,996 units permitted in Allegheny County in 2024 (1,588 in 5+ unit buildings).
- This rent runs 34% of the median local income ($55k/yr) — at the standard rent-burdened threshold; future hikes will face affordability resistance.
Forward outlook
- Local home prices are declining (-3.0%/yr); year-one equity from $657 of loan paydown is wiped out by about $3k of value loss. Plan a longer hold.
- At projected returns (-3.0% appreciation + 3.9% rent growth), your $27k cash investment doubles in ~5 years — after that, you're playing with house money.
Negotiation context
- It's been on market 195 days — a 12% lower offer ($84k) is reasonable based on typical stale-listing flexibility.
- 8 sale attempts since 22y ago; this cycle's ask has dropped $20k (17%) from the opening price — seller is motivated, your offer sets the floor, not the list.
- Current owner paid $5k; list at $95k implies a 1965% gain — meaningful room to come down on a strong offer.
Risks & watch-outs
- Watch-outs: flood insurance adds $56/mo; built in 1920 — expect roof / HVAC / electrical / plumbing capex.
- Climate carrying-cost: major flood risk — expect insurance premiums to compound above CPI over the hold.
Questions for the listing agent
- It's been on market 195 days. Have you received any prior offers? Is the seller open to a 12% concession, seller financing, or rate buy-down credit?
- Built in 1920 — when were the roof, HVAC, electrical panel, plumbing, and water heater last replaced?
- What's the actual annual flood-insurance premium (NFIP or private), and is the property in a SFHA with mandatory coverage?
- Why hasn't it sold? Are there any deal-killer items the seller is aware of (foundation, flood, title, zoning, code violations)?
- Is there a deadline driving the sale (1031 exchange, divorce, estate, relocation)? That informs how much negotiation room exists.
- Schools are D-rated, which usually means shorter tenancies and higher turnover. Who's the typical renter profile here, and what's been the actual vacancy rate?
- Crime grade is F in this area — have there been break-ins, vandalism, or insurance claims at this property in the last 3 years? What carrier currently insures it and at what premium?
- What's the average days-on-market for RENTAL listings here right now (not sales)? A rising rental-DOM trend means longer vacancies and softer asking-rent achievability than the comps imply.
- What's the recent tenant-quality profile in this submarket — average credit score on applications, eviction rate, late-payment / NSF rate, and stable-employment percentage? A property-management company in the area should have these aggregated.
- How much new for-sale + rental construction is in the pipeline within 1–3 miles? Heavy new supply typically softens prices + rents 12–24 months out; constrained supply supports both.
Investment metrics
- 1% rule
- 1.65% ✓
- Cap rate
- 13.51%
- Cash-on-cash
- 25.76%
- DSCR
- 2.15
- GRM
- 5.1
CMA / ARV
- ARV (median comp)
- $45,384
- List price
- $95,000
- Delta
- 109.32%
- Verdict
- OVERPRICED
- Comps
- 20 within 1.0 mi
Show comp detail 12 sales within ~0.75 mi
| Address | Dist | Beds/Ba | Sqft | Sold | Price | $/sf | Match |
|---|---|---|---|---|---|---|---|
| 1019 Maple St | 0.05mi | 3/1.5 | 1,268 (+6%) | 1mo | $23,000 | $18 | 86 |
| 1358 Laketon Rd | 0.14mi | 3/2.5 | 1,160 (-3%) | 8mo | $145,000 | $125 | 76 |
| 1501 Laketon Rd | 0.23mi | 3/1.5 | 1,218 (+2%) | 12mo | $130,000 | $107 | 75 |
| 1608 Clark St | 0.30mi | 3/1.0 | 1,170 (-2%) | 9mo | $62,500 | $53 | 74 |
| 1462 Elm St | 0.34mi | 3/1.0 | 1,232 (+3%) | 10mo | $157,000 | $127 | 72 |
| 1216 Morrow St | 0.71mi | 3/1.0 | 1,176 (-2%) | 3mo | $45,000 | $38 | 61 |
| 8363 Bricelyn St | 0.65mi | 3/1.0 | 1,152 (-4%) | 10mo | $12,500 | $11 | 54 |
| 1959 Robinson Blvd | 0.46mi | 3/1.5 | 1,085 (-10%) | 11mo | $55,000 | $51 | 51 |
| 7807 Kelly St | 0.75mi | 3/1.0 | 1,288 (+7%) | 9mo | $63,000 | $49 | 46 |
| 2022 Boggs Ave | 0.75mi | 3/1.5 | 1,284 (+7%) | 10mo | $158,000 | $123 | 43 |
| 623 Haverhill St | 0.51mi | 3/2.5 | 1,374 (+14%) | 5mo | $137,500 | $100 | 42 |
| 615 Midland St | 0.64mi | 3/1.0 | 1,356 (+13%) | 10mo | $160,000 | $118 | 40 |
Match score weights: distance 35% · size 25% · config 20% · recency 20%. Top-matched comps best support the ARV.
Projected returns pro-forma
-3.0% appreciation · 3.86% rent growth · sell at horizon
- IRR
- 17.4%
- Equity multiple
- 1.71×
- Total profit
- $18,865
- Equity at exit
- $14,165
- IRR
- 26.5%
- Equity multiple
- 3.43×
- Total profit
- $64,655
- Equity at exit
- $8,214
Cash invested: $26,600 (down + closing). Projections, not guarantees.
Landlord ↔ Tenant lean methodology
- Overall (STATE)
- 62 Landlord-Friendly
- State Pennsylvania
- 62 Landlord-Friendly · EVEN
- County
- — inherits STATE
- City
- — inherits STATE
ZIP-level market 15221
- Home prices YoY
- -32.3%
- Rents YoY
- 3.9%
- Active inventory
- 118
- Price-to-rent
- 5.1×
Monthly cashflow live
- Estimated rent
- $1,563 high interval (Pro) →
- Mortgage (P&I)
- −$498
- Tax from tax record
- −$126 /mo · $1,514/yr
- Insurance
- −$40
- Flood insurance flood zone
- −$56 /mo · $666/yr
- HOA
- −$0
- Vacancy / Maint / Mgmt
- −$328
- Net cashflow
- $516
Break-even live
UW: 25.0% down · 7.5% · 30yr · 1.5% tax · 5.0% vac · 8.0% maint · 8.0% mgmt
Financing live
Cash to close
- Down payment
- $23,750
- Closing costs
- $2,850
- Reserves months
- —
- Total cash needed
- —
Loan-product check · same deal, 3 products live
Conventional
25% down · 7.5% · 30yr
- Down + closing
- —
- Monthly P&I
- —
- Monthly cashflow
- —
- DSCR
- —
- Eligible?
- —
Personal DTI + credit; lowest rate.
DSCR
20% down · 8.5% · 30yr
- Down + closing
- —
- Monthly P&I
- —
- Monthly cashflow
- —
- DSCR
- —
- Eligible?
- —
No personal income docs; deal must DSCR.
Hard money
10% down · 12.0% · 12mo
- Down + closing
- —
- Monthly P&I
- —
- Monthly cashflow
- —
- DSCR
- —
- Eligible?
- —
Short-term bridge; refi at stabilization.
Rent comps 19 comps
| Address | Beds | Baths | Sqft | Rent | $/sqft | DOM | Units | Dist |
|---|---|---|---|---|---|---|---|---|
| 1713-1715 Clark St Unit 79-1804C Pittsburgh, PA | 2.0 | 1.0 | 972 | $1,200 | $1.23 | 4d | 1 | 0.36mi |
| 1515 Penn Ave Wilkinsburg, PA | 2.0 | 2.0 | 1012 | $1,100 | $1.09 | 43d | 1 | 0.50mi |
| 7534 Penn Bridge Ct Pittsburgh, PA | 2.0 | 2.0 | 1259 | $1,750 | $1.39 | 43d | 1 | 0.73mi |
| 515 Rebecca Ave Unit 515D Pittsburgh, PA | 2.0 | 1.0 | 850 | $1,310 | $1.54 | 7d | 1 | 0.75mi |
| 565 Ardmore Blvd Pittsburgh, PA | 4.0 | 1.0 | 1368 | $1,450 | $1.06 | 10d | 1 | 0.76mi |
| 2031 Chalfant St Pittsburgh, PA | 3.0 | 1.5 | 1150 | $1,950 | $1.70 | 43d | 1 | 0.77mi |
| 7215 Beacon Hill Dr Pittsburgh, PA | 2.0 | 2.0 | 1259 | $1,795 | $1.43 | 4d | 1 | 0.80mi |
| 600 Kelly Ave Pittsburgh, PA | 1.0–2.0 | 1.0 | 968 | $1,350 | $1.39 | 3d | 3 | 0.80mi |
| 826 Walnut St Pittsburgh, PA | 2.0 | 1.0 | 1270 | $1,195 | $0.94 | 43d | 1 | 0.83mi |
| 519-521 S Trenton Ave Pittsburgh, PA | 3.0 | 1.5 | 1360 | $2,600 | $1.91 | 16d | 1 | 0.95mi |
| 100 Bryn Mawr Ct W Pittsburgh, PA | 1.0–2.0 | 1.0–2.0 | 975 | $1,904 | $1.95 | 3d | 15 | 1.01mi |
| 8918 Frankstown Rd Pittsburgh, PA | 3.0 | 1.0 | 1400 | $1,907 | $1.36 | 14d | 1 | 1.02mi |
| 407 Biddle Ave #3 Pittsburgh, PA | 3.0 | 1.0 | 1200 | $1,700 | $1.42 | 43d | 1 | 1.03mi |
| 1250 Blackadore Ave Pittsburgh, PA | 3.0 | 1.0 | 1440 | $1,750 | $1.22 | 23d | 1 | 1.03mi |
| 8612 Oakcrest Rd Pittsburgh, PA | 2.0 | 1.0 | 1218 | $1,450 | $1.19 | 23d | 1 | 1.16mi |
| 233-241 Edgewood Ave Unit B06 Pittsburgh, PA | 2.0 | 1.0 | 726 | $1,250 | $1.72 | 23d | 1 | 1.20mi |
| 233-241 Edgewood Ave Unit B10 Pittsburgh, PA | 2.0 | 1.0 | 726 | $1,250 | $1.72 | 43d | 1 | 1.20mi |
| 185 Howard St Pittsburgh, PA | 2.0 | 1.0 | 1000 | $1,250 | $1.25 | 43d | 1 | 1.40mi |
| 648 Southern Ave Penn Hills, PA | 3.0 | 1.0 | 1100 | $1,600 | $1.45 | 7d | 1 | 1.43mi |
Listing history 15 events
-
2026-05-05status Pending 196-char remark
Show marketing remark (196 chars)
1536 Hunter St in the heart of Wilkinsburg offers major potential for the right buyer. Minutes from the parkway, shopping, and Hunter Park! Public transportation is conveniently close to the home.
-
2026-04-30price $95,000 196-char remark
Show marketing remark (196 chars)
1536 Hunter St in the heart of Wilkinsburg offers major potential for the right buyer. Minutes from the parkway, shopping, and Hunter Park! Public transportation is conveniently close to the home.
-
2026-03-23price $100,000 196-char remark
Show marketing remark (196 chars)
1536 Hunter St in the heart of Wilkinsburg offers major potential for the right buyer. Minutes from the parkway, shopping, and Hunter Park! Public transportation is conveniently close to the home.
-
2026-03-14status Active 196-char remark
Show marketing remark (196 chars)
1536 Hunter St in the heart of Wilkinsburg offers major potential for the right buyer. Minutes from the parkway, shopping, and Hunter Park! Public transportation is conveniently close to the home.
-
2026-02-05historical Contingent 196-char remark
Show marketing remark (196 chars)
1536 Hunter St in the heart of Wilkinsburg offers major potential for the right buyer. Minutes from the parkway, shopping, and Hunter Park! Public transportation is conveniently close to the home.
-
2026-01-17status Active 196-char remark
Show marketing remark (196 chars)
1536 Hunter St in the heart of Wilkinsburg offers major potential for the right buyer. Minutes from the parkway, shopping, and Hunter Park! Public transportation is conveniently close to the home.
-
2025-11-24price $105,000 196-char remark
Show marketing remark (196 chars)
1536 Hunter St in the heart of Wilkinsburg offers major potential for the right buyer. Minutes from the parkway, shopping, and Hunter Park! Public transportation is conveniently close to the home.
-
2025-11-06status Active 196-char remark
Show marketing remark (196 chars)
1536 Hunter St in the heart of Wilkinsburg offers major potential for the right buyer. Minutes from the parkway, shopping, and Hunter Park! Public transportation is conveniently close to the home.
-
2025-10-24historical Contingent 196-char remark
Show marketing remark (196 chars)
1536 Hunter St in the heart of Wilkinsburg offers major potential for the right buyer. Minutes from the parkway, shopping, and Hunter Park! Public transportation is conveniently close to the home.
-
2025-10-19$115,000 Active 196-char remark
Show marketing remark (196 chars)
1536 Hunter St in the heart of Wilkinsburg offers major potential for the right buyer. Minutes from the parkway, shopping, and Hunter Park! Public transportation is conveniently close to the home.
-
2013-09-19$30,000 188-char remark
Show marketing remark (188 chars)
THIS 3BR 1 BA BRICK HOME HAS A NEWER ROOF (5) YRS OLD, NEWER WINDOWS & CARPET. THIS IS TENANT OCCUPIED SEC 8.NICE PARK ACROSS THE STREET. GREAT FOR INVESTOR OG SINGLE FAMILY MUST SEE
-
2013-01-17$30,000
-
2010-04-16$39,000
-
2004-04-28soldstatus $4,600
-
2004-02-25$4,600
ⓘ Source: listings_history table (triggers on properties + properties_extension) + one-shot
backfill from property_details.listing_events for pre-trigger history.
Tax reassessment forecast PA · Partial reset (capped growth)
- Current annual tax
- $1,514 · $126/mo
- Projected year-2 tax
- $1,514 · $126/mo
- Expected delta
- $0/yr ($0/mo · 0.0%)
ⓘ Screening estimate from a state-policy table — verify with the county assessor before closing.
Climate risk First Street
- Flood 7/10 Severe FEMA zone X (unshaded) · 77% chance over 30 yrs
- Wildfire 1/10 Low
- Heat 4/10 Moderate 7 d/yr ≥96°F today · 17 d/yr by 30 yrs out
- Wind 2/10 Low 0% chance of damaging wind over 30 yrs
- Air quality 4/10 Moderate 4 unhealthy d/yr today · 5 by 30 yrs out
Nearby sold comps map
Loading sold comps map…
Walkable amenities ~0.75 mi
Loading nearby amenities…
Taxation est. · year 1
- Rental income
- $18,759
- − Mortgage interest
- −$5,321
- − Property taxes
- −$1,514
- − Insurance
- −$1,142
- − Repairs & maintenance
- −$1,501
- − Management
- −$1,501
- − Depreciation
- −$2,764
- Taxable income
- $5,017
- Est. tax owed @ 24.0%
- −$1,204
- After-tax cash flow
- $4,982/yr
For passive investors: Depreciation is non-cash, so a rental often shows a tax loss while cash-flowing — sheltering income. Rental losses are passive: they offset passive income freely, and up to $25,000/yr can offset ordinary (W-2) income if you actively participate and your MAGI is under $100k (phasing out to $0 by $150k); unused losses carry forward. On sale, claimed depreciation is recaptured at up to 25%, and gains may owe capital-gains tax (a 1031 exchange can defer both). Figures are a year-1 estimate at your 24.0% rate — not tax advice; consult a CPA.
Schools (NCES district)
- District
- Wilkinsburg Borough SD
- NCES district ID
- 4226370
- Math proficiency
- 14% ▼ -8.00%
- Reading proficiency
- 23% ▼ -9.00%
- Median HH income
- $32,204
- Composite
- 14.94/100
- National rank
- #9368
- State rank
- #503 of 539 in PA
Livability — Wilkinsburg
- Score
- 76/100
- State rank
- #411
- US rank
- #3754
Category grades
Schools grade is shown separately in the Schools card above.
Census & demographics
- Census place
- Wilkinsburg, PA
- County
- Allegheny County · 1,022,028 people
- City population
- 29,513
- Metro
- Pittsburgh, PA
- Population (ZIP)
- 29,374
- Household income
- $55,028
- Rent vs Own
- Severe rent burden
- 1933.0
Population outlook (Allegheny County) Hauer SSP2
- Today (2025)
- 1,250,282 people
- By 2030
- 1,256,482 · +0.5%
- By 2040
- 1,256,318 · +0.5%
- By 2050
- 1,244,169 · -0.5%
- By 2075
- 1,197,693 · -4.2%
- By 2100
- 1,093,187 · -12.6%
Race, ethnicity, and origin ACS 2023
- Neighborhood character
- Diverse neighborhood (Simpson 0.60)
- Race & ethnicity
- White 47% Black 43% Two or more races 7% Hispanic / Latino 4% Asian 1%
- Common ancestry
- Romanian 4% Lithuanian 2% Serbian 1%
- Foreign-born
- 4% · Canada, South Korea, China
- Languages at home
- 93% English-only · Spanish 2% French/Haitian/Cajun 1% Other Indo-European 1%
Political lean MEDSL · Allegheny
- 2024 margin
- Strong D (+20.3) · D 59.7% · R 39.4%
- 2008→2024 swing
- +4.8pp toward D · 2008: 15.5pp · 2024: 20.3pp
- All cycles
- 2024: D+20.3 2020: D+20.4 2016: D+16.4 2012: D+14.4 2008: D+15.5
Not yet ingested
- Civics
- —
Market trends
- HPI YoY
- ▼ -109.77%
- Current HPI
- 230.0486
- Rent YoY
- ▲ 3.86%
- Metro
- Pittsburgh, PA
- State GDP YoY
- ▲ 1.68%
- F500 in state
- 34
Industry mix (Fortune 500 HQ in PA)
| Industry | F500 HQs | Revenue |
|---|---|---|
| Healthcare | 2 | $309B |
|
||
| Insurance | 2 | $27B |
|
||
| Telecommunications / Media | 1 | $124B |
|
||
| Industrial Distribution | 1 | $22B |
|
||
| Financial Services | 1 | $20B |
|
||
| Chemicals / Materials | 1 | $18B |
|
||
Price history
+1965.2% since first listed15 events — show timeline
- 2026-05-05 Pending — West Penn MLS
- 2026-04-30 Price Changed $95,000 West Penn MLS
- 2026-03-23 Price Changed $100,000 West Penn MLS
- 2026-03-14 Relisted — West Penn MLS
- 2026-02-05 Contingent — West Penn MLS
- 2026-01-17 Relisted — West Penn MLS
- 2025-11-24 Price Changed $105,000 West Penn MLS
- 2025-11-06 Relisted — West Penn MLS
- 2025-10-24 Contingent — West Penn MLS
- 2025-10-19 Listed $115,000 West Penn MLS
- 2013-09-19 Listed $30,000 West Penn MLS
- 2013-01-17 Listed $30,000 West Penn MLS
- 2010-04-16 Listed $39,000 West Penn MLS
- 2004-04-28 Sold (MLS) $4,600 West Penn MLS
- 2004-02-25 Listed $4,600 West Penn MLS
Property tax history
-0.6%/yrLatest (2026): $1,514 · +3.0% YoY. Source: county tax records.
Cash-flow waterfall
monthlySold comps — $/sqft
last 12 mo · ≤1 miLoading sold comps…