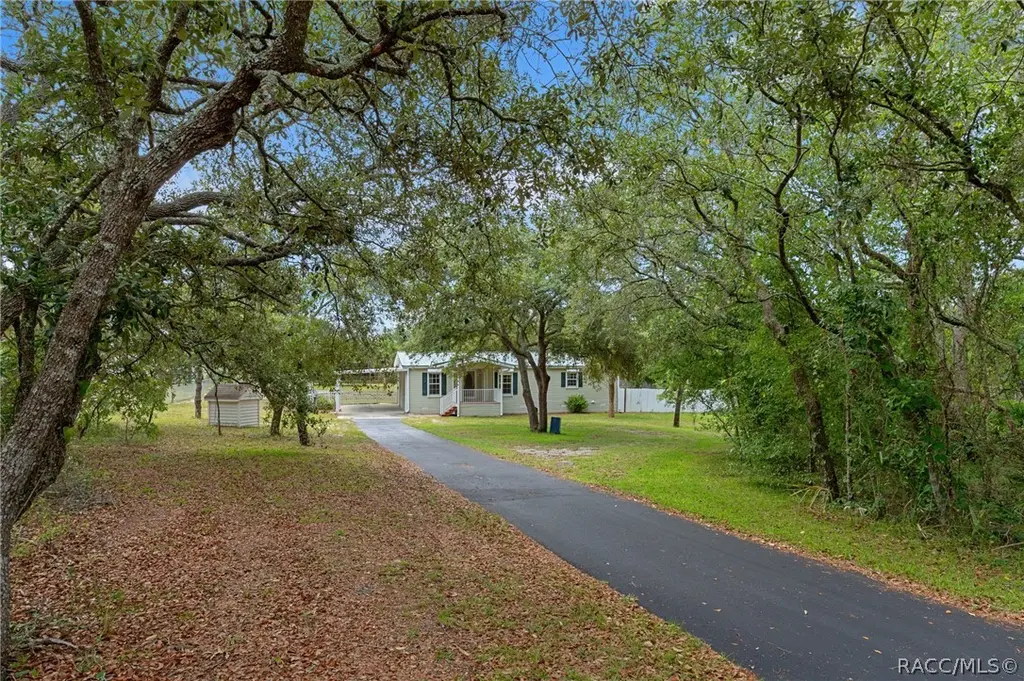
5290 W Rochelle St · Homosassa Springs, FL
Flood risk 1/10 · Minimal
- FEMA flood zone
- X (unshaded)
- Chance of flooding over 30 yrs
- 0.0%
- Est. flood insurance / yr
- $507 – $1,088
Fire risk 6/10 · Moderate
- Est. fire insurance / yr
- $947 – $1,759
Heat risk 10/10 · Severe
- Hot days now (above 108°F)
- 7 days/yr
- Hot days in 30 yrs
- 25 days/yr
Wind risk 9/10 · Severe
- Chance of severe wind over 30 yrs
- 99.0%
Air-quality risk 1/10 · Minimal
- Unhealthy air days now
- 0 days/yr
- Unhealthy air days in 30 yrs
- 0 days/yr
Risk factors via First Street. Map © Google.
Why this score? — see what drove the C grade
The composite is a weighted blend of 9 inputs, each scored 0–100. Each bar is that input's sub-score; the figure is the points it added to the 100-point composite (weight × sub-score).
- Cash flow +21.0/30.0
- ARV discount +14.0/15.0
- DSCR +6.7/10.0
- 1% rule +4.2/10.0
- Schools +4.1/10.0
- Livability +3.6/5.0
- Rent growth +2.5/5.0
- Condition / age +2.5/5.0
- Appreciation +0.0/10.0
$214,777
🖨 Deal sheet 📄 Offer letter ✓ Due diligence
Listing remarks MLS
One or more photo(s) has been virtually staged. Country living with modern efficiency! Situated on a beautiful 1-acre parcel in Homosassa, this well-maintained 2005 home offers 3 bedrooms, 2 bathrooms, and 1,569 square feet of comfortable living space with valuable updates already completed. Enjoy reduced utility costs with paid-in-full solar panels installed in 2021 and the added benefit of a private well, eliminating monthly water bills. Major improvements include a new metal roof-over (2025), stainless-steel kitchen appliances (2026), water heater (2023), and HVAC system (2020), providing peace of mind for years to come. Outdoor living is a highlight with an inviting 8' x 10' front porch, spacious 12' x 26' enclosed lanai, attached 15' x 30' carport, hurricane shutters, and multiple sheds and outbuildings offering exceptional storage, workshop, hobby, or equipment space. With no deed restrictions, you'll have the freedom to bring your boats, trailers, RVs, recreational vehicles, and outdoor toys. Whether you're looking for a full-time residence, seasonal getaway, or simply more room to enjoy life, this property delivers the privacy, flexibility, and independence that are becoming increasingly difficult to find. Conveniently located near Homosassa's famous springs, boating, fishing, golf courses, and Nature Coast attractions, this is Florida living with space to breathe.
Key facts
- New metal roof over
- Private well
- Water heater
Tags
Property features AI
Finance
- Other: Homestead exemption indicated; CDD present
- HOA & community: No association
Exterior
- Parking: Driveway; Carport with 2 spaces; Garage (approx. 15x30)
- Utilities: Well water; Septic tank; Electricity connected; Water connected; Broadband/high-speed internet available
- Home design: Manufactured double-wide home; Jacobsen make; One story; Home faces north
- Construction: Metal frame with vinyl siding; Metal roof; Crawlspace foundation; Built as a double wide
- Exterior features: Covered front and rear porches; Screened porch; Hurricane shutters; Sliding doors; Vinyl and wood fencing; Shed(s)/storage; Paved lot; Private maintained road
Interior
- Kitchen: Dishwasher; Disposal; Microwave; Range; Range hood; Refrigerator; Electric water heater
- Bedrooms: 3 bedrooms
- Flooring: Ceramic tile; Laminate
- Bathrooms: 2 full bathrooms
- Heating & cooling: Electric heating; Heat pump; Central air conditioning
- Interior features: Ceiling fans; Eat-in kitchen; Solid wood cabinets; Split bedroom layout; Thermostat; Walk-in closets; Window treatments; Blinds
- Laundry & utility: Washer hookup; Electric dryer hookup; Inside laundry room
Neighborhood map
What this means for you Summary
Snapshot
- This is a 3-bed/2.0-bath manufactured listed at $215k.
Deal economics
- At list price, monthly cash flow is $303 ($4k/yr) — positive.
- The deal already cash-flows at list — no discount required.
- To meet the 1% rule (rent ≥ 1% of price), the offer needs to be $198k (7.7% below list).
- Recommended offer: $198k (7.7% below list) — sets the bar for 1% rule.
- Cap rate 8.0% vs local median 5.9% in Homosassa Springs — top-decile yield for the area; either an underpriced asset or a hidden risk that comps aren't pricing in. Stress-test before assuming the spread holds.
Location & tenants
- Location reads 71/100 on livability (#391 in FL) — a middle-class / working-renter tenant base. Strengths: cost of living A+, housing A+, health & safety A+; Watch: crime C-, amenities F, commute F.
- Citrus (rural): math 49% / reading 50% proficiency, ranked #44 of 73 in FL (top 60%) — families likely to look elsewhere, expect single-tenant / working-renter base with shorter leases.
- Zoned schools: Lecanto Primary School (math 55% / reading 53%, grade C, #936 of 2,144 statewide, top 44%, 820 students, 63% FRL); Lecanto High School (math 46% / reading 53%, grade D, #179 of 667 statewide, top 29%, 1,630 students, 46% FRL) — zoned schools at 54% FRL track the district average.
- Market conditions: 582 active listings in the ZIP; 2,443 units permitted in Citrus County in 2024 (0 in 5+ unit buildings).
- This rent runs 40% of the median local income ($59k/yr) — at the standard rent-burdened threshold; future hikes will face affordability resistance.
Forward outlook
- Local home prices are declining (-3.0%/yr); year-one equity from $1k of loan paydown is wiped out by about $6k of value loss. Plan a longer hold.
- Citrus County population projected to shrink 10% by 2050 — rents likely to lag national; underwrite the cash flow, not the appreciation.
Negotiation context
- Only 2 days on market — expect competitive offers; lowballing is unlikely to land.
- 3 sale attempts since 20y ago with the ask held roughly flat each time — persistent listings suggest the price (not the market) is what's stuck; bring a comps-based counter.
- Current owner paid $160k; 34% above their basis — modest negotiation headroom, anchor on the comps not their cost.
Risks & watch-outs
- Climate carrying-cost: severe wind risk, 99% chance of damaging wind over 30y; major wildfire risk; extreme-heat days projected 7→25/yr by 2055 (HVAC capex compounding) — expect insurance premiums to compound above CPI over the hold.
Questions for the listing agent
- Is there a deadline driving the sale (1031 exchange, divorce, estate, relocation)? That informs how much negotiation room exists.
- Schools are F-rated, which usually means shorter tenancies and higher turnover. Who's the typical renter profile here, and what's been the actual vacancy rate?
- What's the average days-on-market for RENTAL listings here right now (not sales)? A rising rental-DOM trend means longer vacancies and softer asking-rent achievability than the comps imply.
- What's the recent tenant-quality profile in this submarket — average credit score on applications, eviction rate, late-payment / NSF rate, and stable-employment percentage? A property-management company in the area should have these aggregated.
- How much new for-sale + rental construction is in the pipeline within 1–3 miles? Heavy new supply typically softens prices + rents 12–24 months out; constrained supply supports both.
Investment metrics
- 1% rule
- 0.92% ✗
- Cap rate
- 7.99%
- Cash-on-cash
- 6.04%
- DSCR
- 1.27
- GRM
- 9.0
CMA / ARV
- ARV (on-the-fly)
- $251,040
- Comps found
- 3
Show comp detail 3 sales within ~0.75 mi
| Address | Dist | Beds/Ba | Sqft | Sold | Price | $/sf | Match |
|---|---|---|---|---|---|---|---|
| 5174 S Oldfield Ave | 0.57mi | 3/2.0 | 1,620 (+3%) | 1mo | $335,000 | $207 | 67 |
| 5390 W Rochelle St | 0.10mi | 4/3.0 (+1) | 1,680 (+7%) | 11mo | $268,000 | $160 | 66 |
| 5341 S Oldfield Ave | 0.74mi | 4/3.0 (+1) | 1,484 (-5%) | 11mo | $89,000 | $60 | 38 |
Match score weights: distance 35% · size 25% · config 20% · recency 20%. Top-matched comps best support the ARV.
Projected returns pro-forma
-3.0% appreciation · 3.0% rent growth · sell at horizon
- IRR
- -7.0%
- Equity multiple
- 0.74×
- Total profit
- $-15,615
- Equity at exit
- $32,024
- IRR
- 2.5%
- Equity multiple
- 1.18×
- Total profit
- $10,815
- Equity at exit
- $18,570
Cash invested: $60,138 (down + closing). Projections, not guarantees.
Landlord ↔ Tenant lean methodology
- Overall (STATE)
- 87 Strongly Landlord-Friendly
- State Florida
- 87 Strongly Landlord-Friendly · R+3
- County
- — inherits STATE
- City
- — inherits STATE
ZIP-level market 34446
- Home prices YoY
- -10.4%
- Active inventory
- 582
- Price-to-rent
- 9.0×
Monthly cashflow live
- Estimated rent
- $1,982 medium interval (Pro) →
- Mortgage (P&I)
- −$1,126
- Tax from tax record
- −$47 /mo · $560/yr
- Insurance
- −$89
- HOA
- −$0
- Vacancy / Maint / Mgmt
- −$416
- Net cashflow
- $303
Break-even live
UW: 25.0% down · 7.5% · 30yr · 1.5% tax · 5.0% vac · 8.0% maint · 8.0% mgmt
Financing live
Cash to close
- Down payment
- $53,694
- Closing costs
- $6,443
- Reserves months
- —
- Total cash needed
- —
Loan-product check · same deal, 3 products live
Conventional
25% down · 7.5% · 30yr
- Down + closing
- —
- Monthly P&I
- —
- Monthly cashflow
- —
- DSCR
- —
- Eligible?
- —
Personal DTI + credit; lowest rate.
DSCR
20% down · 8.5% · 30yr
- Down + closing
- —
- Monthly P&I
- —
- Monthly cashflow
- —
- DSCR
- —
- Eligible?
- —
No personal income docs; deal must DSCR.
Hard money
10% down · 12.0% · 12mo
- Down + closing
- —
- Monthly P&I
- —
- Monthly cashflow
- —
- DSCR
- —
- Eligible?
- —
Short-term bridge; refi at stabilization.
Listing history 4 events
-
2026-06-15status $214,777 Pending 2 DOM
-
2026-06-15days on market $214,777 Active 2 DOM
-
2026-06-14remarks 699-char remark
-
2026-06-14$214,777 Active 1 DOM
ⓘ Source: listings_history table (triggers on properties + properties_extension) + one-shot
backfill from property_details.listing_events for pre-trigger history.
Tax reassessment forecast FL · Resets to sale price
- Current annual tax
- $560 · $47/mo
- Projected year-2 tax
- $1,783 · $149/mo
- Expected delta
- +$1,222/yr (+$102/mo · 218.1%)
ⓘ Screening estimate from a state-policy table — verify with the county assessor before closing.
Climate risk First Street
- Flood 1/10 Low FEMA zone X (unshaded) · 0% chance over 30 yrs
- Wildfire 6/10 Major
- Heat 10/10 Extreme 7 d/yr ≥108°F today · 25 d/yr by 30 yrs out
- Wind 9/10 Extreme 99% chance of damaging wind over 30 yrs
- Air quality 1/10 Low 0 unhealthy d/yr today · 0 by 30 yrs out
Nearby sold comps map
Loading sold comps map…
Walkable amenities ~0.75 mi
Loading nearby amenities…
Taxation est. · year 1
- Rental income
- $23,779
- − Mortgage interest
- −$12,031
- − Property taxes
- −$560
- − Insurance
- −$1,074
- − Repairs & maintenance
- −$1,902
- − Management
- −$1,902
- − Depreciation
- −$6,248
- Taxable income
- $61
- Est. tax owed @ 24.0%
- −$15
- After-tax cash flow
- $3,621/yr
For passive investors: Depreciation is non-cash, so a rental often shows a tax loss while cash-flowing — sheltering income. Rental losses are passive: they offset passive income freely, and up to $25,000/yr can offset ordinary (W-2) income if you actively participate and your MAGI is under $100k (phasing out to $0 by $150k); unused losses carry forward. On sale, claimed depreciation is recaptured at up to 25%, and gains may owe capital-gains tax (a 1031 exchange can defer both). Figures are a year-1 estimate at your 24.0% rate — not tax advice; consult a CPA.
Schools (NCES district)
- District
- Citrus
- NCES district ID
- 1200270
- Math proficiency
- 49% ▼ -10.00%
- Reading proficiency
- 50% ▼ -6.00%
- Median HH income
- $38,618
- Composite
- 41.28/100
- National rank
- #3519
- State rank
- #44 of 73 in FL
Livability — Homosassa Springs
- Score
- 71/100
- State rank
- #391
- US rank
- #6877
Category grades
Schools grade is shown separately in the Schools card above.
Census & demographics
- Census place
- Homosassa Springs, FL
- County
- Citrus County · 111,314 people
- City population
- 18,797
- Metro
- Homosassa Springs, FL
- Population (ZIP)
- 19,102
- Household income
- $58,802
- Rent vs Own
- Severe rent burden
- 121.0
Population outlook (Citrus County) Hauer SSP2
- Today (2025)
- 138,622 people
- By 2030
- 136,886 · -1.3%
- By 2040
- 132,009 · -4.8%
- By 2050
- 125,196 · -9.7%
- By 2075
- 108,570 · -21.7%
- By 2100
- 84,454 · -39.1%
Race, ethnicity, and origin ACS 2023
- Neighborhood character
- Predominantly White (87%)
- Race & ethnicity
- White 87% Two or more races 8% Hispanic / Latino 6%
- Hispanic origin (detail)
- Mexican 2% Puerto Rican 3%
- Common ancestry
- Romanian 4% Lithuanian 4% Slovak 3%
- Foreign-born
- 5% · Canada
- Languages at home
- 95% English-only · Spanish 4%
Political lean MEDSL · Citrus
- 2024 margin
- Solid R (+45.9) · D 26.8% · R 72.6%
- 2008→2024 swing
- -29.8pp toward R · 2008: -16.1pp · 2024: -45.9pp
- All cycles
- 2024: R+45.9 2020: R+41.0 2016: R+39.7 2012: R+21.9 2008: R+16.1
Not yet ingested
- Civics
- —
Market trends
- HPI YoY
- ▼ -32.11%
- Current HPI
- 277.2576
- Rent YoY
- —
- Metro
- Homosassa Springs, FL
- State GDP YoY
- ▲ 3.28%
- F500 in state
- 36
Industry mix (Fortune 500 HQ in FL)
| Industry | F500 HQs | Revenue |
|---|---|---|
| Industrial Technology | 2 | $29B |
|
||
| Insurance | 2 | $17B |
|
||
| Retail | 1 | $60B |
|
||
| Technology Distribution | 1 | $58B |
|
||
| Homebuilding | 1 | $35B |
|
||
| Technology Manufacturing | 1 | $35B |
|
||
Price history
+513.6% since first listed5 events — show timeline
- 2026-06-13 Listed $214,777 RACC
- 2026-06-13 Listed $214,777 Stellar MLS as Distributed by MLS Grid
- 2021-09-01 Sold (Public Records) $159,900 Public Records
- 2006-11-30 Sold (MLS) $30,000 RACC
- 2006-10-02 Listed $35,000 RACC
Property tax history
+3.1%/yrLatest (2025): $560 · +11.4% YoY. Source: county tax records.
Cash-flow waterfall
monthlySold comps — $/sqft
last 12 mo · ≤1 miLoading sold comps…