 🌊 Lakefront
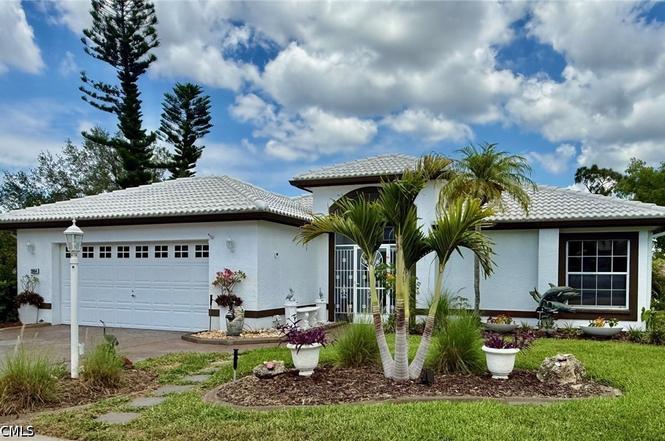
20864 Santorini Way · North Fort Myers, FL
Flood risk 3/10 · Minor
- FEMA flood zone
- X (unshaded)
- Chance of flooding over 30 yrs
- 0.2%
- Est. flood insurance / yr
- $507 – $1,088
Fire risk 8/10 · Major
- Est. fire insurance / yr
- $947 – $1,759
Heat risk 10/10 · Severe
- Hot days now (above 107°F)
- 7 days/yr
- Hot days in 30 yrs
- 28 days/yr
Wind risk 10/10 · Severe
- Chance of severe wind over 30 yrs
- 99.0%
Air-quality risk 2/10 · Minimal
- Unhealthy air days now
- 1 days/yr
- Unhealthy air days in 30 yrs
- 1 days/yr
Risk factors via First Street. Map © Google.
Why this score? — see what drove the D+ grade
The composite is a weighted blend of 9 inputs, each scored 0–100. Each bar is that input's sub-score; the figure is the points it added to the 100-point composite (weight × sub-score).
- ARV discount +15.0/15.0
- Cash flow +12.7/30.0
- Schools +4.1/10.0
- 1% rule +4.0/10.0
- DSCR +3.8/10.0
- Livability +3.7/5.0
- Rent growth +3.2/5.0
- Condition / age +2.5/5.0
- Appreciation +0.0/10.0
$359,900
🖨 Deal sheet (PDF) 📄 Offer letter ✓ Due diligence
Listing remarks MLS
This Villa Real model in HERONS GLEN GOLF AND COUNTRY CLUB is located on a quiet street and large lot with a views of a lake and golf course beyond. The home is ready for some tlc, so you can make it your own. Outside living spaces include a Florida Room and lanai with planting boxes. Make the most of Florida living in this spacious home with second master suite and a new roof in the amenity rich community of Herons Glen.
Key facts
- Leaded glass door
- Custom cabinets
- Bay window
Tags
Property features AI
Finance
- Other: Pets allowed conditionally (call), up to 3
- Financial info: Association fee $727 quarterly
- HOA & community: Homeowners association with quarterly fee; Association fee includes management, cable TV, internet, irrigation water, legal/accounting, grounds maintenance, recreation facilities, reserve fund, road maintenance, street lights and security; Community amenities include clubhouse, fitness center, golf course, pool, spa/hot tub, tennis, pickleball, bocce, shuffleboard, putting greens, billiards, hobby room, restaurant, barbecue and walking trails
Exterior
- Parking: Attached 2-car garage; Assigned parking; Two parking spaces (covered)
- Security: Gated community with guard; Security gate; Community security included in association
- Utilities: Cable available; Underground utilities; Water assessment paid; Sewer assessment paid
- Home design: Single-story; Entry level 1; Resale property; Faces southwest; Block, concrete and stucco construction; Tile roof
- Construction: Built with block, concrete and stucco; Tile roof
- Exterior features: Lanai; Porch; Screened porch; Automatic sprinklers; Community pool; Private paved road; Sprinkler/Irrigation; Northeast exposures; Has view
Interior
- Kitchen: Dishwasher; Disposal; Microwave; Range; Self-cleaning oven; Refrigerator
- Bedrooms: Den; Great room; Screened porch
- Flooring: Laminate; Tile
- Bathrooms: 2 full bathrooms
- Heating & cooling: Central heating (electric); Central air; Ceiling fans
- Interior features: Breakfast bar; Kitchen island; Pantry; Living/Dining room; High speed internet; Split bedrooms; Bathtub; Dual sinks; Separate shower
- Laundry & utility: Washer hookup inside; Dryer hookup inside
Neighborhood map
What this means for you Summary
Snapshot
- This is a 2-bed/2.0-bath single-family listed at $360k.
Deal economics
- At list price, monthly cash flow is $-41 ($-489/yr) — negative.
- To cash-flow at today's rent, offer at most $353k (2.0% below list).
- To meet the 1% rule (rent ≥ 1% of price), the offer needs to be $325k (9.6% below list).
- Recommended offer: $317k (12.0% below list) — sets the bar for market timing.
- Cap rate 6.2% vs local median 3.6% in North Fort Myers — top-decile yield for the area; either an underpriced asset or a hidden risk that comps aren't pricing in. Stress-test before assuming the spread holds.
Location & tenants
- Location reads 74/100 on livability (#269 in FL, #4,409 nationally) — a middle-class / working-renter tenant base. Strengths: cost of living A+, housing A+, health & safety A+; Watch: employment C-, amenities F, commute F.
- Lee (suburban): math 47% / reading 50% proficiency, ranked #42 of 73 in FL (top 58%) — families likely to look elsewhere, expect single-tenant / working-renter base with shorter leases.
- Zoned schools: Diplomat Elementary School (math 67% / reading 60%, grade B, #564 of 2,144 statewide, top 27%, 1,069 students, 56% FRL); Mariner Middle School (math 50% / reading 47%, grade C-, #274 of 571 statewide, top 50%, 1,001 students, 53% FRL); Ida S. Baker High School (math 44% / reading 47%, grade D-, #223 of 667 statewide, top 34%, 1,933 students, 39% FRL).
- Market conditions: Rents rising (+2.6%/yr); 846 active listings in the ZIP; 14 comparable units currently listed for rent nearby; rentals at typical pace (median 26d on market — plan ~3-4 weeks tenant-placement turnaround); 15,411 units permitted in Lee County in 2024 (4,686 in 5+ unit buildings).
- At $3,255/mo this rent would consume 71% of the median local household income ($55k/yr) (locally 775% of renters already pay >50% of income on rent) — very limited rent-growth headroom before tenants either downsize or default.
Forward outlook
- Local home prices are declining (-3.0%/yr); year-one equity from $2k of loan paydown is wiped out by about $11k of value loss. Plan a longer hold.
- Lee County population projected at +44% by 2050 — long-run rental-demand tailwind backs the buy-and-hold thesis.
Negotiation context
- It's been on market 135 days — a 12% lower offer ($317k) is reasonable based on typical stale-listing flexibility.
- 3 sale attempts since 4y ago with the ask held roughly flat each time — persistent listings suggest the price (not the market) is what's stuck; bring a comps-based counter.
Risks & watch-outs
- Climate carrying-cost: severe wind risk, 99% chance of damaging wind over 30y; severe wildfire risk; extreme-heat days projected 7→28/yr by 2055 (HVAC capex compounding) — expect insurance premiums to compound above CPI over the hold.
Questions for the listing agent
- What do current leases actually rent for vs. the listed asking? Can we see a recent rent roll and the last 12 months of T-12 income?
- It's been on market 135 days. Have you received any prior offers? Is the seller open to a 12% concession, seller financing, or rate buy-down credit?
- What does the HOA fee cover, when was the last increase, and are there any pending special assessments or reserve-fund shortfalls?
- Why hasn't it sold? Are there any deal-killer items the seller is aware of (foundation, flood, title, zoning, code violations)?
- Is there a deadline driving the sale (1031 exchange, divorce, estate, relocation)? That informs how much negotiation room exists.
- The area grade is low — what's the realistic commute time and amenity access for the typical tenant pool here? Any planned neighborhood developments (good or bad) we should know about?
- This sits on a lake — are riparian / water-frontage rights deeded with the parcel? Any dock permits, shoreline easements, or HOA water-use restrictions?
- What's the documented flood / surge / shoreline-erosion history here (FEMA AND non-FEMA — e.g., storm surge, creek backup, septic-field saturation)?
- Any water-quality or seasonal algae-bloom issues that affect tenant satisfaction or short-term-rental demand?
- What's the average days-on-market for RENTAL listings here right now (not sales)? A rising rental-DOM trend means longer vacancies and softer asking-rent achievability than the comps imply.
- What's the recent tenant-quality profile in this submarket — average credit score on applications, eviction rate, late-payment / NSF rate, and stable-employment percentage? A property-management company in the area should have these aggregated.
- How much new for-sale + rental construction is in the pipeline within 1–3 miles? Heavy new supply typically softens prices + rents 12–24 months out; constrained supply supports both.
Investment metrics
- 1% rule
- 0.90% ✗
- Cap rate
- 6.16%
- Cash-on-cash
- -0.49%
- DSCR
- 0.98
- GRM
- 9.2
CMA / ARV
- ARV (on-the-fly)
- $532,818
- Comps found
- 9
Show comp detail 9 sales within ~0.75 mi
| Address | Dist | Beds/Ba | Sqft | Sold | Price | $/sf | Match |
|---|---|---|---|---|---|---|---|
| 2140 Valparaiso Blvd | 0.06mi | 2/2.0 | 1,773 (+3%) | 22mo | $330,000 | $186 | 73 |
| 1950 Corona Del Sire Dr | 0.21mi | 2/2.0 | 1,602 (-7%) | 11mo | $250,000 | $156 | 70 |
| 2411 Palo Duro Blvd | 0.48mi | 2/2.0 | 1,814 (+6%) | 0mo | $488,000 | $269 | 68 |
| 2401 Palo Duro Blvd | 0.49mi | 3/2.0 (+1) | 1,729 (+1%) | 22mo | $460,000 | $266 | 53 |
| 2521 Palo Duro Blvd | 0.53mi | 3/2.0 (+1) | 1,644 (-4%) | 20mo | $500,000 | $304 | 47 |
| 1921 Embarcadero Way | 0.26mi | 3/2.0 (+1) | 1,495 (-13%) | 22mo | $429,000 | $287 | 43 |
| 2640 Palo Duro Blvd | 0.64mi | 3/2.0 (+1) | 1,917 (+12%) | 6mo | $440,000 | $230 | 41 |
| 20526 Plumwood Loop | 0.64mi | 2/2.0 | 1,497 (-13%) | 18mo | $285,000 | $190 | 34 |
| 20502 Plumwood Loop | 0.67mi | 2/2.0 | 1,497 (-13%) | 18mo | $330,000 | $220 | 33 |
Match score weights: distance 35% · size 25% · config 20% · recency 20%. Top-matched comps best support the ARV.
Projected returns pro-forma
-3.0% appreciation · 2.63% rent growth · sell at horizon
- IRR
- -17.5%
- Equity multiple
- 0.38×
- Total profit
- $-61,995
- Equity at exit
- $53,662
- IRR
- -10.2%
- Equity multiple
- 0.39×
- Total profit
- $-61,730
- Equity at exit
- $31,118
Cash invested: $100,772 (down + closing). Projections, not guarantees.
Landlord ↔ Tenant lean methodology
- Overall (STATE)
- 87 Strongly Landlord-Friendly
- State Florida
- 87 Strongly Landlord-Friendly · R+3
- County
- — inherits STATE
- City
- — inherits STATE
ZIP-level market 33917
- Home prices YoY
- -30.2%
- Rents YoY
- 2.6%
- Active inventory
- 846
- Price-to-rent
- 9.2×
Monthly cashflow live
- Estimated rent
- $3,255 high interval (Pro) →
- Mortgage (P&I)
- −$1,887
- Tax from tax record
- −$333 /mo · $3,993/yr
- Insurance
- −$150
- HOA
- −$242
- Vacancy / Maint / Mgmt
- −$684
- Net cashflow
- $-41
Break-even live
Sensitivity live
| Price | -10% $163 | -5% $61 | +0% $-41 | +5% $-143 | +10% $-244 |
|---|---|---|---|---|---|
| Rent | -10% $-298 | -5% $-169 | +0% $-41 | +5% $88 | +10% $216 |
| Rate | -1.0pp $141 | -0.5pp $51 | base $-41 | +0.5pp $-134 | +1.0pp $-229 |
UW: 25.0% down · 7.5% · 30yr · 1.5% tax · 5.0% vac · 8.0% maint · 8.0% mgmt
Financing live
Cash to close
- Down payment
- $89,975
- Closing costs
- $10,797
- Reserves months
- —
- Total cash needed
- —
Loan-product check · same deal, 3 products live
Conventional
25% down · 7.5% · 30yr
- Down + closing
- —
- Monthly P&I
- —
- Monthly cashflow
- —
- DSCR
- —
- Eligible?
- —
Personal DTI + credit; lowest rate.
DSCR
20% down · 8.5% · 30yr
- Down + closing
- —
- Monthly P&I
- —
- Monthly cashflow
- —
- DSCR
- —
- Eligible?
- —
No personal income docs; deal must DSCR.
Hard money
10% down · 12.0% · 12mo
- Down + closing
- —
- Monthly P&I
- —
- Monthly cashflow
- —
- DSCR
- —
- Eligible?
- —
Short-term bridge; refi at stabilization.
Rent comps 14 comps
| Address | Beds | Baths | Sqft | Rent | $/sqft | DOM | Units | Dist |
|---|---|---|---|---|---|---|---|---|
| 2130 Rio Nuevo Dr Unit 1546442P North Fort Myers, FL | 2.0 | 2.0 | 1248 | $4,682 | $3.75 | 16d | 1 | 0.15mi |
| 2300 Valparaiso Blvd North Fort Myers, FL | 2.0 | 2.0 | 1237 | $4,000 | $3.23 | 25d | 1 | 0.19mi |
| 2300 Valparaiso Blvd North Fort Myers, FL | 2.0 | 2.0 | 1237 | $3,000 | $2.43 | 18d | 1 | 0.19mi |
| 1900 Corona del Sire Dr North Fort Myers, FL | 2.0 | 2.0 | 1449 | $2,400 | $1.66 | 25d | 1 | 0.26mi |
| 20919 Villareal Way North Fort Myers, FL | 2.0 | 2.0 | 1428 | $4,000 | $2.80 | 25d | 1 | 0.27mi |
| 1670 Palo Duro Blvd North Fort Myers, FL | 2.0 | 2.0 | 1604 | $2,700 | $1.68 | 5d | 1 | 0.38mi |
| 2481 Palo Duro Blvd North Fort Myers, FL | 3.0 | 2.0 | 1450 | $4,000 | $2.76 | 23d | 1 | 0.50mi |
| 2481 Palo Duro Blvd North Fort Myers, FL | 3.0 | 2.0 | 1450 | $4,000 | $2.76 | 18d | 1 | 0.50mi |
| 20559 Long Pond Rd North Fort Myers, FL | 3.0 | 2.0 | 1805 | $2,295 | $1.27 | 25d | 1 | 0.86mi |
| 20056 Sweetbay Dr North Fort Myers, FL | 3.0 | 2.0 | 1672 | $4,000 | $2.39 | 25d | 1 | 0.86mi |
| 20038 Fiddlewood Ave North Fort Myers, FL | 3.0 | 2.0 | 1519 | $1,999 | $1.32 | 21d | 1 | 0.87mi |
| 20728 Tisbury Ln North Fort Myers, FL | 3.0 | 2.5 | 2133 | $5,000 | $2.34 | 16d | 1 | 1.00mi |
| 10401 Circle Pine Rd North Fort Myers, FL | 2.0 | 2.0 | 1294 | $3,000 | $2.32 | 25d | 1 | 1.40mi |
| 19621 N Tamiami Trl North Fort Myers, FL | 3.0 | 2.0 | 1205 | $1,300 | $1.08 | 25d | 1 | 1.46mi |
HOA detail
- Monthly dues
- $242 · $2,904/yr
Listing history 36 events
-
2026-06-22days on market $359,900 Active 135 DOM
-
2026-06-17days on market $359,900 Active 131 DOM
-
2026-06-16days on market $359,900 Active 130 DOM
-
2026-06-15days on market $359,900 Active 129 DOM
-
2026-06-13days on market $359,900 Active 127 DOM
-
2026-06-10days on market $359,900 Active 124 DOM
-
2026-06-09days on market $359,900 Active 123 DOM
-
2026-06-07days on market $359,900 Active 121 DOM
-
2026-06-02days on market $359,900 Active 116 DOM
-
2026-06-01days on market $359,900 Active 115 DOM
-
2026-06-01days on market $359,900 Active 114 DOM
-
2026-03-24price $359,900
-
2026-02-06$365,000 Active
-
2026-01-29historical
-
2026-01-12price $369,900
-
2025-12-10price $386,900
-
2025-11-12price $396,000
-
2025-07-20price $399,000
-
2025-07-05price $399,900
-
2025-05-30price $419,900
-
2025-05-06price $439,000
-
2025-04-17price $446,900
-
2025-03-31price $467,750
-
2025-03-01$474,500 Active
-
2023-03-15soldstatus $330,000
-
2023-03-09soldstatus $330,000 Closed 425-char remark
Show marketing remark (425 chars)
This Villa Real model in HERONS GLEN GOLF AND COUNTRY CLUB is located on a quiet street and large lot with a views of a lake and golf course beyond. The home is ready for some tlc, so you can make it your own. Outside living spaces include a Florida Room and lanai with planting boxes. Make the most of Florida living in this spacious home with second master suite and a new roof in the amenity rich community of Herons Glen.
-
2022-11-27historical 425-char remark
Show marketing remark (425 chars)
This Villa Real model in HERONS GLEN GOLF AND COUNTRY CLUB is located on a quiet street and large lot with a views of a lake and golf course beyond. The home is ready for some tlc, so you can make it your own. Outside living spaces include a Florida Room and lanai with planting boxes. Make the most of Florida living in this spacious home with second master suite and a new roof in the amenity rich community of Herons Glen.
-
2022-11-26$335,000 425-char remark
Show marketing remark (425 chars)
This Villa Real model in HERONS GLEN GOLF AND COUNTRY CLUB is located on a quiet street and large lot with a views of a lake and golf course beyond. The home is ready for some tlc, so you can make it your own. Outside living spaces include a Florida Room and lanai with planting boxes. Make the most of Florida living in this spacious home with second master suite and a new roof in the amenity rich community of Herons Glen.
-
2008-08-27soldstatus $170,000
-
2008-08-21soldstatus $170,000
-
2008-07-10price $219,900
-
2003-09-05soldstatus $187,000
-
2003-07-28price $191,000
-
2001-11-17soldstatus $200,000
-
2001-04-24soldstatus $189,000
-
1991-04-01soldstatus $158,000
ⓘ Source: listings_history table (triggers on properties + properties_extension) + one-shot
backfill from property_details.listing_events for pre-trigger history.
Tax reassessment forecast FL · Resets to sale price
- Current annual tax
- $3,993 · $333/mo
- Projected year-2 tax
- $3,993 · $333/mo
- Expected delta
- $0/yr ($0/mo · 0.0%)
ⓘ Screening estimate from a state-policy table — verify with the county assessor before closing.
Climate risk First Street
- Flood 3/10 Moderate FEMA zone X (unshaded) · 20% chance over 30 yrs
- Wildfire 8/10 Severe
- Heat 10/10 Extreme 7 d/yr ≥107°F today · 28 d/yr by 30 yrs out
- Wind 10/10 Extreme 99% chance of damaging wind over 30 yrs
- Air quality 2/10 Low 1 unhealthy d/yr today · 1 by 30 yrs out
Nearby sold comps map
Loading sold comps map…
Walkable amenities ~0.75 mi
Loading nearby amenities…
Taxation est. · year 1
- Rental income
- $39,058
- − Mortgage interest
- −$20,160
- − Property taxes
- −$3,993
- − Insurance
- −$1,800
- − Repairs & maintenance
- −$3,125
- − Management
- −$3,125
- − HOA
- −$2,904
- − Depreciation
- −$10,470
- Taxable loss
- −$6,517
- Est. tax savings @ 24.0%
- +$1,564
- After-tax cash flow
- $1,075/yr
For passive investors: Depreciation is non-cash, so a rental often shows a tax loss while cash-flowing — sheltering income. Rental losses are passive: they offset passive income freely, and up to $25,000/yr can offset ordinary (W-2) income if you actively participate and your MAGI is under $100k (phasing out to $0 by $150k); unused losses carry forward. On sale, claimed depreciation is recaptured at up to 25%, and gains may owe capital-gains tax (a 1031 exchange can defer both). Figures are a year-1 estimate at your 24.0% rate — not tax advice; consult a CPA.
Schools (NCES district)
- District
- Lee
- NCES district ID
- 1201080
- Math proficiency
- 47% ▼ -11.00%
- Reading proficiency
- 50% ▼ -4.00%
- Median HH income
- $49,518
- Composite
- 41.49/100
- National rank
- #3458
- State rank
- #42 of 73 in FL
Livability — North Fort Myers
- Score
- 74/100
- State rank
- #269
- US rank
- #4409
Category grades
Schools grade is shown separately in the Schools card above.
Census & demographics
- Census place
- North Fort Myers, FL
- County
- Lee County · 788,662 people
- City population
- 57,035
- Metro
- Cape Coral-Fort Myers, FL
- Population (ZIP)
- 33,380
- Household income
- $55,000
- Rent vs Own
- Severe rent burden
- 775.0
Population outlook (Lee County) Hauer SSP2
- Today (2025)
- 871,946 people
- By 2030
- 955,468 · +9.6%
- By 2040
- 1,113,587 · +27.7%
- By 2050
- 1,256,891 · +44.1%
- By 2075
- 1,560,270 · +78.9%
- By 2100
- 1,726,848 · +98.0%
Race, ethnicity, and origin ACS 2023
- Neighborhood character
- Predominantly White (85%)
- Race & ethnicity
- White 85% Hispanic / Latino 10% Two or more races 7% Asian 1% Black 1%
- Hispanic origin (detail)
- Mexican 2% Puerto Rican 1% Cuban 3%
- Common ancestry
- Lithuanian 3% Romanian 3% Slovak 2%
- Foreign-born
- 10% · Canada
- Languages at home
- 88% English-only · Spanish 9% Other Indo-European 1% Russian/Polish/Slavic 1%
Political lean MEDSL · Lee
- 2024 margin
- Strong R (+28.4) · D 35.5% · R 63.9%
- 2008→2024 swing
- -18.0pp toward R · 2008: -10.4pp · 2024: -28.4pp
- All cycles
- 2024: R+28.4 2020: R+19.2 2016: R+20.4 2012: R+16.6 2008: R+10.4
Not yet ingested
- Civics
- —
Market trends
- HPI YoY
- ▼ -122.28%
- Current HPI
- 282.2895
- Rent YoY
- ▲ 2.63%
- Metro
- Cape Coral-Fort Myers, FL
- State GDP YoY
- ▲ 3.28%
- F500 in state
- 36
Industry mix (Fortune 500 HQ in FL)
| Industry | F500 HQs | Revenue |
|---|---|---|
| Industrial Technology | 2 | $29B |
|
||
| Insurance | 2 | $17B |
|
||
| Retail | 1 | $60B |
|
||
| Technology Distribution | 1 | $58B |
|
||
| Homebuilding | 1 | $35B |
|
||
| Technology Manufacturing | 1 | $35B |
|
||
Price history
+127.8% since first listed25 events — show timeline
- 2026-03-24 Price Changed $359,900 FORTMLS
- 2026-02-06 Listed $365,000 FORTMLS
- 2026-01-29 Listing Removed — FORTMLS
- 2026-01-12 Price Changed $369,900 FORTMLS
- 2025-12-10 Price Changed $386,900 FORTMLS
- 2025-11-12 Price Changed $396,000 FORTMLS
- 2025-07-20 Price Changed $399,000 FORTMLS
- 2025-07-05 Price Changed $399,900 FORTMLS
- 2025-05-30 Price Changed $419,900 FORTMLS
- 2025-05-06 Price Changed $439,000 FORTMLS
- 2025-04-17 Price Changed $446,900 FORTMLS
- 2025-03-31 Price Changed $467,750 FORTMLS
- 2025-03-01 Listed $474,500 FORTMLS
- 2023-03-15 Sold (Public Records) $330,000 Public Records
- 2023-03-09 Sold (MLS) $330,000 FORTMLS
- 2022-11-27 Listing Removed — FORTMLS
- 2022-11-26 Listed $335,000 FORTMLS
- 2008-08-27 Sold (Public Records) $170,000 Public Records
- 2008-08-21 Sold (MLS) $170,000 FORTMLS
- 2008-07-10 Price Changed $219,900 FORTMLS
- 2003-09-05 Sold (MLS) $187,000 FORTMLS
- 2003-07-28 Price Changed $191,000 FORTMLS
- 2001-11-17 Sold (Public Records) $200,000 Public Records
- 2001-04-24 Sold (Public Records) $189,000 Public Records
- 1991-04-01 Sold (Public Records) $158,000 Public Records
Property tax history
+2.0%/yrLatest (2025): $3,993 · +3.0% YoY. Source: county tax records.
Cash-flow waterfall
monthlySold comps — $/sqft
last 12 mo · ≤1 miLoading sold comps…