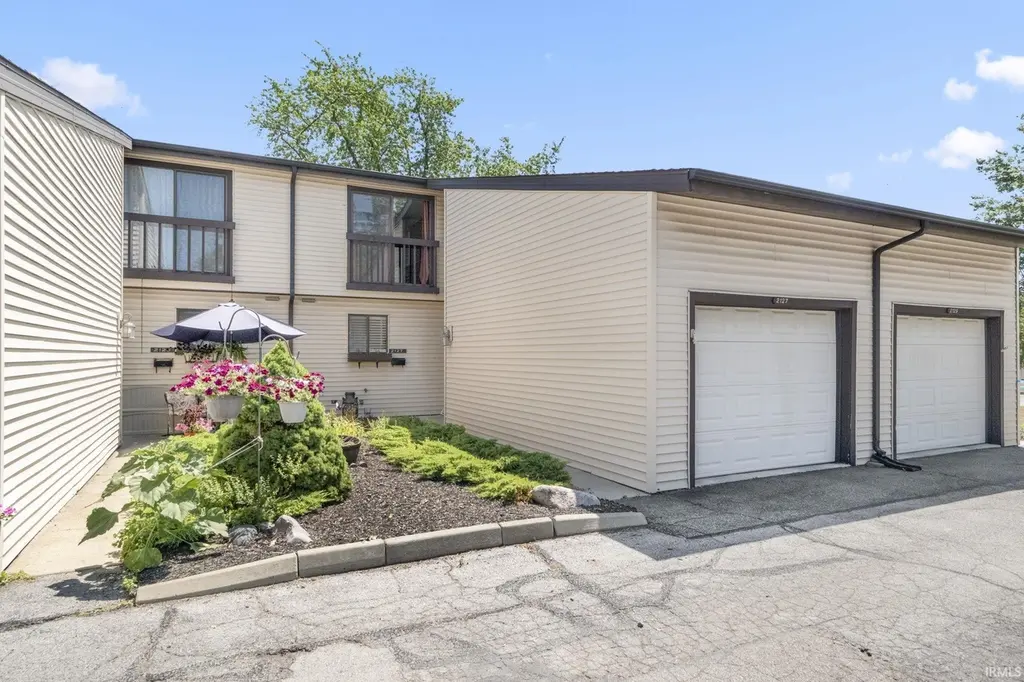
2127 Bayside Ct · Fort Wayne, IN
Flood risk 1/10 · Minimal
- FEMA flood zone
- X (unshaded)
- Chance of flooding over 30 yrs
- 0.0%
- Est. flood insurance / yr
- $507 – $1,088
Fire risk 1/10 · Minimal
- Est. fire insurance / yr
- $717 – $1,331
Heat risk 3/10 · Minor
- Hot days now (above 100°F)
- 7 days/yr
- Hot days in 30 yrs
- 17 days/yr
Wind risk 2/10 · Minimal
- Chance of severe wind over 30 yrs
- —
Air-quality risk 3/10 · Minor
- Unhealthy air days now
- 2 days/yr
- Unhealthy air days in 30 yrs
- 3 days/yr
Risk factors via First Street. Map © Google.
Why this score? — see what drove the D grade
The composite is a weighted blend of 9 inputs, each scored 0–100. Each bar is that input's sub-score; the figure is the points it added to the 100-point composite (weight × sub-score).
- Cash flow +17.2/30.0
- 1% rule +7.1/10.0
- DSCR +5.4/10.0
- Livability +4.2/5.0
- Rent growth +2.5/5.0
- Condition / age +2.5/5.0
- Schools +2.2/10.0
- ARV discount +0.0/15.0
- Appreciation +0.0/10.0
$167,000
🖨 Deal sheet 📄 Offer letter ✓ Due diligence
Listing remarks MLS
Two-story condo in the heart of the '04 offers spacious and functional living in a prime location! The main level features a large living room with patio access, an open eat-in kitchen, and a convenient half bath. Upstairs, you'll find three generous bedrooms, convenient laundry space and a full bathroom which connects to the primary bedroom. The finished basement provides additional space for entertaining, relaxing, or storage. Enjoy a fenced back patio, attached one-car garage, and low-maintenance living—lawn care and exterior upkeep are covered by the association. Located near the Jorgenson Family YMCA, local dining, and entertainment!
Key facts
- Open eat in kitchen
- Two story condo
- Finished basement
Tags
Neighborhood map
What this means for you Summary
Snapshot
- This is a 3-bed/1.5-bath condo listed at $167k.
Deal economics
- At list price, monthly cash flow is $119 ($1k/yr) — positive.
- The deal already cash-flows at list — no discount required.
- Meets the 1% rule at list price ($2k rent vs $167k).
- Recommended offer: $152k (9.0% below list) — sets the bar for market timing.
- Cap rate 7.1% vs local median 4.8% in Fort Wayne — top-decile yield for the area; either an underpriced asset or a hidden risk that comps aren't pricing in. Stress-test before assuming the spread holds.
Location & tenants
- Location reads 84/100 on livability (#6 in IN, #676 nationally) — a professional / high-income tenant draw. Strengths: amenities A+, commute A+, cost of living A+; Watch: crime C-, schools D+, employment D+.
- Fort Wayne Community Schools (urban): math 22% / reading 29% proficiency, ranked #263 of 301 in IN (top 87%) — low school quality limits family demand, transient renter base, plan for 1-2y turnover; 60% free/reduced lunch — lower-income household profile, screen leases tightly.
- Market conditions: 16 active listings in the ZIP; 8 comparable units currently listed for rent nearby; rentals at typical pace (median 14d on market — plan ~3-4 weeks tenant-placement turnaround); solid renter incomes; 1,861 units permitted in Allen County in 2024 (576 in 5+ unit buildings).
Forward outlook
- Local home prices are declining (-3.0%/yr); year-one equity from $1k of loan paydown is wiped out by about $5k of value loss. Plan a longer hold.
- Allen County population projected at +10% by 2050 — modest demand growth; plan on rents tracking national, not racing it.
Negotiation context
- It's been on market 105 days — a 9% lower offer ($152k) is reasonable based on typical stale-listing flexibility.
- 7 sale attempts since 8y ago; this cycle's ask has dropped $9k (5%) from the opening price — seller is motivated, your offer sets the floor, not the list.
Questions for the listing agent
- It's been on market 105 days. Have you received any prior offers? Is the seller open to a 9% concession, seller financing, or rate buy-down credit?
- Built in 1975 — when were the roof, HVAC, electrical panel, plumbing, and water heater last replaced?
- What does the HOA fee cover, when was the last increase, and are there any pending special assessments or reserve-fund shortfalls?
- Any open or pending special assessments — roof, HVAC, plumbing, elevator, façade? What's the per-unit balance and payoff schedule, and is the seller paying it off at close or rolling it to the buyer?
- Why hasn't it sold? Are there any deal-killer items the seller is aware of (foundation, flood, title, zoning, code violations)?
- Is there a deadline driving the sale (1031 exchange, divorce, estate, relocation)? That informs how much negotiation room exists.
- Schools are D-rated, which usually means shorter tenancies and higher turnover. Who's the typical renter profile here, and what's been the actual vacancy rate?
- The area grade is low — what's the realistic commute time and amenity access for the typical tenant pool here? Any planned neighborhood developments (good or bad) we should know about?
- What's the average days-on-market for RENTAL listings here right now (not sales)? A rising rental-DOM trend means longer vacancies and softer asking-rent achievability than the comps imply.
- What's the recent tenant-quality profile in this submarket — average credit score on applications, eviction rate, late-payment / NSF rate, and stable-employment percentage? A property-management company in the area should have these aggregated.
- How much new apartment / multifamily construction is in the pipeline within 1–3 miles? Heavy new supply (>2% of stock underway) typically softens rents 12–24 months out; light construction supports rent growth.
Investment metrics
- 1% rule
- 1.21% ✓
- Cap rate
- 7.15%
- Cash-on-cash
- 3.06%
- DSCR
- 1.14
- GRM
- 6.9
CMA / ARV
- ARV (median comp)
- $142,118
- List price
- $167,000
- Delta
- 17.51%
- Verdict
- OVERPRICED
- Comps
- 4 within 1.0 mi
Projected returns pro-forma
-3.0% appreciation · 3.0% rent growth · sell at horizon
- IRR
- -11.3%
- Equity multiple
- 0.59×
- Total profit
- $-19,241
- Equity at exit
- $24,900
- IRR
- -1.9%
- Equity multiple
- 0.87×
- Total profit
- $-6,047
- Equity at exit
- $14,439
Cash invested: $46,760 (down + closing). Projections, not guarantees.
Landlord ↔ Tenant lean methodology
- Overall (STATE)
- 90 Strongly Landlord-Friendly
- State Indiana
- 90 Strongly Landlord-Friendly · R+11
- County
- — inherits STATE
- City
- — inherits STATE
ZIP-level market 46804
- Active inventory
- 16
- Price-to-rent
- 6.9×
Monthly cashflow live
- Estimated rent
- $2,022 high interval (Pro) →
- Mortgage (P&I)
- −$876
- Tax from tax record
- −$172 /mo · $2,060/yr
- Insurance
- −$70
- HOA
- −$361
- Vacancy / Maint / Mgmt
- −$425
- Net cashflow
- $119
Break-even live
UW: 25.0% down · 7.5% · 30yr · 1.5% tax · 5.0% vac · 8.0% maint · 8.0% mgmt
Financing live
Cash to close
- Down payment
- $41,750
- Closing costs
- $5,010
- Reserves months
- —
- Total cash needed
- —
Loan-product check · same deal, 3 products live
Conventional
25% down · 7.5% · 30yr
- Down + closing
- —
- Monthly P&I
- —
- Monthly cashflow
- —
- DSCR
- —
- Eligible?
- —
Personal DTI + credit; lowest rate.
DSCR
20% down · 8.5% · 30yr
- Down + closing
- —
- Monthly P&I
- —
- Monthly cashflow
- —
- DSCR
- —
- Eligible?
- —
No personal income docs; deal must DSCR.
Hard money
10% down · 12.0% · 12mo
- Down + closing
- —
- Monthly P&I
- —
- Monthly cashflow
- —
- DSCR
- —
- Eligible?
- —
Short-term bridge; refi at stabilization.
Rent comps 8 comps
| Address | Beds | Baths | Sqft | Rent | $/sqft | DOM | Units | Dist |
|---|---|---|---|---|---|---|---|---|
| 6142 Welch Rd Fort Wayne, IN | 1.0–3.0 | 1.0–2.0 | 1055 | $2,049 | $1.94 | 14d | 32 | 0.28mi |
| 5810 Meadows Dr Fort Wayne, IN | 1.0–3.0 | 1.0–2.0 | 1027 | $1,749 | $1.70 | 14d | 9 | 0.49mi |
| 2890 Getz Rd Fort Wayne, IN | 3.0 | 2.5 | 2056 | $2,395 | $1.16 | 14d | 1 | 0.55mi |
| 1311 Edenton Dr Fort Wayne, IN | 3.0 | 1.5 | 1344 | $1,650 | $1.23 | 21d | 1 | 0.87mi |
| 5123 Pinebrook Dr Fort Wayne, IN | 2.0 | 2.0 | 1227 | $1,595 | $1.30 | 44d | 1 | 0.87mi |
| 4708 Palatine Dr Fort Wayne, IN | 2.0 | 1.0 | 1379 | $1,300 | $0.94 | 14d | 1 | 1.10mi |
| 8075 Preston Pointe Dr Fort Wayne, IN | 1.0–3.0 | 1.0–2.0 | 995 | $1,600 | $1.61 | 14d | 6 | 1.32mi |
| 910 Lagro Dr Fort Wayne, IN | 2.0 | 1.0 | 1080 | $1,200 | $1.11 | 21d | 1 | 1.35mi |
HOA detail condo
- Monthly dues
- $361 · $4,332/yr
- Likely covers
- landscaping
- Assessments
- None detected in remarks — confirm with the listing agent.
Listing history 31 events
-
2026-06-18days on market $167,000 Active 105 DOM
-
2026-06-17days on market $167,000 Active 104 DOM
-
2026-06-16days on market $167,000 Active 103 DOM
-
2026-06-15price $167,000 Active 102 DOM
-
2026-06-15days on market $172,400 Active 102 DOM
-
2026-06-14days on market $172,400 Active 100 DOM
-
2026-06-10days on market $172,400 Active 97 DOM
-
2026-06-09days on market $172,400 Active 96 DOM
-
2026-06-08days on market $172,400 Active 95 DOM
-
2026-06-07days on market $172,400 Active 94 DOM
-
2026-06-03days on market $172,400 Active 90 DOM
-
2026-06-02days on market $172,400 Active 89 DOM
-
2026-06-01days on market $172,400 Active 88 DOM
-
2026-05-31days on market $172,400 Active 87 DOM
-
2026-05-30days on market $172,400 Active 86 DOM
-
2026-04-30price $174,900 652-char remark
Show marketing remark (652 chars)
Two-story condo in the heart of the '04 offers spacious and functional living in a prime location! The main level features a large living room with patio access, an open eat-in kitchen, and a convenient half bath. Upstairs, you'll find three generous bedrooms, convenient laundry space and a full bathroom which connects to the primary bedroom. The finished basement provides additional space for entertaining, relaxing, or storage. Enjoy a fenced back patio, attached one-car garage, and low-maintenance living—lawn care and exterior upkeep are covered by the association. Located near the Jorgenson Family YMCA, local dining, and entertainment!
-
2026-03-05$175,900 Active 652-char remark
Show marketing remark (652 chars)
Two-story condo in the heart of the '04 offers spacious and functional living in a prime location! The main level features a large living room with patio access, an open eat-in kitchen, and a convenient half bath. Upstairs, you'll find three generous bedrooms, convenient laundry space and a full bathroom which connects to the primary bedroom. The finished basement provides additional space for entertaining, relaxing, or storage. Enjoy a fenced back patio, attached one-car garage, and low-maintenance living—lawn care and exterior upkeep are covered by the association. Located near the Jorgenson Family YMCA, local dining, and entertainment!
-
2025-10-21status Active
-
2025-10-11historical Active Under Contract
-
2025-09-09price $175,900
-
2025-08-20price $177,900
-
2025-07-24$179,900 Active
-
2023-08-24soldstatus $170,000 Closed
-
2023-08-02historical
-
2023-07-19status Pending
-
2023-07-17$162,500 Active
-
2019-09-04soldstatus $97,000
-
2019-07-12$99,900
-
2018-10-12soldstatus $94,900
-
2018-09-09$94,900
-
2018-06-22$97,000
ⓘ Source: listings_history table (triggers on properties + properties_extension) + one-shot
backfill from property_details.listing_events for pre-trigger history.
Tax reassessment forecast IN · Partial reset (capped growth)
- Current annual tax
- $2,060 · $172/mo
- Projected year-2 tax
- $2,060 · $172/mo
- Expected delta
- $0/yr ($0/mo · 0.0%)
ⓘ Screening estimate from a state-policy table — verify with the county assessor before closing.
Climate risk First Street
- Flood 1/10 Low FEMA zone X (unshaded) · 0% chance over 30 yrs
- Wildfire 1/10 Low
- Heat 3/10 Moderate 7 d/yr ≥100°F today · 17 d/yr by 30 yrs out
- Wind 2/10 Low
- Air quality 3/10 Moderate 2 unhealthy d/yr today · 3 by 30 yrs out
Nearby sold comps map
Loading sold comps map…
Walkable amenities ~0.75 mi
Loading nearby amenities…
Taxation est. · year 1
- Rental income
- $24,261
- − Mortgage interest
- −$9,355
- − Property taxes
- −$2,060
- − Insurance
- −$835
- − Repairs & maintenance
- −$1,941
- − Management
- −$1,941
- − HOA
- −$4,332
- − Depreciation
- −$4,858
- Taxable loss
- −$1,060
- Est. tax savings @ 24.0%
- +$254
- After-tax cash flow
- $1,685/yr
For passive investors: Depreciation is non-cash, so a rental often shows a tax loss while cash-flowing — sheltering income. Rental losses are passive: they offset passive income freely, and up to $25,000/yr can offset ordinary (W-2) income if you actively participate and your MAGI is under $100k (phasing out to $0 by $150k); unused losses carry forward. On sale, claimed depreciation is recaptured at up to 25%, and gains may owe capital-gains tax (a 1031 exchange can defer both). Figures are a year-1 estimate at your 24.0% rate — not tax advice; consult a CPA.
Schools (NCES district)
- District
- Fort Wayne Community Schools
- NCES district ID
- 1803630
- Math proficiency
- 22% ▼ -11.00%
- Reading proficiency
- 29% ▼ -7.00%
- Median HH income
- $41,951
- Composite
- 21.68/100
- National rank
- #8275
- State rank
- #263 of 301 in IN
Livability — Fort Wayne
- Score
- 84/100
- State rank
- #6
- US rank
- #676
Category grades
Schools grade is shown separately in the Schools card above.
Census & demographics
- Census place
- Fort Wayne, IN
- County
- Allen County · 326,813 people
- City population
- 326,813
- Metro
- Fort Wayne, IN
- Population (ZIP)
- 29,661
- Household income
- $85,833
- Rent vs Own
- Severe rent burden
- 904.0
Population outlook (Allen County) Hauer SSP2
- Today (2025)
- 394,020 people
- By 2030
- 405,128 · +2.8%
- By 2040
- 423,476 · +7.5%
- By 2050
- 435,137 · +10.4%
- By 2075
- 450,293 · +14.3%
- By 2100
- 424,101 · +7.6%
Race, ethnicity, and origin ACS 2023
- Neighborhood character
- Predominantly White (81%)
- Race & ethnicity
- White 81% Black 6% Two or more races 6% Hispanic / Latino 5% Asian 3%
- Hispanic origin (detail)
- Mexican 3%
- Common ancestry
- Lithuanian 3% Slovak 3% Italian 3%
- Foreign-born
- 5% · Canada
- Languages at home
- 93% English-only · Spanish 3% Tagalog/Filipino 1% Other Indo-European 1%
Political lean MEDSL · Allen
- 2024 margin
- R (+12.5) · D 42.9% · R 55.4% · Other 1.7%
- 2008→2024 swing
- -8.1pp toward R · 2008: -4.3pp · 2024: -12.5pp
- All cycles
- 2024: R+12.5 2020: R+11.2 2016: R+19.6 2012: R+16.8 2008: R+4.3
Not yet ingested
- Civics
- —
Market trends
- HPI YoY
- ▼ -180.52%
- Current HPI
- 238.0672
- Rent YoY
- —
- Metro
- Fort Wayne, IN
- State GDP YoY
- ▲ 2.90%
- F500 in state
- 18
Industry mix (Fortune 500 HQ in IN)
| Industry | F500 HQs | Revenue |
|---|---|---|
| Industrial Machinery | 2 | $37B |
|
||
| Healthcare | 1 | $177B |
|
||
| Pharmaceuticals | 1 | $45B |
|
||
| Metals / Steel | 1 | $18B |
|
||
| Agriculture | 1 | $17B |
|
||
| Packaging | 1 | $12B |
|
||
Price history
+80.3% since first listed16 events — show timeline
- 2026-04-30 Price Changed $174,900 IRMLS
- 2026-03-05 Listed $175,900 IRMLS
- 2025-10-21 Relisted — IRMLS
- 2025-10-11 Contingent — IRMLS
- 2025-09-09 Price Changed $175,900 IRMLS
- 2025-08-20 Price Changed $177,900 IRMLS
- 2025-07-24 Listed $179,900 IRMLS
- 2023-08-24 Sold (MLS) $170,000 IRMLS
- 2023-08-02 Delisted — IRMLS
- 2023-07-19 Pending — IRMLS
- 2023-07-17 Listed $162,500 IRMLS
- 2019-09-04 Sold (MLS) $97,000 IRMLS
- 2019-07-12 Listed $99,900 IRMLS
- 2018-10-12 Sold (MLS) $94,900 IRMLS
- 2018-09-09 Listed $94,900 IRMLS
- 2018-06-22 Listed $97,000 IRMLS
Property tax history
+20.2%/yrLatest (2024): $2,060 · +165.7% YoY. Source: county tax records.
Cash-flow waterfall
monthlySold comps — $/sqft
last 12 mo · ≤1 miLoading sold comps…