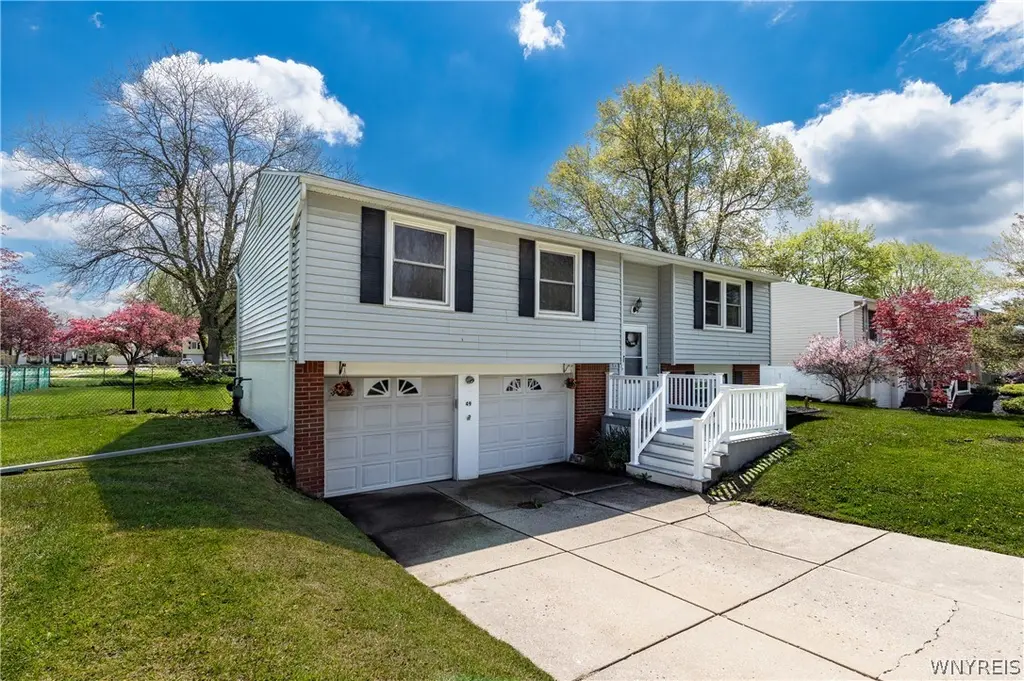
49 Paul Dr · University at Buffalo, NY
Flood risk 5/10 · Moderate
- FEMA flood zone
- X (shaded)
- Chance of flooding over 30 yrs
- 0.24%
- Est. flood insurance / yr
- $473 – $860
Fire risk 2/10 · Minimal
- Est. fire insurance / yr
- $691 – $1,283
Heat risk 2/10 · Minimal
- Hot days now (above 94°F)
- 7 days/yr
- Hot days in 30 yrs
- 15 days/yr
Wind risk 1/10 · Minimal
- Chance of severe wind over 30 yrs
- —
Air-quality risk 3/10 · Minor
- Unhealthy air days now
- 2 days/yr
- Unhealthy air days in 30 yrs
- 3 days/yr
Risk factors via First Street. Map © Google.
Why this score? — see what drove the C- grade
The composite is a weighted blend of 9 inputs, each scored 0–100. Each bar is that input's sub-score; the figure is the points it added to the 100-point composite (weight × sub-score).
- ARV discount +15.0/15.0
- Cash flow +13.1/30.0
- 1% rule +4.6/10.0
- Schools +4.5/10.0
- Livability +4.4/5.0
- DSCR +3.9/10.0
- Rent growth +2.5/5.0
- Condition / age +2.5/5.0
- Appreciation +0.0/10.0
$239,900
🖨 Deal sheet 📄 Offer letter ✓ Due diligence
Listing remarks
Showings begin tomorrow Tues 5/12/2026 @ 10 am. Offers due Monday May 18, 2026 @ 12noon Welcome to 49 Paul Drive! A charming home with a beautiful fenced- in back yard and a spacious deck off the family rom or your flex room! Nestled in a friendly neighborhood, this home offers three bedrooms and and two full baths. A cozy layout and a perfect space for entertaining. Lower level features new carpeting and new windows. Private utility area features 2025 furnace and hot water tank. Washer and dryer and all kitchen appliances ARE included. Don't miss this wonderful opportunity!
Key facts
- 2025 furnace
- New carpeting
- Spacious deck
Tags
Property features AI
Finance
- HOA & community: Trails/paths in the community
Exterior
- Parking: 2-car garage; Underground parking
- Utilities: Electricity connected (circuit breakers); Public water connected; Sewer connected
- Home design: 2-story house; Existing construction
- Construction: Brick and vinyl siding exterior; Asphalt roof; Block foundation; Below-grade finished area
- Exterior features: Concrete driveway; Near public transit; Rectangular residential lot; Road frontage on city street and main thoroughfare
Interior
- Kitchen: Electric oven; Electric range; Microwave; Refrigerator; Dishwasher
- Bedrooms: Bedroom 1 (Second level); Bedroom 2 (Second level); Bedroom 3 (Second level)
- Flooring: Carpet; Vinyl; Varied flooring
- Bathrooms: 2 full bathrooms
- Heating & cooling: Gas forced-air heating; Window air conditioning units
- Interior features: Dining area; Den; Formal dining room; Entrance foyer; Formal living room; Combined living/dining room; Window treatments; Drapes
- Laundry & utility: Washer; Dryer; Laundry in basement; Sump pump
Neighborhood map
What this means for you Summary
Snapshot
- This is a 3-bed/1.0-bath single-family listed at $240k.
Deal economics
- At list price, monthly cash flow is $-8 ($-101/yr) — negative.
- To cash-flow at today's rent, offer at most $238k (0.6% below list).
- To meet the 1% rule (rent ≥ 1% of price), the offer needs to be $230k (4.1% below list).
- Recommended offer: $230k (4.1% below list) — sets the bar for 1% rule.
- Cap rate 6.3% vs local median 2.8% in University at Buffalo — top-decile yield for the area; either an underpriced asset or a hidden risk that comps aren't pricing in. Stress-test before assuming the spread holds.
Location & tenants
- Location reads 88/100 on livability (#9 in NY, #176 nationally) — a professional / high-income tenant draw. Strengths: schools A+, amenities A+, commute A+; Watch: cost of living D+, employment F.
- Sweet Home Central School District (suburban): math 46% / reading 59% proficiency, ranked #342 of 590 in NY (top 58%) — acceptable for families but not a draw, mixed tenant base, ~2y average lease.
- Market conditions: 94 active listings in the ZIP; 9 comparable units currently listed for rent nearby; rentals leasing fast (median 2d on market — plan ~1-2 weeks tenant-placement turnaround); 1,244 units permitted in Erie County in 2024 (563 in 5+ unit buildings).
- This rent runs 37% of the median local income ($75k/yr) — at the standard rent-burdened threshold; future hikes will face affordability resistance.
Forward outlook
- Local home prices are declining (-3.0%/yr); year-one equity from $2k of loan paydown is wiped out by about $7k of value loss. Plan a longer hold.
Negotiation context
- Only 7 days on market — expect competitive offers; lowballing is unlikely to land.
Risks & watch-outs
- Climate carrying-cost: moderate flood risk — expect insurance premiums to compound above CPI over the hold.
Questions for the listing agent
- What do current leases actually rent for vs. the listed asking? Can we see a recent rent roll and the last 12 months of T-12 income?
- Built in 1967 — when were the roof, HVAC, electrical panel, plumbing, and water heater last replaced?
- Is there a deadline driving the sale (1031 exchange, divorce, estate, relocation)? That informs how much negotiation room exists.
- Schools are A-rated — typically a magnet for longer-tenancy family renters. What's the average tenant stay here, and is there a school-zone premium baked into asking?
- What's the average days-on-market for RENTAL listings here right now (not sales)? A rising rental-DOM trend means longer vacancies and softer asking-rent achievability than the comps imply.
- What's the recent tenant-quality profile in this submarket — average credit score on applications, eviction rate, late-payment / NSF rate, and stable-employment percentage? A property-management company in the area should have these aggregated.
- How much new for-sale + rental construction is in the pipeline within 1–3 miles? Heavy new supply typically softens prices + rents 12–24 months out; constrained supply supports both.
Investment metrics
- 1% rule
- 0.96% ✗
- Cap rate
- 6.25%
- Cash-on-cash
- -0.15%
- DSCR
- 0.99
- GRM
- 8.7
CMA / ARV
- ARV (median comp)
- $373,359
- List price
- $239,900
- Delta
- -35.75%
- Verdict
- UNDERPRICED
- Comps
- 20 within 1.0 mi
Show comp detail 12 sales within ~0.75 mi
| Address | Dist | Beds/Ba | Sqft | Sold | Price | $/sf | Match |
|---|---|---|---|---|---|---|---|
| 129 Ayrault Dr | 0.32mi | 3/1.5 | 1,920 (-1%) | 1mo | $370,000 | $193 | 79 |
| 183 Bucyrus Dr | 0.50mi | 4/1.5 (+1) | 1,898 (-3%) | 1mo | $295,000 | $155 | 65 |
| 150 Jeffrey Dr | 0.36mi | 4/1.5 (+1) | 1,878 (-4%) | 9mo | $326,000 | $174 | 63 |
| 130 Jeffrey Dr | 0.34mi | 4/1.5 (+1) | 1,856 (-5%) | 17mo | $335,000 | $180 | 55 |
| 2 Sunshine Dr | 0.47mi | 4/1.5 (+1) | 1,840 (-6%) | 16mo | $381,000 | $207 | 48 |
| 67 Jeffrey Dr | 0.35mi | 4/1.5 (+1) | 1,802 (-8%) | 21mo | $365,000 | $203 | 47 |
| 86 Hitching Post Ln | 0.75mi | 4/2.0 (+1) | 1,925 (-1%) | 10mo | $440,000 | $229 | 46 |
| 954 N French Rd | 0.35mi | 4/2.5 (+1) | 2,175 (+12%) | 9mo | $310,000 | $143 | 46 |
| 49 Jeffrey Dr | 0.36mi | 4/1.5 (+1) | 1,727 (-11%) | 22mo | $405,000 | $235 | 39 |
| 146 October Ln | 0.75mi | 4/2.0 (+1) | 2,147 (+10%) | 5mo | $400,000 | $186 | 35 |
| 4098 E Robinson Rd | 0.71mi | 4/2.0 (+1) | 1,666 (-14%) | 7mo | $350,000 | $210 | 28 |
| 57 Hitching Post Ln | 0.75mi | 3/1.5 | 1,665 (-14%) | 19mo | $377,000 | $226 | 23 |
Match score weights: distance 35% · size 25% · config 20% · recency 20%. Top-matched comps best support the ARV.
Projected returns pro-forma
-3.0% appreciation · 3.0% rent growth · sell at horizon
- IRR
- -16.5%
- Equity multiple
- 0.42×
- Total profit
- $-39,275
- Equity at exit
- $35,770
- IRR
- -8.1%
- Equity multiple
- 0.49×
- Total profit
- $-34,334
- Equity at exit
- $20,742
Cash invested: $67,172 (down + closing). Projections, not guarantees.
Landlord ↔ Tenant lean methodology
- Overall (STATE)
- 15 Strongly Tenant-Friendly
- State New York
- 15 Strongly Tenant-Friendly · D+10
- County
- — inherits STATE
- City
- — inherits STATE
ZIP-level market 14228
- Home prices YoY
- -31.9%
- Active inventory
- 94
- Price-to-rent
- 8.7×
Monthly cashflow live
- Estimated rent
- $2,299 high interval (Pro) →
- Mortgage (P&I)
- −$1,258
- Tax from tax record
- −$467 /mo · $5,604/yr
- Insurance
- −$100
- HOA
- −$0
- Vacancy / Maint / Mgmt
- −$483
- Net cashflow
- $-8
Break-even live
UW: 25.0% down · 7.5% · 30yr · 1.5% tax · 5.0% vac · 8.0% maint · 8.0% mgmt
Financing live
Cash to close
- Down payment
- $59,975
- Closing costs
- $7,197
- Reserves months
- —
- Total cash needed
- —
Loan-product check · same deal, 3 products live
Conventional
25% down · 7.5% · 30yr
- Down + closing
- —
- Monthly P&I
- —
- Monthly cashflow
- —
- DSCR
- —
- Eligible?
- —
Personal DTI + credit; lowest rate.
DSCR
20% down · 8.5% · 30yr
- Down + closing
- —
- Monthly P&I
- —
- Monthly cashflow
- —
- DSCR
- —
- Eligible?
- —
No personal income docs; deal must DSCR.
Hard money
10% down · 12.0% · 12mo
- Down + closing
- —
- Monthly P&I
- —
- Monthly cashflow
- —
- DSCR
- —
- Eligible?
- —
Short-term bridge; refi at stabilization.
Rent comps 9 comps
| Address | Beds | Baths | Sqft | Rent | $/sqft | DOM | Units | Dist |
|---|---|---|---|---|---|---|---|---|
| 133 Sunshine Dr Buffalo, NY | 3.0 | 1.0 | 1300 | $2,100 | $1.62 | 16d | 1 | 0.52mi |
| 212 Sunshine Dr Unit Left Buffalo, NY | 3.0 | 1.5 | 1300 | $2,099 | $1.61 | 1d | 1 | 0.57mi |
| 227 Sunshine Dr Unit 227 Buffalo, NY | 3.0 | 2.0 | 1450 | $2,799 | $1.93 | 1d | 1 | 0.61mi |
| 91 Marine Dr Amherst, NY | 3.0 | 1.0 | 1291 | $2,150 | $1.67 | 43d | 1 | 0.61mi |
| 157 Fairgreen Dr Unit Right side Buffalo, NY | 3.0 | 1.5 | 1500 | $2,300 | $1.53 | 1d | 1 | 0.94mi |
| 2217 Sweet Home Rd Buffalo, NY | 3.0–4.0 | 2.0–3.0 | 1372 | $2,400 | $1.75 | 1d | 1 | 0.99mi |
| 2217 Sweet Home Rd #50 Buffalo, NY | 3.0–4.0 | 2.0–3.0 | 1372 | $2,400 | $1.75 | 1d | 2 | 1.00mi |
| 175 Tonawanda Creek Rd Buffalo, NY | 2.0 | 1.5 | 1960 | $1,875 | $0.96 | 23d | 1 | 1.38mi |
| 2071 Sweet Home Rd Buffalo, NY | 3.0–4.0 | 3.0 | 1415 | $2,300 | $1.63 | 1d | 5 | 1.39mi |
Listing history 2 events
-
2026-05-19status Pending 589-char remark
-
2026-05-11$239,900 Active 589-char remark
ⓘ Source: listings_history table (triggers on properties + properties_extension) + one-shot
backfill from property_details.listing_events for pre-trigger history.
Tax reassessment forecast NY · Partial reset (capped growth)
- Current annual tax
- $5,604 · $467/mo
- Projected year-2 tax
- $5,604 · $467/mo
- Expected delta
- $0/yr ($0/mo · 0.0%)
ⓘ Screening estimate from a state-policy table — verify with the county assessor before closing.
Climate risk First Street
- Flood 5/10 Major FEMA zone X (shaded) · 24% chance over 30 yrs
- Wildfire 2/10 Low
- Heat 2/10 Low 7 d/yr ≥94°F today · 15 d/yr by 30 yrs out
- Wind 1/10 Low
- Air quality 3/10 Moderate 2 unhealthy d/yr today · 3 by 30 yrs out
Nearby sold comps map
Loading sold comps map…
Walkable amenities ~0.75 mi
Loading nearby amenities…
Taxation est. · year 1
- Rental income
- $27,594
- − Mortgage interest
- −$13,438
- − Property taxes
- −$5,604
- − Insurance
- −$1,200
- − Repairs & maintenance
- −$2,208
- − Management
- −$2,208
- − Depreciation
- −$6,979
- Taxable loss
- −$4,042
- Est. tax savings @ 24.0%
- +$970
- After-tax cash flow
- $869/yr
For passive investors: Depreciation is non-cash, so a rental often shows a tax loss while cash-flowing — sheltering income. Rental losses are passive: they offset passive income freely, and up to $25,000/yr can offset ordinary (W-2) income if you actively participate and your MAGI is under $100k (phasing out to $0 by $150k); unused losses carry forward. On sale, claimed depreciation is recaptured at up to 25%, and gains may owe capital-gains tax (a 1031 exchange can defer both). Figures are a year-1 estimate at your 24.0% rate — not tax advice; consult a CPA.
Schools (NCES district)
- District
- Sweet Home Central School District
- NCES district ID
- 3628500
- Math proficiency
- 46% ▼ -12.00%
- Reading proficiency
- 59% ▲ 4.00%
- Median HH income
- $48,509
- Composite
- 44.67/100
- National rank
- #2765
- State rank
- #342 of 590 in NY
Livability — University at Buffalo
- Score
- 88/100
- State rank
- #9
- US rank
- #176
Category grades
Schools grade is shown separately in the Schools card above.
Census & demographics
- County
- Erie County · 714,559 people
- City population
- 5,827
- Metro
- Buffalo-Cheektowaga, NY
- Population (ZIP)
- 25,350
- Household income
- $74,871
- Rent vs Own
- Severe rent burden
- 1566.0
Population outlook (Erie County) Hauer SSP2
- Today (2025)
- 933,037 people
- By 2030
- 935,181 · +0.2%
- By 2040
- 928,531 · -0.5%
- By 2050
- 905,725 · -2.9%
- By 2075
- 834,037 · -10.6%
- By 2100
- 708,033 · -24.1%
Race, ethnicity, and origin ACS 2023
- Neighborhood character
- Predominantly White (74%)
- Race & ethnicity
- White 74% Asian 13% Black 5% Hispanic / Latino 5% Two or more races 5%
- Hispanic origin (detail)
- Puerto Rican 3%
- Common ancestry
- Romanian 13% Scotch-Irish 2% Lithuanian 1%
- Foreign-born
- 17% · China, Canada, South Korea
- Languages at home
- 78% English-only · Chinese 6% Other Indo-European 4% Russian/Polish/Slavic 3%
Political lean MEDSL · Erie
- 2024 margin
- Lean D (+9.7) · D 54.8% · R 45.2%
- 2008→2024 swing
- -7.9pp toward R · 2008: 17.5pp · 2024: 9.7pp
- All cycles
- 2024: D+9.7 2020: D+14.7 2016: D+4.8 2012: D+15.6 2008: D+17.5
Not yet ingested
- Civics
- —
Market trends
- HPI YoY
- ▼ -148.08%
- Current HPI
- 316.3097
- Rent YoY
- —
- Metro
- Buffalo-Cheektowaga, NY
- State GDP YoY
- ▲ 2.60%
- F500 in state
- 92
Industry mix (Fortune 500 HQ in NY)
| Industry | F500 HQs | Revenue |
|---|---|---|
| Financial Services | 10 | $950B |
|
||
| Consumer Goods | 9 | $162B |
|
||
| Insurance | 4 | $225B |
|
||
| Telecommunications | 2 | $144B |
|
||
| Pharmaceuticals | 2 | $112B |
|
||
| Media / Entertainment | 2 | $69B |
|
||
Price history
2 events — show timeline
- 2026-05-19 Pending — WNYREIS
- 2026-05-11 Listed $239,900 WNYREIS
Property tax history
+4.8%/yrLatest (2025): $5,604 · -22.3% YoY. Source: county tax records.
Cash-flow waterfall
monthlySold comps — $/sqft
last 12 mo · ≤1 miLoading sold comps…