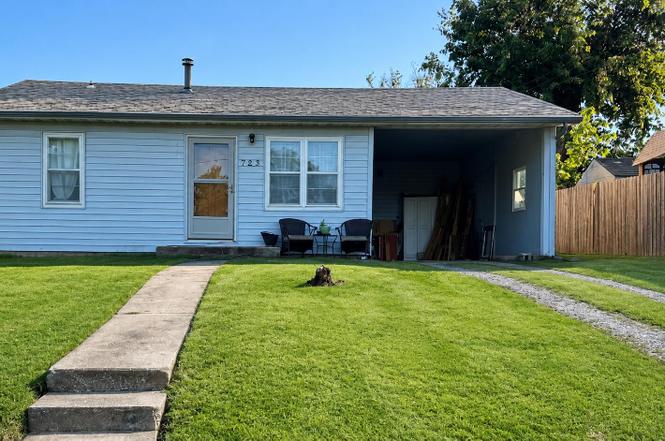
729 Rea St · Marshall, MO
Flood risk 1/10 · Minimal
- FEMA flood zone
- X (unshaded)
- Chance of flooding over 30 yrs
- 0.0%
- Est. flood insurance / yr
- $507 – $1,088
Fire risk 3/10 · Minor
- Est. fire insurance / yr
- $1,054 – $1,958
Heat risk 4/10 · Minor
- Hot days now (above 107°F)
- 7 days/yr
- Hot days in 30 yrs
- 17 days/yr
Wind risk 2/10 · Minimal
- Chance of severe wind over 30 yrs
- —
Air-quality risk 2/10 · Minimal
- Unhealthy air days now
- 0 days/yr
- Unhealthy air days in 30 yrs
- 1 days/yr
Risk factors via First Street. Map © Google.
Why this score? — see what drove the C- grade
The composite is a weighted blend of 9 inputs, each scored 0–100. Each bar is that input's sub-score; the figure is the points it added to the 100-point composite (weight × sub-score).
- Cash flow +21.6/30.0
- ARV discount +7.5/15.0
- DSCR +6.9/10.0
- 1% rule +4.7/10.0
- Livability +3.7/5.0
- Rent growth +2.5/5.0
- Condition / age +2.5/5.0
- Schools +1.9/10.0
- Appreciation +0.0/10.0
$85,000
🖨 Deal sheet 📄 Offer letter ✓ Due diligence
Listing remarks MLS
House has siding, new roof and new furnace and air to be installed prior to closing. House has nice size kitchen and living room. There is hardwood floors in some rooms. Call today. It won't last long.
Key facts
- 5,200 sq ft lot
- Built 1960
Property features AI
Exterior
- Home design: Single-family residence; One story
- Construction: 742 finished above-grade square footage
- Exterior features: Lot roughly 52 x 100; Zoned residential
Interior
- Kitchen: Refrigerator
- Heating & cooling: Has heating
- Interior features: Range; Oven
- Laundry & utility: Washer; Dryer
Neighborhood map
What this means for you Summary
Snapshot
- This is a 2-bed/1.0-bath other listed at $85k.
Deal economics
- At list price, monthly cash flow is $128 ($2k/yr) — positive.
- The deal already cash-flows at list — no discount required.
- To meet the 1% rule (rent ≥ 1% of price), the offer needs to be $82k (3.1% below list).
- Recommended offer: $82k (3.1% below list) — sets the bar for 1% rule.
- Cap rate 8.1% vs local median 4.7% in Marshall — top-decile yield for the area; either an underpriced asset or a hidden risk that comps aren't pricing in. Stress-test before assuming the spread holds.
Location & tenants
- Location reads 74/100 on livability (#62 in MO, #4,390 nationally) — a middle-class / working-renter tenant base. Strengths: cost of living A+, housing A+, health & safety A+; Watch: schools C-, employment D+, amenities F.
- Marshall (town): math 17% / reading 29% proficiency, ranked #296 of 324 in MO (top 91%) — low school quality limits family demand, transient renter base, plan for 1-2y turnover.
- Market conditions: 107 active listings in the ZIP; 11 units permitted in Saline County in 2024 (0 in 5+ unit buildings).
Forward outlook
- Local home prices are declining (-3.0%/yr); year-one equity from $588 of loan paydown is wiped out by about $3k of value loss. Plan a longer hold.
- Saline County population projected to shrink 7% by 2050 — rents likely to lag national; underwrite the cash flow, not the appreciation.
Negotiation context
- Only 1 days on market — expect competitive offers; lowballing is unlikely to land.
- 2 sale attempts since 5y ago with the ask held roughly flat each time — persistent listings suggest the price (not the market) is what's stuck; bring a comps-based counter.
Questions for the listing agent
- Built in 1960 — when were the roof, HVAC, electrical panel, plumbing, and water heater last replaced?
- Is there a deadline driving the sale (1031 exchange, divorce, estate, relocation)? That informs how much negotiation room exists.
- What's the average days-on-market for RENTAL listings here right now (not sales)? A rising rental-DOM trend means longer vacancies and softer asking-rent achievability than the comps imply.
- What's the recent tenant-quality profile in this submarket — average credit score on applications, eviction rate, late-payment / NSF rate, and stable-employment percentage? A property-management company in the area should have these aggregated.
- How much new for-sale + rental construction is in the pipeline within 1–3 miles? Heavy new supply typically softens prices + rents 12–24 months out; constrained supply supports both.
Investment metrics
- 1% rule
- 0.97% ✗
- Cap rate
- 8.11%
- Cash-on-cash
- 6.48%
- DSCR
- 1.29
- GRM
- 8.6
CMA / ARV
No comps found within radius.
Projected returns pro-forma
-3.0% appreciation · 3.0% rent growth · sell at horizon
- IRR
- -6.4%
- Equity multiple
- 0.76×
- Total profit
- $-5,621
- Equity at exit
- $12,674
- IRR
- 3.2%
- Equity multiple
- 1.23×
- Total profit
- $5,526
- Equity at exit
- $7,349
Cash invested: $23,800 (down + closing). Projections, not guarantees.
Landlord ↔ Tenant lean methodology
- Overall (STATE)
- 81 Strongly Landlord-Friendly
- State Missouri
- 81 Strongly Landlord-Friendly · R+10
- County
- — inherits STATE
- City
- — inherits STATE
ZIP-level market 65340
- Home prices YoY
- -31.4%
- Active inventory
- 107
- Price-to-rent
- 8.6×
Monthly cashflow live
- Estimated rent
- $823 medium interval (Pro) →
- Mortgage (P&I)
- −$446
- Tax from tax record
- −$41 /mo · $490/yr
- Insurance
- −$35
- HOA
- −$0
- Vacancy / Maint / Mgmt
- −$173
- Net cashflow
- $128
Break-even live
UW: 25.0% down · 7.5% · 30yr · 1.5% tax · 5.0% vac · 8.0% maint · 8.0% mgmt
Financing live
Cash to close
- Down payment
- $21,250
- Closing costs
- $2,550
- Reserves months
- —
- Total cash needed
- —
Loan-product check · same deal, 3 products live
Conventional
25% down · 7.5% · 30yr
- Down + closing
- —
- Monthly P&I
- —
- Monthly cashflow
- —
- DSCR
- —
- Eligible?
- —
Personal DTI + credit; lowest rate.
DSCR
20% down · 8.5% · 30yr
- Down + closing
- —
- Monthly P&I
- —
- Monthly cashflow
- —
- DSCR
- —
- Eligible?
- —
No personal income docs; deal must DSCR.
Hard money
10% down · 12.0% · 12mo
- Down + closing
- —
- Monthly P&I
- —
- Monthly cashflow
- —
- DSCR
- —
- Eligible?
- —
Short-term bridge; refi at stabilization.
Listing history 3 events
-
2026-06-17status $85,000 Pending 1 DOM
-
2026-06-16remarks 189-char remark
-
2026-06-16$85,000 Active 1 DOM
ⓘ Source: listings_history table (triggers on properties + properties_extension) + one-shot
backfill from property_details.listing_events for pre-trigger history.
Tax reassessment forecast MO · Resets to sale price
- Current annual tax
- $490 · $41/mo
- Projected year-2 tax
- $824 · $69/mo
- Expected delta
- +$335/yr (+$28/mo · 68.3%)
ⓘ Screening estimate from a state-policy table — verify with the county assessor before closing.
Climate risk First Street
- Flood 1/10 Low FEMA zone X (unshaded) · 0% chance over 30 yrs
- Wildfire 3/10 Moderate
- Heat 4/10 Moderate 7 d/yr ≥107°F today · 17 d/yr by 30 yrs out
- Wind 2/10 Low
- Air quality 2/10 Low 0 unhealthy d/yr today · 1 by 30 yrs out
Nearby sold comps map
Loading sold comps map…
Walkable amenities ~0.75 mi
Loading nearby amenities…
Taxation est. · year 1
- Rental income
- $9,880
- − Mortgage interest
- −$4,761
- − Property taxes
- −$490
- − Insurance
- −$425
- − Repairs & maintenance
- −$790
- − Management
- −$790
- − Depreciation
- −$2,473
- Taxable income
- $150
- Est. tax owed @ 24.0%
- −$36
- After-tax cash flow
- $1,505/yr
For passive investors: Depreciation is non-cash, so a rental often shows a tax loss while cash-flowing — sheltering income. Rental losses are passive: they offset passive income freely, and up to $25,000/yr can offset ordinary (W-2) income if you actively participate and your MAGI is under $100k (phasing out to $0 by $150k); unused losses carry forward. On sale, claimed depreciation is recaptured at up to 25%, and gains may owe capital-gains tax (a 1031 exchange can defer both). Figures are a year-1 estimate at your 24.0% rate — not tax advice; consult a CPA.
Schools (NCES district)
- District
- Marshall
- NCES district ID
- 2920410
- Math proficiency
- 17% ▼ -8.00%
- Reading proficiency
- 29% ▼ -1.00%
- Median HH income
- $38,967
- Composite
- 19.3/100
- National rank
- #8796
- State rank
- #296 of 324 in MO
Livability — Marshall
- Score
- 74/100
- State rank
- #62
- US rank
- #4390
Category grades
Schools grade is shown separately in the Schools card above.
Census & demographics
- Census place
- Marshall, MO
- Population (ZIP)
- 15,977
Population outlook (Saline County) Hauer SSP2
- Today (2025)
- 22,716 people
- By 2030
- 22,343 · -1.6%
- By 2040
- 21,596 · -4.9%
- By 2050
- 21,171 · -6.8%
- By 2075
- 20,680 · -9.0%
- By 2100
- 20,147 · -11.3%
Race, ethnicity, and origin ACS 2023
- Neighborhood character
- Predominantly White (72%)
- Race & ethnicity
- White 72% Hispanic / Latino 16% Two or more races 10% Black 5% Pacific Islander 1%
- Hispanic origin (detail)
- Mexican 7%
- Common ancestry
- Italian 2% Iranian 1% Slovak 1%
- Foreign-born
- 8% · Canada, Dominican Republic, China
- Languages at home
- 88% English-only · Spanish 11%
Political lean MEDSL · Saline
- 2024 margin
- Solid R (+40.4) · D 29.2% · R 69.7% · Other 1.1%
- 2008→2024 swing
- -37.9pp toward R · 2008: -2.5pp · 2024: -40.4pp
- All cycles
- 2024: R+40.4 2020: R+37.3 2016: R+34.5 2012: R+14.4 2008: R+2.5
Not yet ingested
- Civics
- —
Market trends
- HPI YoY
- ▼ -94.60%
- Current HPI
- 206.6714
- Rent YoY
- —
- Metro
- —
- State GDP YoY
- ▲ 1.84%
- F500 in state
- 20
Industry mix (Fortune 500 HQ in MO)
| Industry | F500 HQs | Revenue |
|---|---|---|
| Healthcare | 1 | $163B |
|
||
| Insurance | 1 | $21B |
|
||
| Industrial Technology | 1 | $17B |
|
||
| Retail | 1 | $16B |
|
||
| Industrial Distribution | 1 | $10B |
|
||
| Utilities | 1 | $9B |
|
||
Price history
+21.4% since first listed4 events — show timeline
- 2026-06-15 Listed $85,000 CMBR
- 2021-04-13 Sold (Public Records) — Public Records
- 2021-04-12 Sold (MLS) — CMBR
- 2021-02-28 Listed $70,000 CMBR
Property tax history
+4.3%/yrLatest (2025): $490 · +1.6% YoY. Source: county tax records.
Cash-flow waterfall
monthlySold comps — $/sqft
last 12 mo · ≤1 miLoading sold comps…