 Multi-family
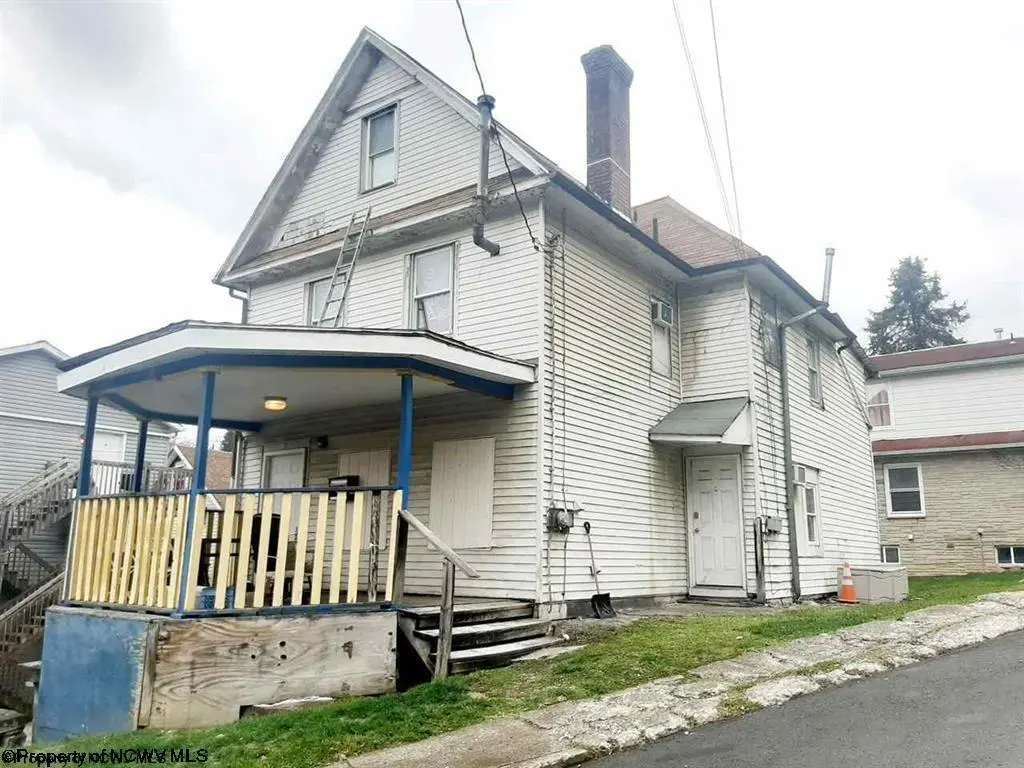
751 Snider · Morgantown, WV
Flood risk 1/10 · Minimal
- FEMA flood zone
- X (unshaded)
- Chance of flooding over 30 yrs
- 0.0%
- Est. flood insurance / yr
- $473 – $860
Fire risk 1/10 · Minimal
- Est. fire insurance / yr
- $787 – $1,461
Heat risk 4/10 · Minor
- Hot days now (above 97°F)
- 7 days/yr
- Hot days in 30 yrs
- 18 days/yr
Wind risk 1/10 · Minimal
- Chance of severe wind over 30 yrs
- —
Air-quality risk 2/10 · Minimal
- Unhealthy air days now
- 1 days/yr
- Unhealthy air days in 30 yrs
- 2 days/yr
Risk factors via First Street. Map © Google.
Why this score? — see what drove the B grade
The composite is a weighted blend of 9 inputs, each scored 0–100. Each bar is that input's sub-score; the figure is the points it added to the 100-point composite (weight × sub-score).
- Cash flow +30.0/30.0
- 1% rule +10.0/10.0
- DSCR +10.0/10.0
- ARV discount +9.7/15.0
- Livability +4.2/5.0
- Schools +4.1/10.0
- Rent growth +3.9/5.0
- Condition / age +2.5/5.0
- Appreciation +0.0/10.0
$180,000
🖨 Deal sheet (PDF) 📄 Offer letter ✓ Due diligence
Multi-family units
County records classify this as Multi-Family (2-4 Unit). Listing-text estimate: 1 unit. estimate disagrees with records
Listing remarks MLS
Snider St is a 5 bedroom/2.5 bath property that is currently leased through May 13th 2021. The property is unique with a living room, a den, a large attic bedroom, and two bedrooms with additional rooms attached to make larger rooms. This is a unique property! Tenants pay ALL utilities, also property comes with washer, dryer and dishwasher. Tenants pay $2,250 a month for rent.
Key facts
- Fire safety system
- New roof
- 4,356 sq ft lot
Tags
Property features AI
Exterior
- Parking: On-street parking
- Utilities: Public water; Public sewer; Cable available
- Home design: Single-family detached residence; 4 stories
- Construction: Frame with vinyl siding; Shingle roof; Has basement
- Exterior features: Porch; Corner lot
Interior
- Kitchen: Dishwasher; Range; Refrigerator
- Flooring: Laminate flooring; Vinyl flooring
- Bathrooms: 2 full bathrooms; 1 half bathroom
- Heating & cooling: Natural gas heating; Window air conditioning units
- Interior features: Dishwasher; Dryer; Refrigerator; Range; Washer; Unfinished basement
- Laundry & utility: Washer; Dryer
Neighborhood map
What this means for you Summary
Snapshot
- This is a 5-bed/2.0-bath multifamily listed at $180k.
Deal economics
- At list price, monthly cash flow is $2k ($23k/yr) — positive.
- The deal already cash-flows at list — no discount required.
- Meets the 1% rule at list price ($4k rent vs $180k).
- Recommended offer: $175k (3.0% below list) — sets the bar for market timing.
- Cap rate 19.0% vs local median 3.0% in Morgantown — top-decile yield for the area; either an underpriced asset or a hidden risk that comps aren't pricing in. Stress-test before assuming the spread holds.
Location & tenants
- Location reads 84/100 on livability (#5 in WV, #674 nationally) — a professional / high-income tenant draw. Strengths: amenities A+, commute A+, cost of living A+; Watch: employment D-.
- Monongalia County Schools (urban): math 45% / reading 53% proficiency, ranked #1 of 55 in WV (top 2%) — families likely to look elsewhere, expect single-tenant / working-renter base with shorter leases.
- Zoned schools: Eastwood Elementary School (math 45% / reading 47%, grade D-, #68 of 377 statewide, top 18%, 586 students, 0% FRL); Mountaineer Middle School (math 52% / reading 60%, grade B-, #1 of 109 statewide, top 0%, 619 students, 0% FRL); Morgantown High School (math 49% / reading 73%, grade C+, #2 of 110 statewide, top 1%, 1,859 students, 0% FRL) — zoned schools average 0% FRL vs 32% district-wide (32 pts lower); this property's tenant base skews higher-income than the district average.
- Market conditions: Rents rising fast (+5.5%/yr); 123 active listings in the ZIP; 23 units permitted in Monongalia County in 2024 (15 in 5+ unit buildings).
- At $3,872/mo this rent would consume 102% of the median local household income ($46k/yr) (locally 3256% of renters already pay >50% of income on rent) — very limited rent-growth headroom before tenants either downsize or default.
Forward outlook
- Local home prices are declining (-3.0%/yr); year-one equity from $1k of loan paydown is wiped out by about $5k of value loss. Plan a longer hold.
- Monongalia County population projected at +38% by 2050 — long-run rental-demand tailwind backs the buy-and-hold thesis.
- At projected returns (-3.0% appreciation + 5.5% rent growth), your $50k cash investment doubles in ~3 years — after that, you're playing with house money.
Negotiation context
- It's been on market 32 days — a 3% lower offer ($175k) is reasonable based on typical stale-listing flexibility.
- 2 sale attempts since 6y ago with the ask held roughly flat each time — persistent listings suggest the price (not the market) is what's stuck; bring a comps-based counter.
- Current owner paid $155k; 16% above their basis — modest negotiation headroom, anchor on the comps not their cost.
Risks & watch-outs
- Watch-outs: built in 1920 — expect roof / HVAC / electrical / plumbing capex.
Questions for the listing agent
- It's been on market 32 days. Have you received any prior offers? Is the seller open to a 3% concession, seller financing, or rate buy-down credit?
- Built in 1920 — when were the roof, HVAC, electrical panel, plumbing, and water heater last replaced?
- Is there a deadline driving the sale (1031 exchange, divorce, estate, relocation)? That informs how much negotiation room exists.
- Schools are D-rated, which usually means shorter tenancies and higher turnover. Who's the typical renter profile here, and what's been the actual vacancy rate?
- What's the average days-on-market for RENTAL listings here right now (not sales)? A rising rental-DOM trend means longer vacancies and softer asking-rent achievability than the comps imply.
- What's the recent tenant-quality profile in this submarket — average credit score on applications, eviction rate, late-payment / NSF rate, and stable-employment percentage? A property-management company in the area should have these aggregated.
- How much new apartment / multifamily construction is in the pipeline within 1–3 miles? Heavy new supply (>2% of stock underway) typically softens rents 12–24 months out; light construction supports rent growth.
Investment metrics
- 1% rule
- 2.15% ✓
- Cap rate
- 19.00%
- Cash-on-cash
- 45.37%
- DSCR
- 3.02
- GRM
- 3.9
CMA / ARV
- ARV (on-the-fly)
- $189,090
- Comps found
- 11
Show comp detail 11 sales within ~0.75 mi
| Address | Dist | Beds/Ba | Sqft | Sold | Price | $/sf | Match |
|---|---|---|---|---|---|---|---|
| 752 Weaver St | 0.04mi | 6/3.0 (+1) | 1,947 (+2%) | 16mo | $150,000 | $77 | 72 |
| 409 Forest Ave | 0.31mi | 6/2.0 (+1) | 1,769 (-7%) | 2mo | $230,000 | $130 | 66 |
| 450 Dallas St | 0.31mi | 5/2.5 | 1,815 (-5%) | 12mo | $170,000 | $94 | 65 |
| 595 Brockway Ave | 0.44mi | 5/3.0 | 2,060 (+8%) | 0mo | $165,000 | $80 | 62 |
| 352 Stewart St | 0.47mi | 6/2.5 (+1) | 1,846 (-3%) | 12mo | $295,000 | $160 | 56 |
| 301 Richwood Ave | 0.23mi | 5/2.0 | 1,680 (-12%) | 19mo | $166,000 | $99 | 53 |
| 445 Overhill | 0.67mi | 4/2.0 (-1) | 1,948 (+2%) | 14mo | $10,000 | $5 | 48 |
| 228 Cornell Ave | 0.23mi | 5/2.5 | 1,625 (-15%) | 22mo | $205,500 | $126 | 44 |
| 69 Highland Ave | 0.55mi | 4/2.0 (-1) | 2,100 (+10%) | 18mo | $230,000 | $110 | 38 |
| 236 Quay | 0.62mi | 4/2.0 (-1) | 1,757 (-8%) | 19mo | $214,000 | $122 | 37 |
| 565 E Brockway | 0.74mi | 4/2.0 (-1) | 1,773 (-7%) | 21mo | $150,000 | $85 | 31 |
Match score weights: distance 35% · size 25% · config 20% · recency 20%. Top-matched comps best support the ARV.
Projected returns pro-forma
-3.0% appreciation · 5.46% rent growth · sell at horizon
- IRR
- 45.2%
- Equity multiple
- 3.02×
- Total profit
- $102,014
- Equity at exit
- $26,839
- IRR
- 52.1%
- Equity multiple
- 6.70×
- Total profit
- $287,490
- Equity at exit
- $15,563
Cash invested: $50,400 (down + closing). Projections, not guarantees.
Landlord ↔ Tenant lean methodology
- Overall (STATE)
- 83 Strongly Landlord-Friendly
- State West Virginia
- 83 Strongly Landlord-Friendly · R+22
- County
- — inherits STATE
- City
- — inherits STATE
ZIP-level market 26505
- Home prices YoY
- -31.9%
- Rents YoY
- 5.5%
- Active inventory
- 123
- Price-to-rent
- 15.5×
Monthly cashflow live
- Estimated rent
- $3,872 medium interval (Pro) →
- Mortgage (P&I)
- −$944
- Tax from tax record
- −$134 /mo · $1,614/yr
- Insurance
- −$75
- HOA
- −$0
- Vacancy / Maint / Mgmt
- −$813
- Net cashflow
- $1,905
Break-even live
Sensitivity live
| Price | -10% $2,007 | -5% $1,956 | +0% $1,905 | +5% $1,855 | +10% $1,804 |
|---|---|---|---|---|---|
| Rent | -10% $1,600 | -5% $1,753 | +0% $1,905 | +5% $2,058 | +10% $2,211 |
| Rate | -1.0pp $1,996 | -0.5pp $1,951 | base $1,905 | +0.5pp $1,859 | +1.0pp $1,811 |
4-unit breakdown (identical units grouped — click to expand)
| Units | Beds | Baths | Est. rent |
|---|---|---|---|
| 4× units | 2 | 1 | $3,872 |
| #1 | 2 | 1 | $968 |
| #2 | 2 | 1 | $968 |
| #3 | 2 | 1 | $968 |
| #4 | 2 | 1 | $968 |
| Total (4 units) | $3,872 | ||
UW: 25.0% down · 7.5% · 30yr · 1.5% tax · 5.0% vac · 8.0% maint · 8.0% mgmt
Financing live
Cash to close
- Down payment
- $45,000
- Closing costs
- $5,400
- Reserves months
- —
- Total cash needed
- —
Loan-product check · same deal, 3 products live
Conventional
25% down · 7.5% · 30yr
- Down + closing
- —
- Monthly P&I
- —
- Monthly cashflow
- —
- DSCR
- —
- Eligible?
- —
Personal DTI + credit; lowest rate.
DSCR
20% down · 8.5% · 30yr
- Down + closing
- —
- Monthly P&I
- —
- Monthly cashflow
- —
- DSCR
- —
- Eligible?
- —
No personal income docs; deal must DSCR.
Hard money
10% down · 12.0% · 12mo
- Down + closing
- —
- Monthly P&I
- —
- Monthly cashflow
- —
- DSCR
- —
- Eligible?
- —
Short-term bridge; refi at stabilization.
Listing history 23 events
-
2026-06-21days on market $180,000 Active 32 DOM
-
2026-06-19days on market $180,000 Active 30 DOM
-
2026-06-18days on market $180,000 Active 29 DOM
-
2026-06-17days on market $180,000 Active 28 DOM
-
2026-06-16days on market $180,000 Active 27 DOM
-
2026-06-15days on market $180,000 Active 26 DOM
-
2026-06-14days on market $180,000 Active 24 DOM
-
2026-06-13days on market $180,000 Active 23 DOM
-
2026-06-10days on market $180,000 Active 21 DOM
-
2026-06-09days on market $180,000 Active 20 DOM
-
2026-06-08days on market $180,000 Active 19 DOM
-
2026-06-07days on market $180,000 Active 18 DOM
-
2026-06-05days on market $180,000 Active 15 DOM
-
2026-06-03days on market $180,000 Active 14 DOM
-
2026-06-02days on market $180,000 Active 13 DOM
-
2026-06-01days on market $180,000 Active 12 DOM
-
2026-05-31days on market $180,000 Active 11 DOM
-
2026-05-30days on market $180,000 Active 10 DOM
-
2026-05-21$180,000 Active
-
2022-02-28soldstatus $155,000
-
2022-02-25soldstatus $155,000 379-char remark
Show marketing remark (379 chars)
Snider St is a 5 bedroom/2.5 bath property that is currently leased through May 13th 2021. The property is unique with a living room, a den, a large attic bedroom, and two bedrooms with additional rooms attached to make larger rooms. This is a unique property! Tenants pay ALL utilities, also property comes with washer, dryer and dishwasher. Tenants pay $2,250 a month for rent.
-
2020-08-26$165,000 379-char remark
Show marketing remark (379 chars)
Snider St is a 5 bedroom/2.5 bath property that is currently leased through May 13th 2021. The property is unique with a living room, a den, a large attic bedroom, and two bedrooms with additional rooms attached to make larger rooms. This is a unique property! Tenants pay ALL utilities, also property comes with washer, dryer and dishwasher. Tenants pay $2,250 a month for rent.
-
1997-10-02soldstatus $41,000
ⓘ Source: listings_history table (triggers on properties + properties_extension) + one-shot
backfill from property_details.listing_events for pre-trigger history.
Tax reassessment forecast WV · Resets to sale price
- Current annual tax
- $1,614 · $134/mo
- Projected year-2 tax
- $1,614 · $134/mo
- Expected delta
- $0/yr ($0/mo · 0.0%)
ⓘ Screening estimate from a state-policy table — verify with the county assessor before closing.
Climate risk First Street
- Flood 1/10 Low FEMA zone X (unshaded) · 0% chance over 30 yrs
- Wildfire 1/10 Low
- Heat 4/10 Moderate 7 d/yr ≥97°F today · 18 d/yr by 30 yrs out
- Wind 1/10 Low
- Air quality 2/10 Low 1 unhealthy d/yr today · 2 by 30 yrs out
Nearby sold comps map
Loading sold comps map…
Walkable amenities ~0.75 mi
Loading nearby amenities…
Taxation est. · year 1
- Rental income
- $46,464
- − Mortgage interest
- −$10,083
- − Property taxes
- −$1,614
- − Insurance
- −$900
- − Repairs & maintenance
- −$3,717
- − Management
- −$3,717
- − Depreciation
- −$5,236
- Taxable income
- $21,197
- Est. tax owed @ 24.0%
- −$5,087
- After-tax cash flow
- $17,778/yr
For passive investors: Depreciation is non-cash, so a rental often shows a tax loss while cash-flowing — sheltering income. Rental losses are passive: they offset passive income freely, and up to $25,000/yr can offset ordinary (W-2) income if you actively participate and your MAGI is under $100k (phasing out to $0 by $150k); unused losses carry forward. On sale, claimed depreciation is recaptured at up to 25%, and gains may owe capital-gains tax (a 1031 exchange can defer both). Figures are a year-1 estimate at your 24.0% rate — not tax advice; consult a CPA.
Schools (NCES district)
- District
- Monongalia County Schools
- NCES district ID
- 5400930
- Math proficiency
- 45% ▼ -5.00%
- Reading proficiency
- 53% ▼ -2.00%
- Median HH income
- $43,820
- Composite
- 41.34/100
- National rank
- #3503
- State rank
- #1 of 55 in WV
Livability — Morgantown
- Score
- 84/100
- State rank
- #5
- US rank
- #674
Category grades
Schools grade is shown separately in the Schools card above.
Census & demographics
- Census place
- Morgantown, WV
- County
- Monongalia County · 97,252 people
- City population
- 97,252
- Metro
- Morgantown, WV
- Population (ZIP)
- 37,492
- Household income
- $45,536
- Rent vs Own
- Severe rent burden
- 3256.0
Population outlook (Monongalia County) Hauer SSP2
- Today (2025)
- 122,188 people
- By 2030
- 131,536 · +7.7%
- By 2040
- 149,777 · +22.6%
- By 2050
- 168,245 · +37.7%
- By 2075
- 207,979 · +70.2%
- By 2100
- 239,430 · +96.0%
Race, ethnicity, and origin ACS 2023
- Neighborhood character
- Predominantly White (82%)
- Race & ethnicity
- White 82% Asian 6% Two or more races 5% Black 4% Hispanic / Latino 3%
- Common ancestry
- Romanian 5% Slovak 3% Italian 2%
- Foreign-born
- 10% · China, Canada, Vietnam
- Languages at home
- 88% English-only · Arabic 3% Other Indo-European 2% Chinese 2%
Political lean MEDSL · Monongalia
- 2024 margin
- Toss-up / Even · D 46.5% · R 50.9% · Other 2.7%
- 2008→2024 swing
- -8.2pp toward R · 2008: 3.9pp · 2024: -4.4pp
- All cycles
- 2024: R+4.4 2020: R+1.2 2016: R+10.4 2012: R+9.7 2008: D+3.9
Not yet ingested
- Civics
- —
Market trends
- HPI YoY
- ▼ -100.05%
- Current HPI
- 213.749
- Rent YoY
- ▲ 5.46%
- Metro
- Morgantown, WV
- State GDP YoY
- —
- F500 in state
- 0
Price history
+339.0% since first listed5 events — show timeline
- 2026-05-21 Listed $180,000 NCWVREIN
- 2022-02-28 Sold (Public Records) $155,000 Public Records
- 2022-02-25 Sold (MLS) $155,000 NCWVREIN
- 2020-08-26 Listed $165,000 NCWVREIN
- 1997-10-02 Sold (Public Records) $41,000 Public Records
Property tax history
+3.3%/yrLatest (2025): $1,614 · +0.2% YoY. Source: county tax records.
Cash-flow waterfall
monthlySold comps — $/sqft
last 12 mo · ≤1 miLoading sold comps…