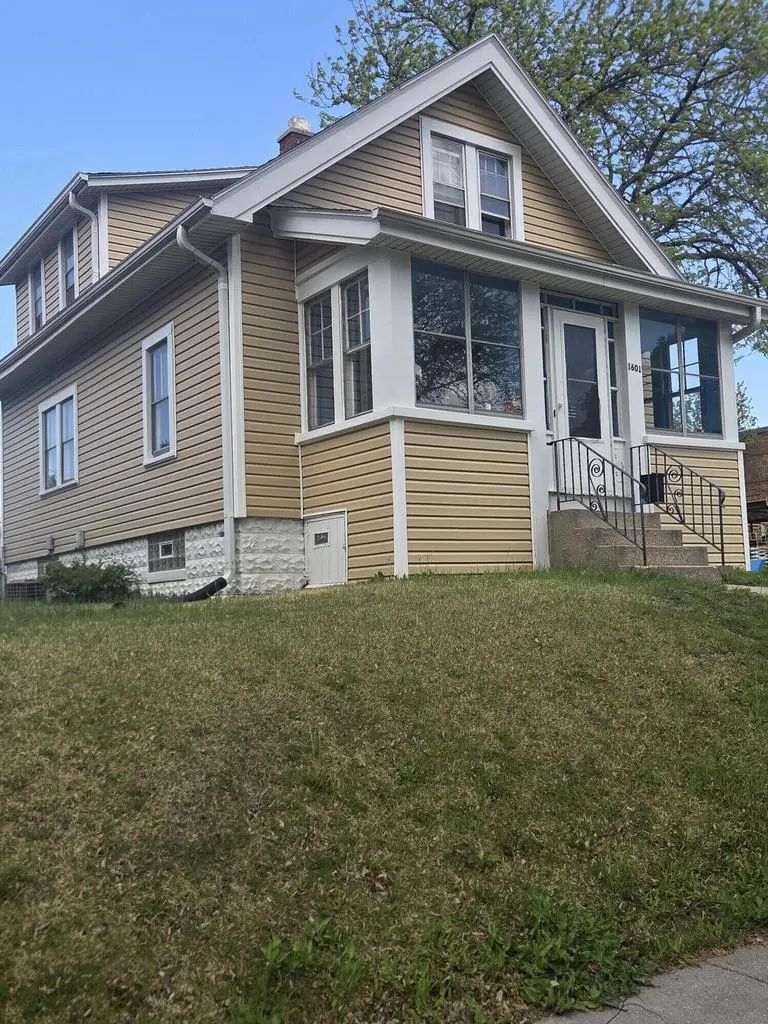
1601 S 65th St · West Allis, WI
Flood risk 1/10 · Minimal
- FEMA flood zone
- X (unshaded)
- Chance of flooding over 30 yrs
- 0.0%
- Est. flood insurance / yr
- $473 – $860
Fire risk 1/10 · Minimal
- Est. fire insurance / yr
- $636 – $1,182
Heat risk 2/10 · Minimal
- Hot days now (above 99°F)
- 7 days/yr
- Hot days in 30 yrs
- 13 days/yr
Wind risk 2/10 · Minimal
- Chance of severe wind over 30 yrs
- —
Air-quality risk 2/10 · Minimal
- Unhealthy air days now
- 1 days/yr
- Unhealthy air days in 30 yrs
- 1 days/yr
Risk factors via First Street. Map © Google.
Why this score? — see what drove the C- grade
The composite is a weighted blend of 9 inputs, each scored 0–100. Each bar is that input's sub-score; the figure is the points it added to the 100-point composite (weight × sub-score).
- Cash flow +15.3/30.0
- ARV discount +15.0/15.0
- DSCR +4.7/10.0
- 1% rule +4.6/10.0
- Rent growth +4.6/5.0
- Livability +4.0/5.0
- Condition / age +2.5/5.0
- Schools +1.9/10.0
- Appreciation +0.0/10.0
$174,900
🖨 Deal sheet (PDF) 📄 Offer letter ✓ Due diligence
Key facts
- 6,098 sq ft lot
- 2 garage spots
- Built 1923
Neighborhood map
What this means for you Summary
Snapshot
- This is a 3-bed/1.0-bath single-family listed at $175k.
Deal economics
- At list price, monthly cash flow is $64 ($764/yr) — positive.
- The deal already cash-flows at list — no discount required.
- To meet the 1% rule (rent ≥ 1% of price), the offer needs to be $168k (3.7% below list).
- Recommended offer: $168k (3.7% below list) — sets the bar for 1% rule.
- Cap rate 6.7% vs local median 4.3% in West Allis — top-decile yield for the area; either an underpriced asset or a hidden risk that comps aren't pricing in. Stress-test before assuming the spread holds.
Location & tenants
- Location reads 79/100 on livability (#69 in WI, #1,958 nationally) — a middle-class / working-renter tenant base. Strengths: commute A+, cost of living A+, housing A+; Watch: amenities F.
- West Allis-West Milwaukee School District (urban): math 17% / reading 26% proficiency, ranked #328 of 342 in WI (top 96%) — low school quality limits family demand, transient renter base, plan for 1-2y turnover.
- Zoned schools: Horace Mann Elementary (math 12% / reading 12%, grade F, #928 of 1,041 statewide, top 90%, 398 students, 82% FRL); West Milwaukee Intermediate (math 11% / reading 21%, grade F, #365 of 383 statewide, top 95%, 304 students, 79% FRL); Central High (math 8% / reading 14%, grade F, #438 of 483 statewide, top 91%, 1,007 students, 68% FRL) — zoned schools average 76% FRL vs 48% district-wide (28 pts higher); higher-poverty schools than district average — tighter screening recommended.
- Market conditions: Rents rising fast (+8.3%/yr); 52 active listings in the ZIP; 24 comparable units currently listed for rent nearby; rentals at typical pace (median 14d on market — plan ~3-4 weeks tenant-placement turnaround); 1,017 units permitted in Milwaukee County in 2024 (803 in 5+ unit buildings).
- This rent runs 33% of the median local income ($61k/yr) — at the standard rent-burdened threshold; future hikes will face affordability resistance.
Forward outlook
- Local home prices are declining (-3.0%/yr); year-one equity from $1k of loan paydown is wiped out by about $5k of value loss. Plan a longer hold.
- Milwaukee County population projected at +4% by 2050 — modest demand growth; plan on rents tracking national, not racing it.
Negotiation context
- Only 5 days on market — expect competitive offers; lowballing is unlikely to land.
Risks & watch-outs
- Watch-outs: built in 1923 — expect roof / HVAC / electrical / plumbing capex.
Questions for the listing agent
- Built in 1923 — when were the roof, HVAC, electrical panel, plumbing, and water heater last replaced?
- Is there a deadline driving the sale (1031 exchange, divorce, estate, relocation)? That informs how much negotiation room exists.
- What's the average days-on-market for RENTAL listings here right now (not sales)? A rising rental-DOM trend means longer vacancies and softer asking-rent achievability than the comps imply.
- What's the recent tenant-quality profile in this submarket — average credit score on applications, eviction rate, late-payment / NSF rate, and stable-employment percentage? A property-management company in the area should have these aggregated.
- How much new for-sale + rental construction is in the pipeline within 1–3 miles? Heavy new supply typically softens prices + rents 12–24 months out; constrained supply supports both.
Investment metrics
- 1% rule
- 0.96% ✗
- Cap rate
- 6.73%
- Cash-on-cash
- 1.56%
- DSCR
- 1.07
- GRM
- 8.7
CMA / ARV
- ARV (on-the-fly)
- $209,880
- Comps found
- 12
Show comp detail 12 sales within ~0.75 mi
| Address | Dist | Beds/Ba | Sqft | Sold | Price | $/sf | Match |
|---|---|---|---|---|---|---|---|
| 1601 S 65th St | 0.00mi | 3/1.0 | 990 (0%) | 0mo | $201,000 | $203 | 100 |
| 6220 W Burnham St | 0.28mi | 3/1.0 | 990 (0%) | 2mo | $189,900 | $192 | 85 |
| 1929 S 72nd St | 0.57mi | 3/2.0 | 1,000 (+1%) | 1mo | $210,000 | $210 | 67 |
| 6508 W Mitchell St | 0.09mi | 3/1.0 | 1,129 (+14%) | 6mo | $225,000 | $199 | 67 |
| 2057 S 70th St | 0.60mi | 2/1.0 (-1) | 990 (0%) | 2mo | $170,000 | $172 | 66 |
| 1108 S 65th St | 0.41mi | 2/1.0 (-1) | 897 (-9%) | 0mo | $230,000 | $256 | 60 |
| 2243 S 63rd St | 0.70mi | 3/2.0 | 1,005 (+2%) | 1mo | $307,000 | $305 | 60 |
| 2180 S 60th St | 0.68mi | 2/1.0 (-1) | 1,000 (+1%) | 6mo | $225,000 | $225 | 57 |
| 2065 S 71st St | 0.64mi | 3/1.0 | 1,052 (+6%) | 4mo | $230,000 | $219 | 56 |
| 1220 S 65th St | 0.34mi | 2/1.0 (-1) | 858 (-13%) | 3mo | $185,000 | $216 | 54 |
| 2140 S 70th St | 0.67mi | 3/1.0 | 1,080 (+9%) | 5mo | $195,000 | $181 | 49 |
| 2219 S 59th St | 0.75mi | 3/2.0 | 1,134 (+14%) | 4mo | $240,000 | $212 | 33 |
Match score weights: distance 35% · size 25% · config 20% · recency 20%. Top-matched comps best support the ARV.
Projected returns pro-forma
-3.0% appreciation · 8.0% rent growth · sell at horizon
- IRR
- -8.1%
- Equity multiple
- 0.69×
- Total profit
- $-15,322
- Equity at exit
- $26,078
- IRR
- 7.2%
- Equity multiple
- 1.67×
- Total profit
- $32,645
- Equity at exit
- $15,122
Cash invested: $48,972 (down + closing). Projections, not guarantees.
Landlord ↔ Tenant lean methodology
- Overall (STATE)
- 73 Landlord-Friendly
- State Wisconsin
- 73 Landlord-Friendly · R+2
- County
- — inherits STATE
- City
- — inherits STATE
ZIP-level market 53214
- Home prices YoY
- -28.9%
- Rents YoY
- 8.3%
- Active inventory
- 52
- Price-to-rent
- 8.7×
Monthly cashflow live
- Estimated rent
- $1,684 high interval (Pro) →
- Mortgage (P&I)
- −$917
- Tax from tax record
- −$277 /mo · $3,323/yr
- Insurance
- −$73
- HOA
- −$0
- Vacancy / Maint / Mgmt
- −$354
- Net cashflow
- $64
Break-even live
Sensitivity live
| Price | -10% $163 | -5% $113 | +0% $64 | +5% $14 | +10% $-35 |
|---|---|---|---|---|---|
| Rent | -10% $-69 | -5% $-3 | +0% $64 | +5% $130 | +10% $197 |
| Rate | -1.0pp $152 | -0.5pp $108 | base $64 | +0.5pp $18 | +1.0pp $-28 |
UW: 25.0% down · 7.5% · 30yr · 1.5% tax · 5.0% vac · 8.0% maint · 8.0% mgmt
Financing live
Cash to close
- Down payment
- $43,725
- Closing costs
- $5,247
- Reserves months
- —
- Total cash needed
- —
Loan-product check · same deal, 3 products live
Conventional
25% down · 7.5% · 30yr
- Down + closing
- —
- Monthly P&I
- —
- Monthly cashflow
- —
- DSCR
- —
- Eligible?
- —
Personal DTI + credit; lowest rate.
DSCR
20% down · 8.5% · 30yr
- Down + closing
- —
- Monthly P&I
- —
- Monthly cashflow
- —
- DSCR
- —
- Eligible?
- —
No personal income docs; deal must DSCR.
Hard money
10% down · 12.0% · 12mo
- Down + closing
- —
- Monthly P&I
- —
- Monthly cashflow
- —
- DSCR
- —
- Eligible?
- —
Short-term bridge; refi at stabilization.
Rent comps 24 comps
| Address | Beds | Baths | Sqft | Rent | $/sqft | DOM | Units | Dist |
|---|---|---|---|---|---|---|---|---|
| 6516 W National Ave Unit 1460-110 West Allis, WI | 2.0 | 1.0 | 1080 | $1,815 | $1.68 | 18d | 1 | 0.10mi |
| 6400 W Greenfield Ave West Allis, WI | 2.0 | 1.0 | 950 | $2,148 | $2.26 | 0d | 3 | 0.21mi |
| 6901 W Mitchell St Unit 6903 West Allis, WI | 2.0 | 1.0 | 800 | $1,150 | $1.44 | 25d | 1 | 0.34mi |
| 6901 W Mitchell St Unit 6903 West Allis, WI | 2.0 | 1.0 | 800 | $945 | $1.18 | 5d | 1 | 0.34mi |
| 1732 S 71st St Unit 1732 West Allis, WI | 3.0 | 1.0 | 912 | $1,795 | $1.97 | 14d | 1 | 0.45mi |
| 1414 S 55th St Unit 4 West Milwaukee, WI | 2.0 | 1.0 | 800 | $995 | $1.24 | 14d | 1 | 0.62mi |
| 1673 S 54th St Milwaukee, WI | 2.0 | 1.0 | 750 | $1,250 | $1.67 | 25d | 1 | 0.64mi |
| 1553 S 75th St Unit 1553 West Allis, WI | 2.0 | 1.0 | 1008 | $1,595 | $1.58 | 5d | 1 | 0.68mi |
| 5832 W Walker St Milwaukee, WI | 3.0 | 1.0 | 981 | $1,300 | $1.33 | 25d | 1 | 0.69mi |
| 7500 W Greenfield Ave Unit 7504 Upper West Allis, WI | 2.0 | 1.0 | 844 | $1,250 | $1.48 | 25d | 1 | 0.70mi |
| 642 S 66th St Milwaukee, WI | 3.0 | 1.0 | 1059 | $1,770 | $1.67 | 19d | 1 | 0.77mi |
| 638 S 66th St Milwaukee, WI | 3.0 | 1.0 | 1104 | $1,795 | $1.63 | 16d | 1 | 0.78mi |
| 1467 S 78th St Milwaukee, WI | 2.0 | 1.0 | 1000 | $1,500 | $1.50 | 14d | 1 | 0.86mi |
| 2329 S 51st St Unit 2359 202 Milwaukee, WI | 2.0 | 2.0 | 1100 | $1,350 | $1.23 | 46d | 1 | 1.13mi |
| 2329 S 51st St Unit 2349 204 Milwaukee, WI | 2.0 | 2.0 | 1060 | $1,395 | $1.32 | 6d | 1 | 1.13mi |
| 2028 S 81st St West Allis, WI | 2.0 | 1.0 | 930 | $1,600 | $1.72 | 25d | 1 | 1.14mi |
| 2034 S 81st St West Allis, WI | 2.0 | 1.0 | 900 | $1,800 | $2.00 | 5d | 1 | 1.14mi |
| 1482 S 84th St Milwaukee, WI | 1.0–2.0 | 1.0–2.0 | 1077 | $2,500 | $2.32 | 0d | 33 | 1.20mi |
| 1119 S Westchester St Milwaukee, WI | 2.0 | 2.0 | 950 | $1,500 | $1.58 | 4d | 3 | 1.23mi |
| 1501 S 84th St Unit 8405 Upper West Allis, WI | 2.0 | 1.0 | 950 | $1,195 | $1.26 | 5d | 1 | 1.23mi |
| 2238 S 82nd St Milwaukee, WI | 2.0 | 1.0 | 1000 | $1,360 | $1.36 | 5d | 1 | 1.34mi |
| 1427 S 86th St West Allis, WI | 3.0 | 1.0 | 998 | $1,399 | $1.40 | 14d | 1 | 1.36mi |
| 8530 W National Ave West Allis, WI | 1.0–3.0 | 1.0–2.0 | 1037 | $3,050 | $2.94 | 0d | 6 | 1.37mi |
| 323A N 59th St Milwaukee, WI | 2.0 | 1.0 | 900 | $1,595 | $1.77 | 23d | 1 | 1.47mi |
Listing history 4 events
-
2026-06-02statusdays on market $174,900 Pending 5 DOM
-
2026-06-01days on market $174,900 Active 4 DOM
-
2026-05-31days on market $174,900 Active 3 DOM
-
2026-05-16historical $174,900
ⓘ Source: listings_history table (triggers on properties + properties_extension) + one-shot
backfill from property_details.listing_events for pre-trigger history.
Tax reassessment forecast WI · Partial reset (capped growth)
- Current annual tax
- $3,323 · $277/mo
- Projected year-2 tax
- $3,323 · $277/mo
- Expected delta
- $0/yr ($0/mo · -0.0%)
ⓘ Screening estimate from a state-policy table — verify with the county assessor before closing.
Climate risk First Street
- Flood 1/10 Low FEMA zone X (unshaded) · 0% chance over 30 yrs
- Wildfire 1/10 Low
- Heat 2/10 Low 7 d/yr ≥99°F today · 13 d/yr by 30 yrs out
- Wind 2/10 Low
- Air quality 2/10 Low 1 unhealthy d/yr today · 1 by 30 yrs out
Nearby sold comps map
Loading sold comps map…
Walkable amenities ~0.75 mi
Loading nearby amenities…
Taxation est. · year 1
- Rental income
- $20,212
- − Mortgage interest
- −$9,797
- − Property taxes
- −$3,323
- − Insurance
- −$874
- − Repairs & maintenance
- −$1,617
- − Management
- −$1,617
- − Depreciation
- −$5,088
- Taxable loss
- −$2,104
- Est. tax savings @ 24.0%
- +$505
- After-tax cash flow
- $1,269/yr
For passive investors: Depreciation is non-cash, so a rental often shows a tax loss while cash-flowing — sheltering income. Rental losses are passive: they offset passive income freely, and up to $25,000/yr can offset ordinary (W-2) income if you actively participate and your MAGI is under $100k (phasing out to $0 by $150k); unused losses carry forward. On sale, claimed depreciation is recaptured at up to 25%, and gains may owe capital-gains tax (a 1031 exchange can defer both). Figures are a year-1 estimate at your 24.0% rate — not tax advice; consult a CPA.
Schools (NCES district)
- District
- West Allis-West Milwaukee School District
- NCES district ID
- 5516260
- Math proficiency
- 17% ▼ -16.00%
- Reading proficiency
- 26% ▼ -12.00%
- Median HH income
- $45,620
- Composite
- 18.71/100
- National rank
- #8881
- State rank
- #328 of 342 in WI
Livability — West Allis
- Score
- 79/100
- State rank
- #69
- US rank
- #1958
Category grades
Schools grade is shown separately in the Schools card above.
Census & demographics
- Census place
- West Allis, WI
- County
- Milwaukee County · 926,379 people
- City population
- 57,365
- Metro
- Milwaukee-Waukesha, WI
- Population (ZIP)
- 34,480
- Household income
- $60,962
- Rent vs Own
- Severe rent burden
- 1377.0
Population outlook (Milwaukee County) Hauer SSP2
- Today (2025)
- 995,758 people
- By 2030
- 1,009,124 · +1.3%
- By 2040
- 1,028,128 · +3.3%
- By 2050
- 1,040,066 · +4.4%
- By 2075
- 1,057,849 · +6.2%
- By 2100
- 1,039,774 · +4.4%
Race, ethnicity, and origin ACS 2023
- Neighborhood character
- Predominantly White (66%)
- Race & ethnicity
- White 66% Hispanic / Latino 18% Two or more races 12% Black 7% Asian 3%
- Hispanic origin (detail)
- Mexican 12% Puerto Rican 4%
- Common ancestry
- Romanian 11% Lithuanian 3% Portuguese 2%
- Foreign-born
- 7% · Canada, China, Philippines
- Languages at home
- 86% English-only · Spanish 10% Other Asian/Pacific 1% Russian/Polish/Slavic 1%
Political lean MEDSL · Milwaukee
- 2024 margin
- Solid D (+38.5) · D 68.3% · R 29.8% · Other 1.8%
- 2008→2024 swing
- +2.7pp toward D · 2008: 35.9pp · 2024: 38.5pp
- All cycles
- 2024: D+38.5 2020: D+39.9 2016: D+37.5 2012: D+34.6 2008: D+35.9
Not yet ingested
- Civics
- —
Market trends
- HPI YoY
- ▼ -112.31%
- Current HPI
- 276.0476
- Rent YoY
- ▲ 8.30%
- Metro
- Milwaukee-Waukesha, WI
- State GDP YoY
- ▲ 2.10%
- F500 in state
- 20
Industry mix (Fortune 500 HQ in WI)
| Industry | F500 HQs | Revenue |
|---|---|---|
| Industrial Machinery | 4 | $23B |
|
||
| Industrial Technology | 2 | $36B |
|
||
| Insurance | 1 | $36B |
|
||
| Professional Services | 1 | $19B |
|
||
| Utilities | 1 | $9B |
|
||
| Consumer Goods | 1 | $3B |
|
||
Price history
1 event — show timeline
- 2026-05-16 Coming Soon $174,900 METROMLS
Property tax history
+1.5%/yrLatest (2024): $3,323 · +21.7% YoY. Source: county tax records.
Cash-flow waterfall
monthlySold comps — $/sqft
last 12 mo · ≤1 miLoading sold comps…