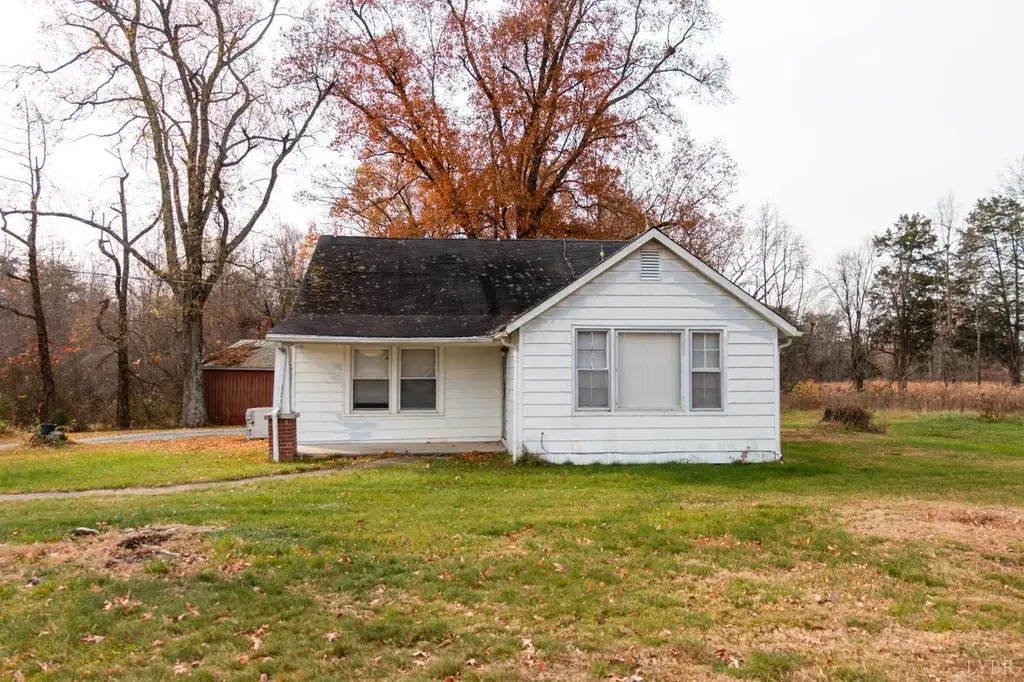
1089 Straightstone Rd · Nathalie, VA
Flood risk 1/10 · Minimal
- FEMA flood zone
- X (unshaded)
- Chance of flooding over 30 yrs
- 0.0%
- Est. flood insurance / yr
- $507 – $1,088
Fire risk 4/10 · Minor
- Est. fire insurance / yr
- $666 – $1,236
Heat risk 5/10 · Moderate
- Hot days now (above 103°F)
- 7 days/yr
- Hot days in 30 yrs
- 17 days/yr
Wind risk 3/10 · Minor
- Chance of severe wind over 30 yrs
- 6.0%
Air-quality risk 2/10 · Minimal
- Unhealthy air days now
- 1 days/yr
- Unhealthy air days in 30 yrs
- 1 days/yr
Risk factors via First Street. Map © Google.
Why this score? — see what drove the C+ grade
The composite is a weighted blend of 9 inputs, each scored 0–100. Each bar is that input's sub-score; the figure is the points it added to the 100-point composite (weight × sub-score).
- Cash flow +25.2/30.0
- DSCR +8.3/10.0
- ARV discount +7.5/15.0
- 1% rule +5.4/10.0
- Appreciation +5.3/10.0
- Schools +3.6/10.0
- Rent growth +2.5/5.0
- Livability +2.5/5.0
- Condition / age +2.5/5.0
$99,900
🖨 Deal sheet (PDF) 📄 Offer letter ✓ Due diligence
Listing remarks
Your chance to own this adorable home at an affordable price! This home sits on a spacious lot with a huge garage in the back that fits 6 cars! You don't want to miss this rural retreat. Property will be going to Auction March 25th at 1:00pm. Buy now or at the auction!
Key facts
- 2.83 acre lot
- Built 1950
- Listed 4 days
Neighborhood map
What this means for you Summary
Snapshot
- This is a 2-bed/2.0-bath single-family listed at $100k.
Deal economics
- At list price, monthly cash flow is $223 ($3k/yr) — positive.
- The deal already cash-flows at list — no discount required.
- Meets the 1% rule at list price ($1k rent vs $100k).
Location & tenants
- Location reads 49/100 on livability (#551 in VA) — a working-class tenant base; expect higher turnover. Strengths: crime A, cost of living A; Watch: health & safety C-, amenities F, commute F.
- Halifax County Public School District (town): math 29% / reading 59% proficiency, ranked #116 of 131 in VA (top 88%) — families likely to look elsewhere, expect single-tenant / working-renter base with shorter leases.
- Zoned schools: Sydnor Jennings Elementary (math 27% / reading 52%, grade F, #900 of 1,108 statewide, top 83%, 192 students, 92% FRL); Halifax County Middle (math 27% / reading 60%, grade D, #285 of 342 statewide, top 84%, 925 students, 92% FRL); Halifax County High (math 40% / reading 69%, grade C-, #281 of 319 statewide, top 90%, 1,397 students, 90% FRL) — zoned schools average 91% FRL vs 58% district-wide (33 pts higher); higher-poverty schools than district average — tighter screening recommended.
- Market conditions: 6 active listings in the ZIP; 97 units permitted in Halifax County in 2024 (0 in 5+ unit buildings).
Forward outlook
- In year one you build about $1k of equity ($691 loan paydown + $648 appreciation (0.7% local appreciation)).
- Halifax County population projected at -22% by 2050 — secular population decline; favor cash flow + early exit over multi-decade hold.
- At projected returns (0.7% appreciation + 3.0% rent growth), your $28k cash investment doubles in ~6 years — after that, you're playing with house money.
Negotiation context
- Only 4 days on market — expect competitive offers; lowballing is unlikely to land.
- Current owner paid $25k; list at $100k implies a 300% gain — meaningful room to come down on a strong offer.
Risks & watch-outs
- Watch-outs: built in 1950 — expect roof / HVAC / electrical / plumbing capex.
- Climate carrying-cost: extreme-heat days projected 7→17/yr by 2055 (HVAC capex compounding) — expect insurance premiums to compound above CPI over the hold.
Questions for the listing agent
- Built in 1950 — when were the roof, HVAC, electrical panel, plumbing, and water heater last replaced?
- Is there a deadline driving the sale (1031 exchange, divorce, estate, relocation)? That informs how much negotiation room exists.
- Schools are A-rated — typically a magnet for longer-tenancy family renters. What's the average tenant stay here, and is there a school-zone premium baked into asking?
- What's the average days-on-market for RENTAL listings here right now (not sales)? A rising rental-DOM trend means longer vacancies and softer asking-rent achievability than the comps imply.
- What's the recent tenant-quality profile in this submarket — average credit score on applications, eviction rate, late-payment / NSF rate, and stable-employment percentage? A property-management company in the area should have these aggregated.
- How much new for-sale + rental construction is in the pipeline within 1–3 miles? Heavy new supply typically softens prices + rents 12–24 months out; constrained supply supports both.
Investment metrics
- 1% rule
- 1.04% ✓
- Cap rate
- 8.97%
- Cash-on-cash
- 9.57%
- DSCR
- 1.43
- GRM
- 8.0
CMA / ARV
No comps found within radius.
Projected returns pro-forma
0.65% appreciation · 3.0% rent growth · sell at horizon
- IRR
- 10.3%
- Equity multiple
- 1.51×
- Total profit
- $14,337
- Equity at exit
- $32,293
- IRR
- 14.5%
- Equity multiple
- 2.69×
- Total profit
- $47,307
- Equity at exit
- $41,546
Cash invested: $27,972 (down + closing). Projections, not guarantees.
Landlord ↔ Tenant lean methodology
- Overall (STATE)
- 55 Moderately Landlord-Leaning
- State Virginia
- 55 Moderately Landlord-Leaning · D+2
- County
- — inherits STATE
- City
- — inherits STATE
ZIP-level market 24569
- Home prices YoY
- 0.5%
- Active inventory
- 6
- Price-to-rent
- 8.0×
Monthly cashflow live
- Estimated rent
- $1,036 medium interval (Pro) →
- Mortgage (P&I)
- −$524
- Tax from tax record
- −$30 /mo · $356/yr
- Insurance
- −$42
- HOA
- −$0
- Vacancy / Maint / Mgmt
- −$218
- Net cashflow
- $223
Break-even live
Sensitivity live
| Price | -10% $280 | -5% $251 | +0% $223 | +5% $195 | +10% $167 |
|---|---|---|---|---|---|
| Rent | -10% $141 | -5% $182 | +0% $223 | +5% $264 | +10% $305 |
| Rate | -1.0pp $273 | -0.5pp $249 | base $223 | +0.5pp $197 | +1.0pp $171 |
UW: 25.0% down · 7.5% · 30yr · 1.5% tax · 5.0% vac · 8.0% maint · 8.0% mgmt
Financing live
Cash to close
- Down payment
- $24,975
- Closing costs
- $2,997
- Reserves months
- —
- Total cash needed
- —
Loan-product check · same deal, 3 products live
Conventional
25% down · 7.5% · 30yr
- Down + closing
- —
- Monthly P&I
- —
- Monthly cashflow
- —
- DSCR
- —
- Eligible?
- —
Personal DTI + credit; lowest rate.
DSCR
20% down · 8.5% · 30yr
- Down + closing
- —
- Monthly P&I
- —
- Monthly cashflow
- —
- DSCR
- —
- Eligible?
- —
No personal income docs; deal must DSCR.
Hard money
10% down · 12.0% · 12mo
- Down + closing
- —
- Monthly P&I
- —
- Monthly cashflow
- —
- DSCR
- —
- Eligible?
- —
Short-term bridge; refi at stabilization.
Listing history 9 events
-
2026-06-21days on market $99,900 Active 4 DOM
-
2026-06-18days on market $99,900 Active 2 DOM
-
2026-06-17pricestatusdays on market $99,900 Active 1 DOM
-
2026-03-30status Pending
-
2026-03-20price $109,900
-
2026-01-15price $129,900
-
2025-12-11price $149,900
-
2025-11-21$169,900 Active
-
1999-09-01soldstatus $25,000
ⓘ Source: listings_history table (triggers on properties + properties_extension) + one-shot
backfill from property_details.listing_events for pre-trigger history.
Tax reassessment forecast VA · Resets to sale price
- Current annual tax
- $356 · $30/mo
- Projected year-2 tax
- $819 · $68/mo
- Expected delta
- +$463/yr (+$39/mo · 130.2%)
ⓘ Screening estimate from a state-policy table — verify with the county assessor before closing.
Climate risk First Street
- Flood 1/10 Low FEMA zone X (unshaded) · 0% chance over 30 yrs
- Wildfire 4/10 Moderate
- Heat 5/10 Major 7 d/yr ≥103°F today · 17 d/yr by 30 yrs out
- Wind 3/10 Moderate 6% chance of damaging wind over 30 yrs
- Air quality 2/10 Low 1 unhealthy d/yr today · 1 by 30 yrs out
Nearby sold comps map
Loading sold comps map…
Walkable amenities ~0.75 mi
Loading nearby amenities…
Taxation est. · year 1
- Rental income
- $12,431
- − Mortgage interest
- −$5,596
- − Property taxes
- −$356
- − Insurance
- −$500
- − Repairs & maintenance
- −$994
- − Management
- −$994
- − Depreciation
- −$2,906
- Taxable income
- $1,084
- Est. tax owed @ 24.0%
- −$260
- After-tax cash flow
- $2,418/yr
For passive investors: Depreciation is non-cash, so a rental often shows a tax loss while cash-flowing — sheltering income. Rental losses are passive: they offset passive income freely, and up to $25,000/yr can offset ordinary (W-2) income if you actively participate and your MAGI is under $100k (phasing out to $0 by $150k); unused losses carry forward. On sale, claimed depreciation is recaptured at up to 25%, and gains may owe capital-gains tax (a 1031 exchange can defer both). Figures are a year-1 estimate at your 24.0% rate — not tax advice; consult a CPA.
Schools (NCES district)
- District
- Halifax County Public School District
- NCES district ID
- 5101770
- Math proficiency
- 29% ▼ -51.00%
- Reading proficiency
- 59% ▼ -15.00%
- Median HH income
- $36,137
- Composite
- 36.36/100
- National rank
- #4687
- State rank
- #116 of 131 in VA
Livability — Nathalie
- Score
- 49/100
- State rank
- #551
- US rank
- #25884
Category grades
Schools grade is shown separately in the Schools card above.
Census & demographics
- Population (ZIP)
- 1,025
Population outlook (Halifax County) Hauer SSP2
- Today (2025)
- 32,892 people
- By 2030
- 31,438 · -4.4%
- By 2040
- 28,350 · -13.8%
- By 2050
- 25,553 · -22.3%
- By 2075
- 20,217 · -38.5%
- By 2100
- 14,645 · -55.5%
Race, ethnicity, and origin ACS 2023
- Neighborhood character
- Majority Black (59%)
- Race & ethnicity
- Black 59% White 36% Hispanic / Latino 4%
- Common ancestry
- Subsaharan African 1%
- Languages at home
- 99% English-only · French/Haitian/Cajun 1%
Political lean MEDSL · Halifax
- 2024 margin
- Strong R (+21.1) · D 39.1% · R 60.2%
- 2008→2024 swing
- -18.2pp toward R · 2008: -2.8pp · 2024: -21.1pp
- All cycles
- 2024: R+21.1 2020: R+15.1 2016: R+16.6 2012: R+5.6 2008: R+2.8
Not yet ingested
- Civics
- —
Market trends
- HPI YoY
- ▲ 0.65%
- Current HPI
- 139.388
- Rent YoY
- —
- Metro
- —
- State GDP YoY
- ▲ 2.40%
- F500 in state
- 50
Industry mix (Fortune 500 HQ in VA)
| Industry | F500 HQs | Revenue |
|---|---|---|
| Aerospace / Defense | 4 | $236B |
|
||
| Technology / Defense | 3 | $32B |
|
||
| Financial Services | 2 | $176B |
|
||
| Utilities | 2 | $27B |
|
||
| Insurance | 2 | $25B |
|
||
| Technology | 2 | $15B |
|
||
Price history
+339.6% since first listed6 events — show timeline
- 2026-03-30 Pending — LMLS
- 2026-03-20 Price Changed $109,900 LMLS
- 2026-01-15 Price Changed $129,900 LMLS
- 2025-12-11 Price Changed $149,900 LMLS
- 2025-11-21 Listed $169,900 LMLS
- 1999-09-01 Sold (Public Records) $25,000 Public Records
Property tax history
+2.2%/yrLatest (2025): $356 · +0.0% YoY. Source: county tax records.
Cash-flow waterfall
monthlySold comps — $/sqft
last 12 mo · ≤1 miLoading sold comps…