 Duplex
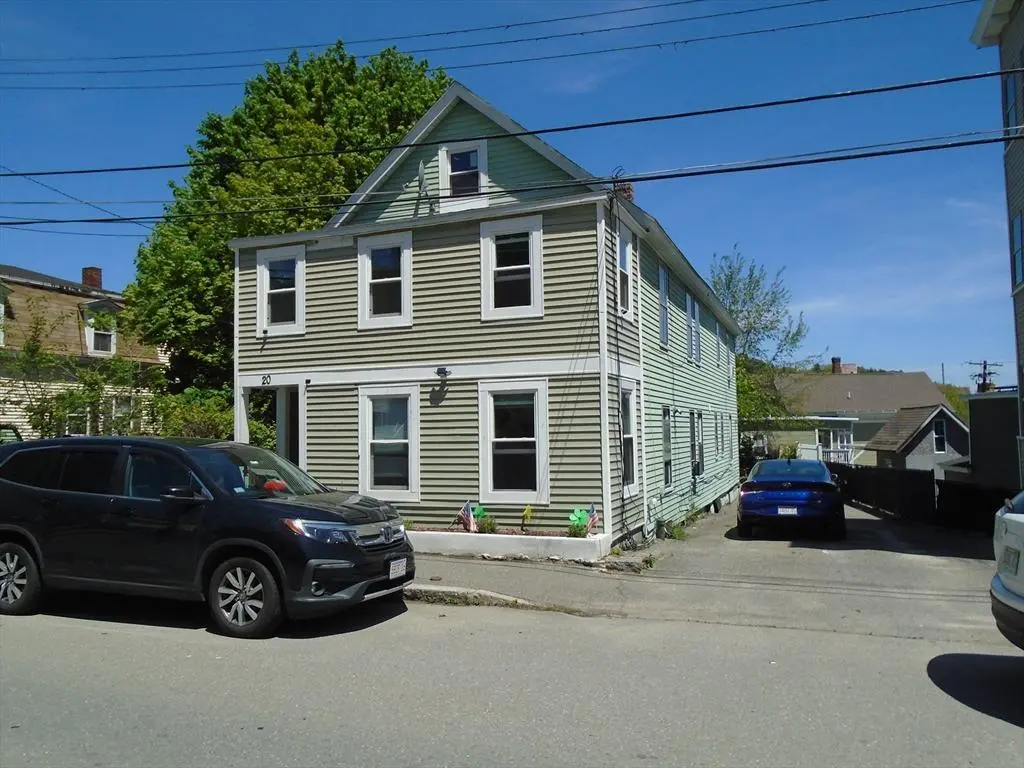
20 Cross St · Fitchburg, MA
Flood risk 1/10 · Minimal
- FEMA flood zone
- —
- Chance of flooding over 30 yrs
- 0.0%
- Est. flood insurance / yr
- —
Fire risk 4/10 · Minor
- Est. fire insurance / yr
- $915 – $1,699
Heat risk 4/10 · Minor
- Hot days now (above 95°F)
- 7 days/yr
- Hot days in 30 yrs
- 17 days/yr
Wind risk 6/10 · Moderate
- Chance of severe wind over 30 yrs
- 27.0%
Air-quality risk 2/10 · Minimal
- Unhealthy air days now
- 1 days/yr
- Unhealthy air days in 30 yrs
- 1 days/yr
Risk factors via First Street. Map © Google.
Why this score? — see what drove the D+ grade
The composite is a weighted blend of 9 inputs, each scored 0–100. Each bar is that input's sub-score; the figure is the points it added to the 100-point composite (weight × sub-score).
- Cash flow +16.4/30.0
- ARV discount +10.9/15.0
- DSCR +5.1/10.0
- 1% rule +3.8/10.0
- Livability +3.5/5.0
- Rent growth +3.3/5.0
- Condition / age +2.5/5.0
- Schools +2.0/10.0
- Appreciation +0.0/10.0
$419,000
🖨 Deal sheet (PDF) 📄 Offer letter ✓ Due diligence
Multi-family units
County records classify this as Multi-Family (2-4 Unit). Listing-text estimate: 2 units. confirmed
Listing remarks MLS
If you have been looking for a multi-family close to shopping, public transportation, schools, recreation and much more, look no further! This tastefully updated 2 family home is located on a one way street and could be just what you have been searching for. The tenants pay their own utilities. This gem offers an excellent opportunity to investors or an owner occupant to help pay the mortgage. Home will not qualify for FHA financing and is being sold as is. Showings on Saturdays ONLY. Please text listing agent to schedule.
Key facts
- Two family house
- 4,278 sq ft lot
- Garage
Tags
Property features AI
Finance
- HOA & community: Nearby public transportation, shopping, parks, medical facility and university
Exterior
- Parking: 1-car garage; 1 covered parking space; 4 open parking spaces (5 total); Paved driveway and off-street parking
- Utilities: Public water; Public sewer; Gas available for range
- Home design: Multi-family property; 2 stories; 2,108 total building area
- Construction: Frame construction; Stone foundation; Built year per public records
- Exterior features: Shingle roof; Public road frontage; Lot approximately 0.1 acre
Interior
- Flooring: Wood flooring; Vinyl flooring
- Bathrooms: 2 full bathrooms
- Interior features: 12 total rooms; Partial basement
Neighborhood map
What this means for you Summary
Snapshot
- This is a 2 × 2-bed/1.0-bath units multifamily listed at $419k.
Deal economics
- At list price, monthly cash flow is $236 ($3k/yr) — positive. Per door: $118/mo.
- The deal already cash-flows at list — no discount required.
- To meet the 1% rule (rent ≥ 1% of price), the offer needs to be $367k (12.3% below list).
- Recommended offer: $367k (12.3% below list) — sets the bar for 1% rule.
- Cap rate 7.0% vs local median 4.1% in Fitchburg — top-decile yield for the area; either an underpriced asset or a hidden risk that comps aren't pricing in. Stress-test before assuming the spread holds.
Location & tenants
- Location reads 69/100 on livability (#137 in MA) — a middle-class / working-renter tenant base. Strengths: housing A+, commute A-, health & safety B+; Watch: employment D+, crime D, amenities F.
- Fitchburg (suburban): math 15% / reading 30% proficiency, ranked #282 of 302 in MA (top 93%) — low school quality limits family demand, transient renter base, plan for 1-2y turnover; 64% free/reduced lunch — lower-income household profile, screen leases tightly.
- Zoned schools: Mckay Elementary School (math 13% / reading 24%, grade F, #805 of 938 statewide, top 86%, 727 students, 0% FRL); Arthur M Longsjo Middle School (math 11% / reading 22%, grade F, #271 of 305 statewide, top 89%, 588 students, 0% FRL); Fitchburg High (math 25% / reading 42%, grade F, #251 of 343 statewide, top 73%, 1,246 students, 0% FRL) — zoned schools average 0% FRL vs 64% district-wide (64 pts lower); this property's tenant base skews higher-income than the district average.
- Market conditions: Rents rising (+3.1%/yr); 89 active listings in the ZIP; 4 comparable units currently listed for rent nearby; rentals at typical pace (median 16d on market — plan ~3-4 weeks tenant-placement turnaround); 2,293 units permitted in Worcester County in 2024 (1,205 in 5+ unit buildings).
- At $3,674/mo this rent would consume 61% of the median local household income ($73k/yr) (locally 1763% of renters already pay >50% of income on rent) — very limited rent-growth headroom before tenants either downsize or default.
Forward outlook
- Local home prices are declining (-3.0%/yr); year-one equity from $3k of loan paydown is wiped out by about $13k of value loss. Plan a longer hold.
Negotiation context
- It's been on market 18 days — a 2% lower offer ($413k) is reasonable based on typical stale-listing flexibility.
- 4 sale attempts since 7y ago with the ask held roughly flat each time — persistent listings suggest the price (not the market) is what's stuck; bring a comps-based counter.
- Current owner paid $205k; list at $419k implies a 104% gain — meaningful room to come down on a strong offer.
Risks & watch-outs
- Watch-outs: built in 1920 — expect roof / HVAC / electrical / plumbing capex.
- Climate carrying-cost: major wind risk, 27% chance of damaging wind over 30y — expect insurance premiums to compound above CPI over the hold.
Questions for the listing agent
- Can we see the unit-by-unit rent roll, current vacancy, and any below-market leases? What's the average tenancy length?
- What capital expenditures (roof, boiler, parking lot, exteriors) have been made in the last 5 years, and what's planned in the next 2?
- Built in 1920 — when were the roof, HVAC, electrical panel, plumbing, and water heater last replaced?
- Is there a deadline driving the sale (1031 exchange, divorce, estate, relocation)? That informs how much negotiation room exists.
- Schools are D-rated, which usually means shorter tenancies and higher turnover. Who's the typical renter profile here, and what's been the actual vacancy rate?
- Crime grade is D in this area — have there been break-ins, vandalism, or insurance claims at this property in the last 3 years? What carrier currently insures it and at what premium?
- The area grade is low — what's the realistic commute time and amenity access for the typical tenant pool here? Any planned neighborhood developments (good or bad) we should know about?
- What's the average days-on-market for RENTAL listings here right now (not sales)? A rising rental-DOM trend means longer vacancies and softer asking-rent achievability than the comps imply.
- What's the recent tenant-quality profile in this submarket — average credit score on applications, eviction rate, late-payment / NSF rate, and stable-employment percentage? A property-management company in the area should have these aggregated.
- How much new apartment / multifamily construction is in the pipeline within 1–3 miles? Heavy new supply (>2% of stock underway) typically softens rents 12–24 months out; light construction supports rent growth.
Investment metrics
- 1% rule
- 0.88% ✗
- Cap rate
- 6.97%
- Cash-on-cash
- 2.41%
- DSCR
- 1.11
- GRM
- 9.5
CMA / ARV
- ARV (on-the-fly)
- $453,220
- Comps found
- 12
Show comp detail 12 sales within ~0.75 mi
| Address | Dist | Beds/Ba | Sqft | Sold | Price | $/sf | Match |
|---|---|---|---|---|---|---|---|
| 12 Milk St | 0.05mi | 5/2.0 (+1) | 2,292 (+9%) | 16mo | $465,000 | $203 | 65 |
| 82 Charles St | 0.20mi | 5/2.0 (+1) | 2,383 (+13%) | 0mo | $310,000 | $130 | 64 |
| 29 Middle St | 0.41mi | 5/2.0 (+1) | 2,118 (+0%) | 14mo | $500,000 | $236 | 63 |
| 77 Hazel St | 0.43mi | 4/2.0 | 1,976 (-6%) | 12mo | $405,000 | $205 | 59 |
| 15-17 Belmont St | 0.65mi | 4/2.0 | 2,176 (+3%) | 13mo | $467,000 | $215 | 54 |
| 26 Lawrence St | 0.69mi | 4/2.0 | 1,980 (-6%) | 6mo | $365,000 | $184 | 53 |
| 268 Blossom St | 0.67mi | 4/2.0 | 1,990 (-6%) | 9mo | $470,000 | $236 | 52 |
| 318 Charles St | 0.46mi | 5/3.0 (+1) | 2,348 (+11%) | 2mo | $594,000 | $253 | 49 |
| 40 Orange St | 0.65mi | 5/2.0 (+1) | 2,312 (+10%) | 1mo | $415,000 | $179 | 48 |
| 327 Rollstone St | 0.43mi | 5/3.0 (+1) | 2,304 (+9%) | 15mo | $510,000 | $221 | 43 |
| 15 Congress St | 0.50mi | 5/2.0 (+1) | 1,800 (-15%) | 18mo | $610,000 | $339 | 32 |
| 162 Myrtle Ave | 0.70mi | 4/4.0 | 1,823 (-14%) | 14mo | $342,800 | $188 | 25 |
Match score weights: distance 35% · size 25% · config 20% · recency 20%. Top-matched comps best support the ARV.
Projected returns pro-forma
-3.0% appreciation · 3.06% rent growth · sell at horizon
- IRR
- -12.4%
- Equity multiple
- 0.55×
- Total profit
- $-52,754
- Equity at exit
- $62,474
- IRR
- -3.3%
- Equity multiple
- 0.78×
- Total profit
- $-26,050
- Equity at exit
- $36,227
Cash invested: $117,320 (down + closing). Projections, not guarantees.
Landlord ↔ Tenant lean methodology
- Overall (STATE)
- 20 Strongly Tenant-Friendly
- State Massachusetts
- 20 Strongly Tenant-Friendly · D+15
- County
- — inherits STATE
- City
- — inherits STATE
ZIP-level market 01420
- Home prices YoY
- -25.2%
- Rents YoY
- 3.1%
- Active inventory
- 89
- Price-to-rent
- 19.0×
Monthly cashflow live
- Estimated rent
- $3,674 high interval (Pro) →
- Mortgage (P&I)
- −$2,197
- Tax from tax record
- −$295 /mo · $3,540/yr
- Insurance
- −$175
- HOA
- −$0
- Vacancy / Maint / Mgmt
- −$772
- Net cashflow
- $236
Break-even live
Sensitivity live
| Price | -10% $473 | -5% $354 | +0% $236 | +5% $117 | +10% $-2 |
|---|---|---|---|---|---|
| Rent | -10% $-55 | -5% $90 | +0% $236 | +5% $381 | +10% $526 |
| Rate | -1.0pp $447 | -0.5pp $342 | base $236 | +0.5pp $127 | +1.0pp $17 |
2-unit breakdown (identical units grouped — click to expand)
| Units | Beds | Baths | Est. rent |
|---|---|---|---|
| 2× units | 2 | 1 | $3,674 |
| #1 | 2 | 1 | $1,837 |
| #2 | 2 | 1 | $1,837 |
| Total (2 units) | $3,674 | ||
UW: 25.0% down · 7.5% · 30yr · 1.5% tax · 5.0% vac · 8.0% maint · 8.0% mgmt
Financing live
Cash to close
- Down payment
- $104,750
- Closing costs
- $12,570
- Reserves months
- —
- Total cash needed
- —
Loan-product check · same deal, 3 products live
Conventional
25% down · 7.5% · 30yr
- Down + closing
- —
- Monthly P&I
- —
- Monthly cashflow
- —
- DSCR
- —
- Eligible?
- —
Personal DTI + credit; lowest rate.
DSCR
20% down · 8.5% · 30yr
- Down + closing
- —
- Monthly P&I
- —
- Monthly cashflow
- —
- DSCR
- —
- Eligible?
- —
No personal income docs; deal must DSCR.
Hard money
10% down · 12.0% · 12mo
- Down + closing
- —
- Monthly P&I
- —
- Monthly cashflow
- —
- DSCR
- —
- Eligible?
- —
Short-term bridge; refi at stabilization.
Rent comps 4 comps
| Address | Beds | Baths | Sqft | Rent | $/sqft | DOM | Units | Dist |
|---|---|---|---|---|---|---|---|---|
| 60 Congress St Unit 2 Fitchburg, MA | 5.0 | 2.0 | 1670 | $3,250 | $1.95 | 16d | 1 | 0.63mi |
| 21 Pacific St Unit 2 Fitchburg, MA | 3.0 | 1.0 | 1518 | $2,100 | $1.38 | 16d | 1 | 0.71mi |
| 62 Lincoln St Unit 2 Fitchburg, MA | 5.0 | 2.0 | 1776 | $3,600 | $2.03 | 15d | 1 | 0.79mi |
| 75 Beech St Unit 1 Fitchburg, MA | 4.0 | 3.0 | 1800 | $3,000 | $1.67 | 16d | 1 | 0.86mi |
Listing history 11 events
-
2026-06-21days on market $419,000 Active 18 DOM
-
2026-06-18days on market $419,000 Active 15 DOM
-
2026-06-17days on market $419,000 Active 14 DOM
-
2026-06-16days on market $419,000 Active 13 DOM
-
2026-06-15days on market $419,000 Active 12 DOM
-
2026-06-14days on market $419,000 Active 10 DOM
-
2026-06-10days on market $419,000 Active 7 DOM
-
2026-06-09days on market $419,000 Active 6 DOM
-
2026-06-08days on market $419,000 Active 5 DOM
-
2026-06-07remarks 201-char remark
-
2026-06-07$419,000 Active 4 DOM
ⓘ Source: listings_history table (triggers on properties + properties_extension) + one-shot
backfill from property_details.listing_events for pre-trigger history.
Tax reassessment forecast MA · Partial reset (capped growth)
- Current annual tax
- $3,540 · $295/mo
- Projected year-2 tax
- $4,347 · $362/mo
- Expected delta
- +$807/yr (+$67/mo · 22.8%)
ⓘ Screening estimate from a state-policy table — verify with the county assessor before closing.
Climate risk First Street
- Flood 1/10 Low 0% chance over 30 yrs
- Wildfire 4/10 Moderate
- Heat 4/10 Moderate 7 d/yr ≥95°F today · 17 d/yr by 30 yrs out
- Wind 6/10 Major 27% chance of damaging wind over 30 yrs
- Air quality 2/10 Low 1 unhealthy d/yr today · 1 by 30 yrs out
Nearby sold comps map
Loading sold comps map…
Walkable amenities ~0.75 mi
Loading nearby amenities…
Taxation est. · year 1
- Rental income
- $44,088
- − Mortgage interest
- −$23,471
- − Property taxes
- −$3,540
- − Insurance
- −$2,095
- − Repairs & maintenance
- −$3,527
- − Management
- −$3,527
- − Depreciation
- −$12,189
- Taxable loss
- −$4,261
- Est. tax savings @ 24.0%
- +$1,023
- After-tax cash flow
- $3,850/yr
For passive investors: Depreciation is non-cash, so a rental often shows a tax loss while cash-flowing — sheltering income. Rental losses are passive: they offset passive income freely, and up to $25,000/yr can offset ordinary (W-2) income if you actively participate and your MAGI is under $100k (phasing out to $0 by $150k); unused losses carry forward. On sale, claimed depreciation is recaptured at up to 25%, and gains may owe capital-gains tax (a 1031 exchange can defer both). Figures are a year-1 estimate at your 24.0% rate — not tax advice; consult a CPA.
Schools (NCES district)
- District
- Fitchburg
- NCES district ID
- 2504890
- Math proficiency
- 15% ▼ -14.00%
- Reading proficiency
- 30% ▼ -7.00%
- Median HH income
- $48,430
- Composite
- 19.78/100
- National rank
- #8705
- State rank
- #282 of 302 in MA
Livability — Fitchburg
- Score
- 69/100
- State rank
- #137
- US rank
- #8435
Category grades
Schools grade is shown separately in the Schools card above.
Census & demographics
- Census place
- Fitchburg, MA
- County
- Worcester County · 487,911 people
- City population
- 41,839
- Metro
- Worcester, MA-CT
- Population (ZIP)
- 41,839
- Household income
- $72,780
- Rent vs Own
- Severe rent burden
- 1763.0
Population outlook (Worcester County) Hauer SSP2
- Today (2025)
- 850,858 people
- By 2030
- 860,403 · +1.1%
- By 2040
- 869,902 · +2.2%
- By 2050
- 869,110 · +2.1%
- By 2075
- 870,120 · +2.3%
- By 2100
- 829,703 · -2.5%
Race, ethnicity, and origin ACS 2023
- Neighborhood character
- Diverse neighborhood (Simpson 0.58)
- Race & ethnicity
- White 57% Hispanic / Latino 30% Two or more races 19% Black 6% Asian 2%
- Hispanic origin (detail)
- Mexican 2% Puerto Rican 20% Dominican 2%
- Common ancestry
- Lithuanian 8% Romanian 3% Slovak 1%
- Foreign-born
- 10% · Canada, Jamaica
- Languages at home
- 71% English-only · Spanish 22% French/Haitian/Cajun 3% Other Indo-European 2%
Political lean MEDSL · Worcester
- 2024 margin
- D (+10.0) · D 53.9% · R 43.9% · Other 2.2%
- 2008→2024 swing
- -3.8pp toward R · 2008: 13.8pp · 2024: 10.0pp
- All cycles
- 2024: D+10.0 2020: D+17.8 2016: D+10.5 2012: D+9.2 2008: D+13.8
Not yet ingested
- Civics
- —
Market trends
- HPI YoY
- ▼ -102.11%
- Current HPI
- 303.1067
- Rent YoY
- ▲ 3.06%
- Metro
- Worcester, MA-CT
- State GDP YoY
- ▲ 2.28%
- F500 in state
- 38
Industry mix (Fortune 500 HQ in MA)
| Industry | F500 HQs | Revenue |
|---|---|---|
| Technology | 3 | $17B |
|
||
| Insurance | 2 | $84B |
|
||
| Retail | 2 | $76B |
|
||
| Life Sciences | 1 | $43B |
|
||
| Energy Technology | 1 | $31B |
|
||
| Aerospace / Defense | 1 | $18B |
|
||
Price history
+201.7% since first listed12 events — show timeline
- 2026-06-03 Listed $419,000 MLS PIN
- 2020-12-22 Sold (MLS) $205,000 MLS PIN
- 2020-12-07 Pending — MLS PIN
- 2020-11-21 Price Changed $227,999 MLS PIN
- 2020-11-09 Price Changed $229,999 MLS PIN
- 2020-10-30 Price Changed $239,000 MLS PIN
- 2020-10-23 Listed $240,000 MLS PIN
- 2019-10-15 Sold (MLS) $128,000 MLS PIN
- 2019-08-22 Pending — MLS PIN
- 2019-06-28 Relisted — MLS PIN
- 2019-06-26 Contingent — MLS PIN
- 2019-06-20 Listed $138,888 MLS PIN
Property tax history
+4.0%/yrLatest (2022): $3,540 · +16.1% YoY. Source: county tax records.
Cash-flow waterfall
monthlySold comps — $/sqft
last 12 mo · ≤1 miLoading sold comps…