 Multi-family
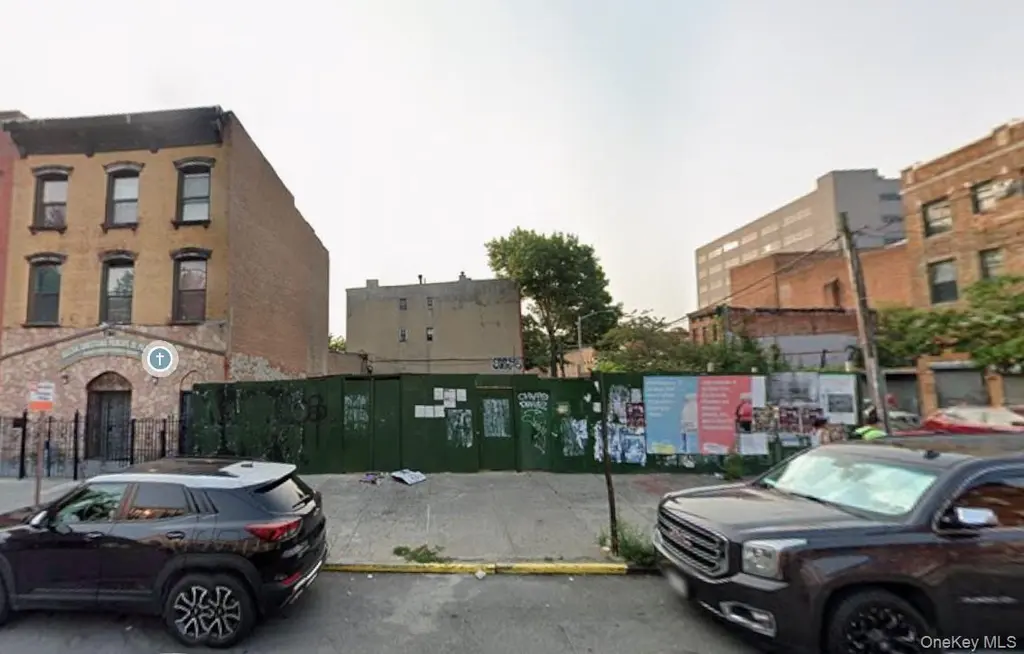
284 Willis Ave · New York, NY
Flood risk No data
- FEMA flood zone
- —
- Chance of flooding over 30 yrs
- —
- Est. flood insurance / yr
- —
Fire risk No data
- Est. fire insurance / yr
- —
Heat risk No data
- Hot days now (above threshold)
- —
- Hot days in 30 yrs
- —
Wind risk No data
- Chance of severe wind over 30 yrs
- —
Air-quality risk No data
- Unhealthy air days now
- —
- Unhealthy air days in 30 yrs
- —
Risk factors via First Street. Map © Google.
Why this score? — see what drove the B+ grade
The composite is a weighted blend of 9 inputs, each scored 0–100. Each bar is that input's sub-score; the figure is the points it added to the 100-point composite (weight × sub-score).
- Cash flow +30.0/30.0
- 1% rule +10.0/10.0
- DSCR +10.0/10.0
- ARV discount +7.5/15.0
- Appreciation +7.3/10.0
- Schools +5.0/10.0
- Livability +3.8/5.0
- Rent growth +2.7/5.0
- Condition / age +2.5/5.0
$1,750,000
🖨 Deal sheet (PDF) 📄 Offer letter ✓ Due diligence
Multi-family units
County records classify this as Multi-Family (5+ Unit). Listing-text estimate: 1 unit. estimate disagrees with records
5+ unit building — per-unit beds/baths from public records are typically unavailable; the breakdown below (if shown) is an estimate from the listing text.
Listing remarks
Exceptional development opportunity just one bridge away from Manhattan! Located in a rapidly growing area with strong upside potential, this R6 / C2-4 zoned mixed-use property offers approximately 12,204 buildable SF and comes with approved architectural plans already in place. Planned configuration includes: • Ground Floor: Retail space • Second Floor: Community Facility / Office • Third to Sixth Floors: Eight residential units total, configured as two 2-bedroom apartments per floor New construction project currently underway with foundation work already in progress, saving developers valuable time and carrying costs. Proposed 6-story elevator building with modern fireproo
Key facts
- Buildable sf
- Mixed-use property
- Community facility
Tags
Property features AI
Finance
- Other: Located in Bronx County
- Financial info: Tax year 2025 — annual tax amount reported
Exterior
- Utilities: Sewer: None
- Home design: Located at 284 Willis Ave, Bronx, NY 10454
- Exterior features: Zoned R6
Interior
- Interior features: No interior amenity details provided
Neighborhood map
What this means for you Summary
Snapshot
- This is a multifamily listed at $1.75M.
Deal economics
- At list price, monthly cash flow is $22k ($262k/yr) — positive.
- The deal already cash-flows at list — no discount required.
- Meets the 1% rule at list price ($41k rent vs $1.75M).
- Recommended offer: $1.70M (3.0% below list) — sets the bar for market timing.
- Cap rate 21.3% vs local median 2.6% in New York — top-decile yield for the area; either an underpriced asset or a hidden risk that comps aren't pricing in. Stress-test before assuming the spread holds.
Location & tenants
- Location reads 75/100 on livability (#268 in NY, #4,188 nationally) — a middle-class / working-renter tenant base. Strengths: amenities A+, commute A+, health & safety A; Watch: crime F, cost of living F.
- Zoned schools: Elm Tree Elementary School (math 27% / reading 52%, grade F, #1,444 of 2,108 statewide, top 71%, 806 students, 94% FRL); Jhs 383 Philippa Schuyler (math 32% / reading 67%, grade C, #280 of 729 statewide, top 40%, 822 students, 85% FRL); Midwood High School (math 94% / reading 96%, grade A+, #83 of 1,100 statewide, top 8%, 4,062 students, 73% FRL).
- Market conditions: Rents flat; 19 active listings in the ZIP; lower-income renter base — watch delinquency; 6,929 units permitted in Bronx County in 2024 (6,829 in 5+ unit buildings).
- At $41,067/mo this rent would consume 2046% of the median local household income ($24k/yr) (locally 5002% of renters already pay >50% of income on rent) — very limited rent-growth headroom before tenants either downsize or default.
Forward outlook
- In year one you build about $94k of equity ($12k loan paydown + $82k appreciation (4.7% local appreciation)).
- Bronx County population projected at +21% by 2050 — long-run rental-demand tailwind backs the buy-and-hold thesis.
- At projected returns (4.7% appreciation + 0.6% rent growth), your $490k cash investment doubles in ~2 years — after that, you're playing with house money.
- By year 2, paydown + projected appreciation supports a ~$150k cash-out refi (75% LTV) — recoverable capital for the next deal without selling this one.
Negotiation context
- It's been on market 39 days — a 3% lower offer ($1.70M) is reasonable based on typical stale-listing flexibility.
- Current owner paid $912k; list at $1.75M implies a 92% gain — meaningful room to come down on a strong offer.
Questions for the listing agent
- It's been on market 39 days. Have you received any prior offers? Is the seller open to a 3% concession, seller financing, or rate buy-down credit?
- Is there a deadline driving the sale (1031 exchange, divorce, estate, relocation)? That informs how much negotiation room exists.
- Schools are B-rated — typically a magnet for longer-tenancy family renters. What's the average tenant stay here, and is there a school-zone premium baked into asking?
- Crime grade is F in this area — have there been break-ins, vandalism, or insurance claims at this property in the last 3 years? What carrier currently insures it and at what premium?
- What's the average days-on-market for RENTAL listings here right now (not sales)? A rising rental-DOM trend means longer vacancies and softer asking-rent achievability than the comps imply.
- What's the recent tenant-quality profile in this submarket — average credit score on applications, eviction rate, late-payment / NSF rate, and stable-employment percentage? A property-management company in the area should have these aggregated.
- How much new apartment / multifamily construction is in the pipeline within 1–3 miles? Heavy new supply (>2% of stock underway) typically softens rents 12–24 months out; light construction supports rent growth.
Investment metrics
- 1% rule
- 2.35% ✓
- Cap rate
- 21.27%
- Cash-on-cash
- 53.49%
- DSCR
- 3.38
- GRM
- 3.6
CMA / ARV
No comps found within radius.
Projected returns pro-forma
4.67% appreciation · 0.61% rent growth · sell at horizon
- IRR
- 58.4%
- Equity multiple
- 4.40×
- Total profit
- $1,664,526
- Equity at exit
- $956,330
- IRR
- 55.5%
- Equity multiple
- 8.50×
- Total profit
- $3,675,513
- Equity at exit
- $1,621,967
Cash invested: $490,000 (down + closing). Projections, not guarantees.
Landlord ↔ Tenant lean methodology
- Overall (CITY)
- 0 Strongly Tenant-Friendly
- State New York
- 15 Strongly Tenant-Friendly · D+10
- County
- — inherits STATE
- City New York
- 0 Strongly Tenant-Friendly · D+34
ZIP-level market 10454
- Home prices YoY
- 2.0%
- Rents YoY
- 0.6%
- Active inventory
- 19
- Price-to-rent
- 28.4×
Monthly cashflow live
- Estimated rent
- $41,067 high interval (Pro) →
- Mortgage (P&I)
- −$9,177
- Tax from tax record
- −$694 /mo · $8,325/yr
- Insurance
- −$729
- HOA
- −$0
- Vacancy / Maint / Mgmt
- −$8,624
- Net cashflow
- $21,843
Break-even live
Sensitivity live
| Price | -10% $22,833 | -5% $22,338 | +0% $21,843 | +5% $21,348 | +10% $20,852 |
|---|---|---|---|---|---|
| Rent | -10% $18,599 | -5% $20,221 | +0% $21,843 | +5% $23,465 | +10% $25,087 |
| Rate | -1.0pp $22,724 | -0.5pp $22,288 | base $21,843 | +0.5pp $21,389 | +1.0pp $20,928 |
8-unit breakdown (identical units grouped — click to expand)
| Units | Beds | Baths | Est. rent |
|---|---|---|---|
| 8× units | 2 | 1 | $41,064 |
| #1 | 2 | 1 | $5,133 |
| #2 | 2 | 1 | $5,133 |
| #3 | 2 | 1 | $5,133 |
| #4 | 2 | 1 | $5,133 |
| #5 | 2 | 1 | $5,133 |
| #6 | 2 | 1 | $5,133 |
| #7 | 2 | 1 | $5,133 |
| #8 | 2 | 1 | $5,133 |
| Total (8 units) | $41,067 | ||
UW: 25.0% down · 7.5% · 30yr · 1.5% tax · 5.0% vac · 8.0% maint · 8.0% mgmt
Financing live
Cash to close
- Down payment
- $437,500
- Closing costs
- $52,500
- Reserves months
- —
- Total cash needed
- —
Loan-product check · same deal, 3 products live
Conventional
25% down · 7.5% · 30yr
- Down + closing
- —
- Monthly P&I
- —
- Monthly cashflow
- —
- DSCR
- —
- Eligible?
- —
Personal DTI + credit; lowest rate.
DSCR
20% down · 8.5% · 30yr
- Down + closing
- —
- Monthly P&I
- —
- Monthly cashflow
- —
- DSCR
- —
- Eligible?
- —
No personal income docs; deal must DSCR.
Hard money
10% down · 12.0% · 12mo
- Down + closing
- —
- Monthly P&I
- —
- Monthly cashflow
- —
- DSCR
- —
- Eligible?
- —
Short-term bridge; refi at stabilization.
Listing history 21 events
-
2026-06-21days on market $1,750,000 Active 39 DOM
-
2026-06-18days on market $1,750,000 Active 36 DOM
-
2026-06-17price $1,750,000 Active 35 DOM
-
2026-06-17days on market $1,900,000 Active 35 DOM
-
2026-06-16days on market $1,900,000 Active 34 DOM
-
2026-06-15days on market $1,900,000 Active 33 DOM
-
2026-06-13days on market $1,900,000 Active 31 DOM
-
2026-06-10days on market $1,900,000 Active 27 DOM
-
2026-06-08days on market $1,900,000 Active 26 DOM
-
2026-06-08days on market $1,900,000 Active 25 DOM
-
2026-06-04days on market $1,900,000 Active 22 DOM
-
2026-06-03days on market $1,900,000 Active 21 DOM
-
2026-06-02days on market $1,900,000 Active 20 DOM
-
2026-06-01days on market $1,900,000 Active 19 DOM
-
2026-05-31days on market $1,900,000 Active 18 DOM
-
2026-05-13$1,900,000 Active
-
2022-02-02soldstatus $912,000
-
2003-12-04soldstatus $150,000
-
2001-06-28soldstatus $85,000
-
1990-06-19soldstatus $21,000
-
1987-09-18soldstatus $21,000
ⓘ Source: listings_history table (triggers on properties + properties_extension) + one-shot
backfill from property_details.listing_events for pre-trigger history.
Tax reassessment forecast NY · Partial reset (capped growth)
- Current annual tax
- $8,325 · $694/mo
- Projected year-2 tax
- $18,950 · $1,579/mo
- Expected delta
- +$10,625/yr (+$885/mo · 127.6%)
ⓘ Screening estimate from a state-policy table — verify with the county assessor before closing.
Nearby sold comps map
Loading sold comps map…
Walkable amenities ~0.75 mi
Loading nearby amenities…
Taxation est. · year 1
- Rental income
- $492,804
- − Mortgage interest
- −$98,027
- − Property taxes
- −$8,325
- − Insurance
- −$8,750
- − Repairs & maintenance
- −$39,424
- − Management
- −$39,424
- − Depreciation
- −$50,909
- Taxable income
- $247,944
- Est. tax owed @ 24.0%
- −$59,507
- After-tax cash flow
- $202,607/yr
For passive investors: Depreciation is non-cash, so a rental often shows a tax loss while cash-flowing — sheltering income. Rental losses are passive: they offset passive income freely, and up to $25,000/yr can offset ordinary (W-2) income if you actively participate and your MAGI is under $100k (phasing out to $0 by $150k); unused losses carry forward. On sale, claimed depreciation is recaptured at up to 25%, and gains may owe capital-gains tax (a 1031 exchange can defer both). Figures are a year-1 estimate at your 24.0% rate — not tax advice; consult a CPA.
Schools (NCES district)
No district data.
Livability — New York
- Score
- 75/100
- State rank
- #268
- US rank
- #4188
Category grades
Schools grade is shown separately in the Schools card above.
Census & demographics
- Census place
- New York, NY
- County
- Bronx County · 1,197,324 people
- City population
- 7,731,280
- Metro
- New York-Newark-Jersey City, NY-NJ-PA
- Population (ZIP)
- 39,570
- Household income
- $24,086
- Rent vs Own
- Severe rent burden
- 5002.0
Population outlook (Bronx County) Hauer SSP2
- Today (2025)
- 1,607,353 people
- By 2030
- 1,681,852 · +4.6%
- By 2040
- 1,824,421 · +13.5%
- By 2050
- 1,945,470 · +21.0%
- By 2075
- 2,187,887 · +36.1%
- By 2100
- 2,244,136 · +39.6%
Race, ethnicity, and origin ACS 2023
- Neighborhood character
- Predominantly Hispanic (70%)
- Race & ethnicity
- Hispanic / Latino 70% Black 23% Two or more races 14% White 3% Native American 3% Pacific Islander 1%
- Hispanic origin (detail)
- Mexican 13% Puerto Rican 29% Dominican 17%
- Foreign-born
- 29% · Canada, Jamaica
- Languages at home
- 36% English-only · Spanish 58% French/Haitian/Cajun 2%
Political lean MEDSL · Bronx
- 2024 margin
- Solid D (+45.4) · D 72.7% · R 27.3%
- 2008→2024 swing
- -32.3pp toward R · 2008: 77.8pp · 2024: 45.4pp
- All cycles
- 2024: D+45.4 2020: D+67.6 2016: D+79.1 2012: D+82.9 2008: D+77.8
Not yet ingested
- Civics
- —
Market trends
- HPI YoY
- ▲ 4.67%
- Current HPI
- 238.974
- Rent YoY
- ▲ 0.61%
- Metro
- New York-Newark-Jersey City, NY-NJ-PA
- State GDP YoY
- ▲ 2.60%
- F500 in state
- 92
Industry mix (Fortune 500 HQ in NY)
| Industry | F500 HQs | Revenue |
|---|---|---|
| Financial Services | 10 | $950B |
|
||
| Consumer Goods | 9 | $162B |
|
||
| Insurance | 4 | $225B |
|
||
| Telecommunications | 2 | $144B |
|
||
| Pharmaceuticals | 2 | $112B |
|
||
| Media / Entertainment | 2 | $69B |
|
||
Price history
+8947.6% since first listed6 events — show timeline
- 2026-05-13 Listed $1,900,000 OneKey® MLS as Distributed by MLS Grid
- 2022-02-02 Sold (Public Records) $912,000 Public Records
- 2003-12-04 Sold (Public Records) $150,000 Public Records
- 2001-06-28 Sold (Public Records) $85,000 Public Records
- 1990-06-19 Sold (Public Records) $21,000 Public Records
- 1987-09-18 Sold (Public Records) $21,000 Public Records
Property tax history
+7.4%/yrLatest (2025): $8,325 · +18.0% YoY. Source: county tax records.
Cash-flow waterfall
monthlySold comps — $/sqft
last 12 mo · ≤1 miLoading sold comps…