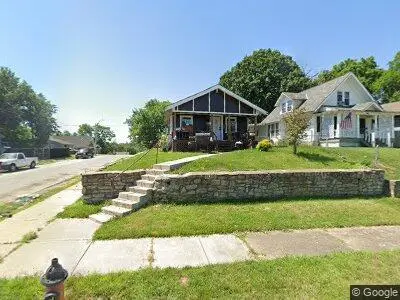
2317 E 49th St · Kansas City, MO
Flood risk 1/10 · Minimal
- FEMA flood zone
- X (unshaded)
- Chance of flooding over 30 yrs
- 0.0%
- Est. flood insurance / yr
- $473 – $860
Fire risk 1/10 · Minimal
- Est. fire insurance / yr
- $1,054 – $1,958
Heat risk 4/10 · Minor
- Hot days now (above 107°F)
- 7 days/yr
- Hot days in 30 yrs
- 17 days/yr
Wind risk 2/10 · Minimal
- Chance of severe wind over 30 yrs
- —
Air-quality risk 3/10 · Minor
- Unhealthy air days now
- 2 days/yr
- Unhealthy air days in 30 yrs
- 4 days/yr
Risk factors via First Street. Map © Google.
Why this score? — see what drove the B- grade
The composite is a weighted blend of 9 inputs, each scored 0–100. Each bar is that input's sub-score; the figure is the points it added to the 100-point composite (weight × sub-score).
- Cash flow +30.0/30.0
- 1% rule +10.0/10.0
- DSCR +10.0/10.0
- ARV discount +7.5/15.0
- Livability +3.9/5.0
- Rent growth +3.6/5.0
- Condition / age +2.5/5.0
- Schools +1.5/10.0
- Appreciation +0.0/10.0
$50,000
🖨 Deal sheet (PDF) 📄 Offer letter ✓ Due diligence
Listing remarks
New roof and paint on outside is less than 3 years old. Needs some interior work. Ready to be setup up to your liking.
Key facts
- Built 1923
Property features AI
Exterior
- Home design: Built in 1923
- Exterior features: Located in the Blue Hills subdivision
Neighborhood map
What this means for you Summary
Snapshot
- This is a 2-bed/1.0-bath single-family listed at $50k.
Deal economics
- At list price, monthly cash flow is $520 ($6k/yr) — positive.
- The deal already cash-flows at list — no discount required.
- Meets the 1% rule at list price ($1k rent vs $50k).
- Cap rate 18.8% vs local median 3.9% in Kansas City — top-decile yield for the area; either an underpriced asset or a hidden risk that comps aren't pricing in. Stress-test before assuming the spread holds.
Location & tenants
- Location reads 78/100 on livability (#28 in MO, #2,671 nationally) — a middle-class / working-renter tenant base. Strengths: amenities A+, commute A+, cost of living A+; Watch: crime F.
- Kansas City 33 (urban): math 12% / reading 24% proficiency, ranked #308 of 324 in MO (top 95%) — low school quality limits family demand, transient renter base, plan for 1-2y turnover; 75% free/reduced lunch — lower-income household profile, screen leases tightly.
- Zoned schools: M. L. King Elementary (math 2% / reading 8%, grade F, #1,072 of 1,115 statewide, top 98%, 665 students, 100% FRL); Central Middle School (math 0% / reading 9%, grade F, #388 of 391 statewide, top 99%, 428 students, 99% FRL); Southeast High School (math 2% / reading 12%, grade F, #512 of 521 statewide, top 99%, 487 students, 99% FRL) — zoned schools average 99% FRL vs 75% district-wide (24 pts higher); higher-poverty schools than district average — tighter screening recommended.
- Zoned-school proficiency averages 6% at this address vs 18% district-wide (-12 pts) — the specific schools serving this property underperform the Kansas City 33 average; the district grade overstates school quality for this exact location.
- Market conditions: Rents rising fast (+4.4%/yr); 187 active listings in the ZIP; 34 comparable units currently listed for rent nearby; rentals at typical pace (median 27d on market — plan ~3-4 weeks tenant-placement turnaround); lower-income renter base — watch delinquency; 4,002 units permitted in Jackson County in 2024 (2,271 in 5+ unit buildings).
Forward outlook
- Local home prices are declining (-3.0%/yr); year-one equity from $346 of loan paydown is wiped out by about $2k of value loss. Plan a longer hold.
- Jackson County population projected at +4% by 2050 — modest demand growth; plan on rents tracking national, not racing it.
- At projected returns (-3.0% appreciation + 4.4% rent growth), your $14k cash investment doubles in ~3 years — after that, you're playing with house money.
Negotiation context
- Only 1 days on market — expect competitive offers; lowballing is unlikely to land.
Risks & watch-outs
- Watch-outs: built in 1923 — expect roof / HVAC / electrical / plumbing capex.
Questions for the listing agent
- Built in 1923 — when were the roof, HVAC, electrical panel, plumbing, and water heater last replaced?
- Is there a deadline driving the sale (1031 exchange, divorce, estate, relocation)? That informs how much negotiation room exists.
- Crime grade is F in this area — have there been break-ins, vandalism, or insurance claims at this property in the last 3 years? What carrier currently insures it and at what premium?
- What's the average days-on-market for RENTAL listings here right now (not sales)? A rising rental-DOM trend means longer vacancies and softer asking-rent achievability than the comps imply.
- What's the recent tenant-quality profile in this submarket — average credit score on applications, eviction rate, late-payment / NSF rate, and stable-employment percentage? A property-management company in the area should have these aggregated.
- How much new for-sale + rental construction is in the pipeline within 1–3 miles? Heavy new supply typically softens prices + rents 12–24 months out; constrained supply supports both.
Investment metrics
- 1% rule
- 2.10% ✓
- Cap rate
- 18.77%
- Cash-on-cash
- 44.55%
- DSCR
- 2.98
- GRM
- 4.0
CMA / ARV
No comps found within radius.
Projected returns pro-forma
-3.0% appreciation · 4.42% rent growth · sell at horizon
- IRR
- 43.1%
- Equity multiple
- 2.89×
- Total profit
- $26,513
- Equity at exit
- $7,455
- IRR
- 49.8%
- Equity multiple
- 6.15×
- Total profit
- $72,108
- Equity at exit
- $4,323
Cash invested: $14,000 (down + closing). Projections, not guarantees.
Landlord ↔ Tenant lean methodology
- Overall (STATE)
- 81 Strongly Landlord-Friendly
- State Missouri
- 81 Strongly Landlord-Friendly · R+10
- County
- — inherits STATE
- City
- — inherits STATE
ZIP-level market 64130
- Home prices YoY
- -21.5%
- Rents YoY
- 4.4%
- Active inventory
- 187
- Price-to-rent
- 4.0×
Monthly cashflow live
- Estimated rent
- $1,049 high interval (Pro) →
- Mortgage (P&I)
- −$262
- Tax from tax record
- −$26 /mo · $316/yr
- Insurance
- −$21
- HOA
- −$0
- Lot rent
- −$0
- Vacancy / Maint / Mgmt
- −$220
- Net cashflow
- $520
Break-even live
Sensitivity live
| Price | -10% $548 | -5% $534 | +0% $520 | +5% $506 | +10% $491 |
|---|---|---|---|---|---|
| Rent | -10% $437 | -5% $478 | +0% $520 | +5% $561 | +10% $603 |
| Rate | -1.0pp $545 | -0.5pp $532 | base $520 | +0.5pp $507 | +1.0pp $494 |
UW: 25.0% down · 7.5% · 30yr · 1.5% tax · 5.0% vac · 8.0% maint · 8.0% mgmt
Financing live
Cash to close
- Down payment
- $12,500
- Closing costs
- $1,500
- Reserves months
- —
- Total cash needed
- —
Loan-product check · same deal, 3 products live
Conventional
25% down · 7.5% · 30yr
- Down + closing
- —
- Monthly P&I
- —
- Monthly cashflow
- —
- DSCR
- —
- Eligible?
- —
Personal DTI + credit; lowest rate.
DSCR
20% down · 8.5% · 30yr
- Down + closing
- —
- Monthly P&I
- —
- Monthly cashflow
- —
- DSCR
- —
- Eligible?
- —
No personal income docs; deal must DSCR.
Hard money
10% down · 12.0% · 12mo
- Down + closing
- —
- Monthly P&I
- —
- Monthly cashflow
- —
- DSCR
- —
- Eligible?
- —
Short-term bridge; refi at stabilization.
Rent comps 34 comps
| Address | Beds | Baths | Sqft | Rent | $/sqft | DOM | Units | Dist |
|---|---|---|---|---|---|---|---|---|
| 3017 E 51st St Kansas City, MO | 2.0 | 1.0 | 621 | $1,303 | $2.10 | 10d | 1 | 0.48mi |
| 4838 The Paseo Kansas City, MO | 1.0 | 1.0 | 518 | $827 | $1.60 | 46d | 1 | 0.64mi |
| 1410 E 49th St Kansas City, MO | 1.0 | 1.0 | 518 | $873 | $1.69 | 46d | 1 | 0.64mi |
| 4818 Paseo Blvd Unit 1W Kansas City, MO | 1.0 | 1.0 | 526 | $945 | $1.80 | 26d | 1 | 0.64mi |
| 4818 Paseo Blvd Kansas City, MO | 1.0 | 1.0 | 518 | $850 | $1.64 | 46d | 9 | 0.64mi |
| 4828 The Paseo Kansas City, MO | 1.0 | 1.0 | 518 | $827 | $1.60 | 46d | 1 | 0.65mi |
| 4818 Paseo Blvd Kansas City, MO | 1.0 | 1.0 | 526 | $945 | $1.80 | 14d | 10 | 0.65mi |
| 4818 Paseo Blvd Kansas City, MO | 1.0 | 1.0 | 526 | $945 | $1.80 | 6d | 8 | 0.65mi |
| 4832 The Paseo Kansas City, MO | 1.0 | 1.0 | 518 | $873 | $1.69 | 46d | 1 | 0.65mi |
| 4840 The Paseo Kansas City, MO | 1.0 | 1.0 | 518 | $827 | $1.60 | 46d | 1 | 0.65mi |
| 4818 The Paseo Unit 2N Kansas City, MO | 1.0 | 1.0 | 526 | $995 | $1.89 | 26d | 1 | 0.65mi |
| 4818 The Paseo Unit 2N Kansas City, MO | 1.0 | 1.0 | 526 | $945 | $1.80 | 19d | 1 | 0.65mi |
| 4818 The Paseo Unit 3S Kansas City, MO | 1.0 | 1.0 | 526 | $895 | $1.70 | 26d | 1 | 0.65mi |
| 4820 The Paseo Kansas City, MO | 1.0 | 1.0 | 518 | $873 | $1.69 | 46d | 1 | 0.66mi |
| 1500 E 46th St Kansas City, MO | 1.0–3.0 | 1.0 | 803 | $1,050 | $1.31 | 46d | 1 | 0.68mi |
| 1320 E 49th St Kansas City, MO | 1.0 | 1.0 | 550 | $1,000 | $1.82 | 5d | 2 | 0.69mi |
| 3315 E 52nd St Kansas City, MO | 2.0 | 1.0 | 662 | $1,125 | $1.70 | 26d | 1 | 0.71mi |
| 5702 Euclid Ave Kansas City, MO | 2.0 | 1.0 | 683 | $1,000 | $1.46 | 46d | 1 | 1.01mi |
| 5713 Brooklyn Ave Kansas City, MO | 2.0 | 1.0 | 600 | $1,200 | $2.00 | 10d | 1 | 1.02mi |
| 2305 E 41st St Kansas City, MO | 2.0 | 1.0 | 750 | $1,000 | $1.33 | 10d | 1 | 1.02mi |
| 4232 Virginia Ave Unit 1 Kansas City, MO | 1.0 | 1.0 | 592 | $750 | $1.27 | 22d | 1 | 1.08mi |
| 4200 Tracy Ave Kansas City, MO | 1.0 | 1.0 | 500 | $1,150 | $2.30 | 26d | 1 | 1.17mi |
| 2512 E 59th St Kansas City, MO | 2.0 | 1.0 | 750 | $1,150 | $1.53 | 46d | 1 | 1.21mi |
| 2205 E 59th St Kansas City, MO | 2.0 | 1.0 | 724 | $1,025 | $1.42 | 19d | 1 | 1.23mi |
| 815 E 42nd St Unit 815-3W Kansas City, MO | 1.0 | 1.0 | 650 | $1,050 | $1.62 | 10d | 1 | 1.36mi |
| 817 E 42nd St Kansas City, MO | 1.0 | 1.0 | 650 | $1,050 | $1.62 | 6d | 1 | 1.36mi |
| 811 E 42nd St Kansas City, MO | 1.0 | 1.0 | 650 | $1,050 | $1.62 | 0d | 1 | 1.37mi |
| 809 E 42nd St Unit 809-3W Kansas City, MO | 1.0 | 1.0 | 650 | $1,050 | $1.62 | 46d | 1 | 1.37mi |
| 801 E 42nd St Unit 3E Kansas City, MO | 1.0 | 1.0 | 700 | $965 | $1.38 | 6d | 1 | 1.38mi |
| 4800 Oak St Kansas City, MO | 1.0–3.0 | 1.0–2.0 | 967 | $1,929 | $1.99 | 0d | 17 | 1.39mi |
| 303 Brush Creek Blvd Kansas City, MO | 1.0 | 1.0 | 575 | $950 | $1.65 | 46d | 6 | 1.46mi |
| 607 E 42nd St Kansas City, MO | 1.0–2.0 | 1.0 | 625 | $1,150 | $1.84 | 6d | 3 | 1.46mi |
| 605 E 42nd St Unit 605-1B Kansas City, MO | 1.0 | 1.0 | 400 | $915 | $2.29 | 26d | 1 | 1.47mi |
| 4201 Kenwood Ave Kansas City, MO | 2.0 | 1.0 | 750 | $919 | $1.23 | 24d | 2 | 1.48mi |
Listing history 4 events
-
2026-05-26$50,000 Active
-
2016-05-10soldstatus
-
2000-05-19soldstatus
-
1998-05-21soldstatus
ⓘ Source: listings_history table (triggers on properties + properties_extension) + one-shot
backfill from property_details.listing_events for pre-trigger history.
Tax reassessment forecast MO · Resets to sale price
- Current annual tax
- $316 · $26/mo
- Projected year-2 tax
- $485 · $40/mo
- Expected delta
- +$169/yr (+$14/mo · 53.5%)
ⓘ Screening estimate from a state-policy table — verify with the county assessor before closing.
Climate risk First Street
- Flood 1/10 Low FEMA zone X (unshaded) · 0% chance over 30 yrs
- Wildfire 1/10 Low
- Heat 4/10 Moderate 7 d/yr ≥107°F today · 17 d/yr by 30 yrs out
- Wind 2/10 Low
- Air quality 3/10 Moderate 2 unhealthy d/yr today · 4 by 30 yrs out
Nearby sold comps map
Loading sold comps map…
Walkable amenities ~0.75 mi
Loading nearby amenities…
Taxation est. · year 1
- Rental income
- $12,594
- − Mortgage interest
- −$2,801
- − Property taxes
- −$316
- − Insurance
- −$250
- − Repairs & maintenance
- −$1,008
- − Management
- −$1,008
- − Depreciation
- −$1,455
- Taxable income
- $5,757
- Est. tax owed @ 24.0%
- −$1,382
- After-tax cash flow
- $4,855/yr
For passive investors: Depreciation is non-cash, so a rental often shows a tax loss while cash-flowing — sheltering income. Rental losses are passive: they offset passive income freely, and up to $25,000/yr can offset ordinary (W-2) income if you actively participate and your MAGI is under $100k (phasing out to $0 by $150k); unused losses carry forward. On sale, claimed depreciation is recaptured at up to 25%, and gains may owe capital-gains tax (a 1031 exchange can defer both). Figures are a year-1 estimate at your 24.0% rate — not tax advice; consult a CPA.
Schools (NCES district)
- District
- Kansas City 33
- NCES district ID
- 2916400
- Math proficiency
- 12% ▼ -8.00%
- Reading proficiency
- 24% ▬ 0.00%
- Median HH income
- $35,227
- Composite
- 14.8/100
- National rank
- #9387
- State rank
- #308 of 324 in MO
Livability — Kansas City
- Score
- 78/100
- State rank
- #28
- US rank
- #2671
Category grades
Schools grade is shown separately in the Schools card above.
Census & demographics
- Census place
- Kansas City, MO
- County
- Jackson County · 687,798 people
- City population
- 439,467
- Metro
- Kansas City, MO-KS
- Population (ZIP)
- 19,644
- Household income
- $42,221
- Rent vs Own
- Severe rent burden
- 1132.0
Population outlook (Jackson County) Hauer SSP2
- Today (2025)
- 719,589 people
- By 2030
- 731,456 · +1.6%
- By 2040
- 746,689 · +3.8%
- By 2050
- 749,289 · +4.1%
- By 2075
- 736,227 · +2.3%
- By 2100
- 668,210 · -7.1%
Race, ethnicity, and origin ACS 2023
- Neighborhood character
- Predominantly Black (80%)
- Race & ethnicity
- Black 80% White 9% Hispanic / Latino 8% Two or more races 6%
- Hispanic origin (detail)
- Mexican 5%
- Common ancestry
- Lithuanian 1% Swedish 0%
- Foreign-born
- 6% · Canada
- Languages at home
- 92% English-only · Spanish 7%
Political lean MEDSL · Jackson
- 2024 margin
- D (+19.3) · D 58.9% · R 39.5% · Other 1.6%
- 2008→2024 swing
- -6.1pp toward R · 2008: 25.4pp · 2024: 19.3pp
- All cycles
- 2024: D+19.3 2020: D+22.0 2016: D+16.6 2012: D+19.0 2008: D+25.4
Not yet ingested
- Civics
- —
Market trends
- HPI YoY
- ▼ -73.32%
- Current HPI
- 267.491
- Rent YoY
- ▲ 4.42%
- Metro
- Kansas City, MO-KS
- State GDP YoY
- ▲ 1.84%
- F500 in state
- 20
Industry mix (Fortune 500 HQ in MO)
| Industry | F500 HQs | Revenue |
|---|---|---|
| Healthcare | 1 | $163B |
|
||
| Insurance | 1 | $21B |
|
||
| Industrial Technology | 1 | $17B |
|
||
| Retail | 1 | $16B |
|
||
| Industrial Distribution | 1 | $10B |
|
||
| Utilities | 1 | $9B |
|
||
Price history
4 events — show timeline
- 2026-05-26 Listed $50,000 FSBO.com
- 2016-05-10 Sold (Public Records) — Public Records
- 2000-05-19 Sold (Public Records) — Public Records
- 1998-05-21 Sold (Public Records) — Public Records
Property tax history
+5.5%/yrLatest (2025): $316 · +14.2% YoY. Source: county tax records.
Cash-flow waterfall
monthlySold comps — $/sqft
last 12 mo · ≤1 miLoading sold comps…