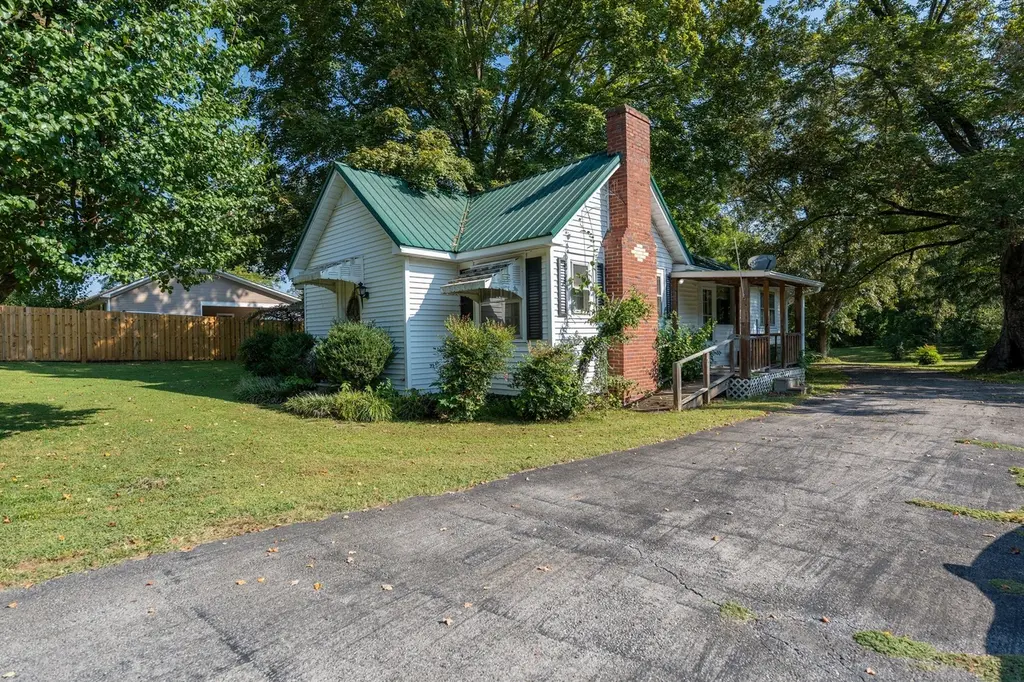
2010 W Gaines St · Lawrenceburg, TN
Flood risk 1/10 · Minimal
- FEMA flood zone
- X (unshaded)
- Chance of flooding over 30 yrs
- 0.0%
- Est. flood insurance / yr
- $507 – $1,088
Fire risk 4/10 · Minor
- Est. fire insurance / yr
- $949 – $1,763
Heat risk 5/10 · Moderate
- Hot days now (above 103°F)
- 7 days/yr
- Hot days in 30 yrs
- 20 days/yr
Wind risk 4/10 · Minor
- Chance of severe wind over 30 yrs
- 19.0%
Air-quality risk 1/10 · Minimal
- Unhealthy air days now
- 0 days/yr
- Unhealthy air days in 30 yrs
- 0 days/yr
Risk factors via First Street. Map © Google.
Why this score? — see what drove the D grade
The composite is a weighted blend of 9 inputs, each scored 0–100. Each bar is that input's sub-score; the figure is the points it added to the 100-point composite (weight × sub-score).
- Cash flow +15.0/30.0
- ARV discount +7.5/15.0
- DSCR +4.6/10.0
- Livability +3.4/5.0
- 1% rule +3.0/10.0
- Rent growth +2.5/5.0
- Condition / age +2.5/5.0
- Schools +2.4/10.0
- Appreciation +0.0/10.0
$165,000
🖨 Deal sheet 📄 Offer letter ✓ Due diligence
Listing remarks MLS
This cozy cottage is in a great location! A beautiful natural setting with the David Crockett State Park just beyond the backyard fence! Enjoy all the wildlife and comfort in this country home; but wait you are only minutes away from town allowing you the best of both worlds!
Key facts
- 0.78 acre lot
- Built 1930
- Listed 85 days
Property features AI
Exterior
- Parking: No covered spaces listed; No total parking spaces listed
- Utilities: Public water; Public sewer; Electricity available; Water service available
- Home design: Single-family residence; One story; Has a view
- Construction: Vinyl siding; Metal roof; Existing construction
- Exterior features: Front porch; Level lot
Interior
- Kitchen: Electric oven; Cooktop; Dishwasher
- Bedrooms: 3 bedrooms (all on the main level); Primary bedroom approximately 12 x 16; Second bedroom approximately 10 x 11; Third bedroom approximately 11 x 12
- Flooring: Carpet; Wood; Laminate; Tile
- Bathrooms: 2 full bathrooms; At least one bedroom with a full bath
- Heating & cooling: Central heating (electric); Central air conditioning (electric)
- Interior features: Eat-in kitchen; Crawl space basement
- Laundry & utility: Washer hookup; Gas dryer hookup
Neighborhood map
What this means for you Summary
Snapshot
- This is a 3-bed/1.0-bath single-family listed at $165k.
Deal economics
- At list price, monthly cash flow is $50 ($599/yr) — positive.
- The deal already cash-flows at list — no discount required.
- To meet the 1% rule (rent ≥ 1% of price), the offer needs to be $131k (20.4% below list).
- Recommended offer: $131k (20.4% below list) — sets the bar for 1% rule.
Location & tenants
- Location reads 67/100 on livability (#105 in TN) — a middle-class / working-renter tenant base. Strengths: cost of living A+, housing A+, health & safety A+; Watch: amenities F, commute F, employment F.
- Lawrence County (rural): math 29% / reading 29% proficiency, ranked #67 of 139 in TN (top 48%) — low school quality limits family demand, transient renter base, plan for 1-2y turnover.
- Zoned schools: David Crockett Elementary (math 30% / reading 36%, grade F, #361 of 952 statewide, top 38%, 462 students, 0% FRL); Lawrence Co High School (math 26% / reading 23%, grade F, #129 of 332 statewide, top 43%, 1,143 students, 0% FRL) — zoned schools average 0% FRL vs 50% district-wide (50 pts lower); this property's tenant base skews higher-income than the district average.
- Market conditions: 169 active listings in the ZIP; 27 units permitted in Lawrence County in 2024 (0 in 5+ unit buildings).
Forward outlook
- Local home prices are declining (-3.0%/yr); year-one equity from $1k of loan paydown is wiped out by about $5k of value loss. Plan a longer hold.
- Lawrence County population projected to shrink 4% by 2050 — rents likely to lag national; underwrite the cash flow, not the appreciation.
Negotiation context
- It's been on market 86 days — a 6% lower offer ($155k) is reasonable based on typical stale-listing flexibility.
- 4 sale attempts; this cycle's ask has dropped $20k (11%) from the opening price — seller is motivated, your offer sets the floor, not the list.
Risks & watch-outs
- Watch-outs: built in 1930 — expect roof / HVAC / electrical / plumbing capex.
- Climate carrying-cost: extreme-heat days projected 7→20/yr by 2055 (HVAC capex compounding) — expect insurance premiums to compound above CPI over the hold.
Questions for the listing agent
- It's been on market 86 days. Have you received any prior offers? Is the seller open to a 20% concession, seller financing, or rate buy-down credit?
- Built in 1930 — when were the roof, HVAC, electrical panel, plumbing, and water heater last replaced?
- Why hasn't it sold? Are there any deal-killer items the seller is aware of (foundation, flood, title, zoning, code violations)?
- Is there a deadline driving the sale (1031 exchange, divorce, estate, relocation)? That informs how much negotiation room exists.
- Schools are D-rated, which usually means shorter tenancies and higher turnover. Who's the typical renter profile here, and what's been the actual vacancy rate?
- The area grade is low — what's the realistic commute time and amenity access for the typical tenant pool here? Any planned neighborhood developments (good or bad) we should know about?
- What's the average days-on-market for RENTAL listings here right now (not sales)? A rising rental-DOM trend means longer vacancies and softer asking-rent achievability than the comps imply.
- What's the recent tenant-quality profile in this submarket — average credit score on applications, eviction rate, late-payment / NSF rate, and stable-employment percentage? A property-management company in the area should have these aggregated.
- How much new for-sale + rental construction is in the pipeline within 1–3 miles? Heavy new supply typically softens prices + rents 12–24 months out; constrained supply supports both.
Investment metrics
- 1% rule
- 0.80% ✗
- Cap rate
- 6.66%
- Cash-on-cash
- 1.30%
- DSCR
- 1.06
- GRM
- 10.5
CMA / ARV
No comps found within radius.
Projected returns pro-forma
-3.0% appreciation · 3.0% rent growth · sell at horizon
- IRR
- -14.3%
- Equity multiple
- 0.49×
- Total profit
- $-23,630
- Equity at exit
- $24,602
- IRR
- -5.6%
- Equity multiple
- 0.64×
- Total profit
- $-16,781
- Equity at exit
- $14,266
Cash invested: $46,200 (down + closing). Projections, not guarantees.
Landlord ↔ Tenant lean methodology
- Overall (STATE)
- 87 Strongly Landlord-Friendly
- State Tennessee
- 87 Strongly Landlord-Friendly · R+13
- County
- — inherits STATE
- City
- — inherits STATE
ZIP-level market 38464
- Home prices YoY
- -19.4%
- Active inventory
- 169
- Price-to-rent
- 10.5×
Monthly cashflow live
- Estimated rent
- $1,314 medium interval (Pro) →
- Mortgage (P&I)
- −$865
- Tax from tax record
- −$54 /mo · $651/yr
- Insurance
- −$69
- HOA
- −$0
- Vacancy / Maint / Mgmt
- −$276
- Net cashflow
- $50
Break-even live
UW: 25.0% down · 7.5% · 30yr · 1.5% tax · 5.0% vac · 8.0% maint · 8.0% mgmt
Financing live
Cash to close
- Down payment
- $41,250
- Closing costs
- $4,950
- Reserves months
- —
- Total cash needed
- —
Loan-product check · same deal, 3 products live
Conventional
25% down · 7.5% · 30yr
- Down + closing
- —
- Monthly P&I
- —
- Monthly cashflow
- —
- DSCR
- —
- Eligible?
- —
Personal DTI + credit; lowest rate.
DSCR
20% down · 8.5% · 30yr
- Down + closing
- —
- Monthly P&I
- —
- Monthly cashflow
- —
- DSCR
- —
- Eligible?
- —
No personal income docs; deal must DSCR.
Hard money
10% down · 12.0% · 12mo
- Down + closing
- —
- Monthly P&I
- —
- Monthly cashflow
- —
- DSCR
- —
- Eligible?
- —
Short-term bridge; refi at stabilization.
Listing history 23 events
-
2026-06-18days on market $165,000 Active 86 DOM
-
2026-06-17days on market $165,000 Active 85 DOM
-
2026-06-16days on market $165,000 Active 84 DOM
-
2026-06-15days on market $165,000 Active 83 DOM
-
2026-06-13days on market $165,000 Active 81 DOM
-
2026-06-12days on market $165,000 Active 80 DOM
-
2026-06-09days on market $165,000 Active 77 DOM
-
2026-06-08days on market $165,000 Active 76 DOM
-
2026-06-08days on market $165,000 Active 75 DOM
-
2026-06-07days on market $165,000 Active 74 DOM
-
2026-06-03days on market $165,000 Active 71 DOM
-
2026-06-02days on market $165,000 Active 70 DOM
-
2026-06-01days on market $165,000 Active 69 DOM
-
2026-05-31days on market $165,000 Active 68 DOM
-
2026-05-08status Active
-
2026-04-09price $165,000
-
2026-03-16$185,000 Active
-
2026-03-10historical
-
2026-01-12price $195,000
-
2025-10-14price $209,900
-
2025-09-13$219,900 Active
-
2025-08-22historical 276-char remark
Show marketing remark (276 chars)
This cozy cottage is in a great location! A beautiful natural setting with the David Crockett State Park just beyond the backyard fence! Enjoy all the wildlife and comfort in this country home; but wait you are only minutes away from town allowing you the best of both worlds!
-
2025-03-12$279,000 Active 276-char remark
Show marketing remark (276 chars)
This cozy cottage is in a great location! A beautiful natural setting with the David Crockett State Park just beyond the backyard fence! Enjoy all the wildlife and comfort in this country home; but wait you are only minutes away from town allowing you the best of both worlds!
ⓘ Source: listings_history table (triggers on properties + properties_extension) + one-shot
backfill from property_details.listing_events for pre-trigger history.
Tax reassessment forecast TN · Resets to sale price
- Current annual tax
- $651 · $54/mo
- Projected year-2 tax
- $1,172 · $98/mo
- Expected delta
- +$520/yr (+$43/mo · 80.0%)
ⓘ Screening estimate from a state-policy table — verify with the county assessor before closing.
Climate risk First Street
- Flood 1/10 Low FEMA zone X (unshaded) · 0% chance over 30 yrs
- Wildfire 4/10 Moderate
- Heat 5/10 Major 7 d/yr ≥103°F today · 20 d/yr by 30 yrs out
- Wind 4/10 Moderate 19% chance of damaging wind over 30 yrs
- Air quality 1/10 Low 0 unhealthy d/yr today · 0 by 30 yrs out
Nearby sold comps map
Loading sold comps map…
Walkable amenities ~0.75 mi
Loading nearby amenities…
Taxation est. · year 1
- Rental income
- $15,770
- − Mortgage interest
- −$9,243
- − Property taxes
- −$651
- − Insurance
- −$825
- − Repairs & maintenance
- −$1,262
- − Management
- −$1,262
- − Depreciation
- −$4,800
- Taxable loss
- −$2,272
- Est. tax savings @ 24.0%
- +$545
- After-tax cash flow
- $1,144/yr
For passive investors: Depreciation is non-cash, so a rental often shows a tax loss while cash-flowing — sheltering income. Rental losses are passive: they offset passive income freely, and up to $25,000/yr can offset ordinary (W-2) income if you actively participate and your MAGI is under $100k (phasing out to $0 by $150k); unused losses carry forward. On sale, claimed depreciation is recaptured at up to 25%, and gains may owe capital-gains tax (a 1031 exchange can defer both). Figures are a year-1 estimate at your 24.0% rate — not tax advice; consult a CPA.
Schools (NCES district)
- District
- Lawrence County
- NCES district ID
- 4702340
- Math proficiency
- 29% ▼ -11.00%
- Reading proficiency
- 29% ▼ -8.00%
- Median HH income
- $37,613
- Composite
- 24.2/100
- National rank
- #7729
- State rank
- #67 of 139 in TN
Livability — Lawrenceburg
- Score
- 67/100
- State rank
- #105
- US rank
- #10729
Category grades
Schools grade is shown separately in the Schools card above.
Census & demographics
- Census place
- Lawrenceburg, TN
- Population (ZIP)
- 23,727
Population outlook (Lawrence County) Hauer SSP2
- Today (2025)
- 42,724 people
- By 2030
- 42,627 · -0.2%
- By 2040
- 42,144 · -1.4%
- By 2050
- 40,800 · -4.5%
- By 2075
- 36,643 · -14.2%
- By 2100
- 29,193 · -31.7%
Race, ethnicity, and origin ACS 2023
- Neighborhood character
- Predominantly White (88%)
- Race & ethnicity
- White 88% Two or more races 6% Hispanic / Latino 4% Black 3%
- Common ancestry
- Slovak 2% Iranian 2% Italian 1%
- Foreign-born
- 2% · Canada
- Languages at home
- 96% English-only · Spanish 2% German/W. Germanic 1%
Political lean MEDSL · Lawrence
- 2024 margin
- Solid R (+69.1) · D 15.1% · R 84.1%
- 2008→2024 swing
- -35.3pp toward R · 2008: -33.7pp · 2024: -69.1pp
- All cycles
- 2024: R+69.1 2020: R+64.8 2016: R+61.3 2012: R+42.9 2008: R+33.7
Not yet ingested
- Civics
- —
Market trends
- HPI YoY
- ▼ -70.17%
- Current HPI
- 291.6302
- Rent YoY
- —
- Metro
- —
- State GDP YoY
- ▲ 2.78%
- F500 in state
- 22
Industry mix (Fortune 500 HQ in TN)
| Industry | F500 HQs | Revenue |
|---|---|---|
| Healthcare | 3 | $91B |
|
||
| Retail | 3 | $72B |
|
||
| Transportation / Logistics | 1 | $88B |
|
||
| Paper / Packaging | 1 | $19B |
|
||
| Insurance | 1 | $13B |
|
||
| Energy | 1 | $12B |
|
||
Price history
-40.9% since first listed9 events — show timeline
- 2026-05-08 Relisted — REALTRACS as Distributed by MLS Grid
- 2026-04-09 Price Changed $165,000 REALTRACS as Distributed by MLS Grid
- 2026-03-16 Listed $185,000 REALTRACS as Distributed by MLS Grid
- 2026-03-10 Listing Removed — REALTRACS as Distributed by MLS Grid
- 2026-01-12 Price Changed $195,000 REALTRACS as Distributed by MLS Grid
- 2025-10-14 Price Changed $209,900 REALTRACS as Distributed by MLS Grid
- 2025-09-13 Listed $219,900 REALTRACS as Distributed by MLS Grid
- 2025-08-22 Listing Removed — REALTRACS as Distributed by MLS Grid
- 2025-03-12 Listed $279,000 REALTRACS as Distributed by MLS Grid
Property tax history
+3.2%/yrLatest (2025): $651 · +0.0% YoY. Source: county tax records.
Cash-flow waterfall
monthlySold comps — $/sqft
last 12 mo · ≤1 miLoading sold comps…