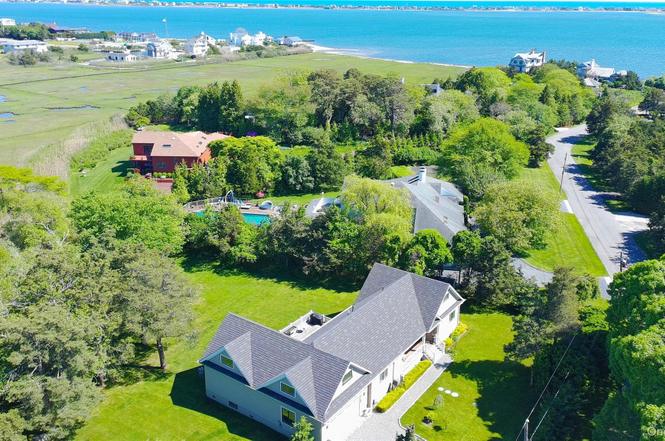
26 Tuthill Ln · Remsenburg-Speonk, NY
Flood risk 7/10 · Major
- FEMA flood zone
- AE
- Chance of flooding over 30 yrs
- 0.93%
- Est. flood insurance / yr
- $1,737 – $8,500
Fire risk 1/10 · Minimal
- Est. fire insurance / yr
- $691 – $1,283
Heat risk 4/10 · Minor
- Hot days now (above 90°F)
- 7 days/yr
- Hot days in 30 yrs
- 18 days/yr
Wind risk 8/10 · Major
- Chance of severe wind over 30 yrs
- 80.0%
Air-quality risk 4/10 · Minor
- Unhealthy air days now
- 4 days/yr
- Unhealthy air days in 30 yrs
- 5 days/yr
Risk factors via First Street. Map © Google.
Why this score? — see what drove the D grade
The composite is a weighted blend of 9 inputs, each scored 0–100. Each bar is that input's sub-score; the figure is the points it added to the 100-point composite (weight × sub-score).
- Cash flow +11.2/30.0
- Appreciation +8.9/10.0
- Schools +4.8/10.0
- ARV discount +3.9/15.0
- DSCR +3.3/10.0
- Rent growth +2.5/5.0
- Livability +2.5/5.0
- Condition / age +2.5/5.0
- 1% rule +2.1/10.0
$1,950,000
🖨 Deal sheet (PDF) 📄 Offer letter ✓ Due diligence
Listing remarks
Modern Hamptons-style ranch on approximately 1.2 acres south of Montauk Highway in the coveted bay area of Remsenburg. Situated on Tuthill Lane, one of the area's most sought-after streets, this beautifully rebuilt home (completed in 2019) offers approximately 2,010 square feet of thoughtfully designed living space, featuring 3 bedrooms, 3 full bathrooms, an attached two-car garage, and room for pool. A pool application has already been submitted. This single-story cedar-shake residence showcases an open-concept floor plan with soaring vaulted ceilings, hardwood floors, oversized windows, and sliding glass doors that open to a spacious rear patio. The chef's kitchen is appointed with premiu
Key facts
- Rebuilt home
- 1.2 acres
- Vaulted ceilings
Tags
Property features AI
Exterior
- Parking: Attached private garage; 2-car garage; Driveway
- Security: Security system
- Utilities: Septic tank; Electricity connected; Water connected; Private trash collection
- Home design: Single family residence; One-level living; Updated/remodeled condition
- Construction: Cedar, frame, and shake siding construction
- Exterior features: Deck; Patio; Porch; Private, landscaped backyard; Near shops and schools
Interior
- Kitchen: Granite counters; Kitchen island; Dishwasher; Microwave; Oven; Refrigerator
- Bedrooms: Includes a first-floor bedroom
- Flooring: Hardwood floors
- Bathrooms: 3 full bathrooms
- Heating & cooling: Central air conditioning; Forced air heating; Propane heating
- Interior features: First-floor bedroom and full bath; Chef's kitchen with kitchen island; Eat-in kitchen and open kitchen; Formal dining and entrance foyer; Open floorplan with high ceilings; Primary bathroom with double vanity; Master suite on the main level; Walk-in closet(s)
- Laundry & utility: Dedicated laundry room; Washer; Dryer
Neighborhood map
What this means for you Summary
Snapshot
- This is a 3-bed/2.0-bath single-family listed at $1.95M.
Deal economics
- At list price, monthly cash flow is $-1k ($-14k/yr) — negative.
- To cash-flow at today's rent, offer at most $1.74M (10.6% below list).
- To meet the 1% rule (rent ≥ 1% of price), the offer needs to be $1.38M (29.1% below list).
- Recommended offer: $1.38M (29.1% below list) — sets the bar for 1% rule.
Location & tenants
- Location reads: area grade D — affects rentability + tenant quality, not the cash-flow math above.
- Remsenburg-Speonk Union Free School District (suburban): math 60% / reading 40% proficiency, ranked #389 of 755 in NY (top 52%) — acceptable for families but not a draw, mixed tenant base, ~2y average lease; only 10% free/reduced lunch — higher-income household profile.
- Zoned schools: Remsenburg-Speonk Elementary School (math 52% / reading 62%, grade C+, #842 of 2,108 statewide, top 43%, 122 students, 36% FRL) — zoned schools average 36% FRL vs 10% district-wide (27 pts higher); higher-poverty schools than district average — tighter screening recommended.
- Market conditions: 41 active listings in the ZIP; 3 comparable units currently listed for rent nearby; rentals leasing fast (median 0d on market — plan ~1-2 weeks tenant-placement turnaround); 1,366 units permitted in Suffolk County in 2024 (216 in 5+ unit buildings).
Forward outlook
- In year one you build about $166k of equity ($13k loan paydown + $152k appreciation (7.8% local appreciation)).
- Suffolk County population projected to shrink 5% by 2050 — rents likely to lag national; underwrite the cash flow, not the appreciation.
- By year 2, paydown + projected appreciation supports a ~$265k cash-out refi (75% LTV) — recoverable capital for the next deal without selling this one.
Negotiation context
- Only 5 days on market — expect competitive offers; lowballing is unlikely to land.
- 4 sale attempts since 14y ago with the ask held roughly flat each time — persistent listings suggest the price (not the market) is what's stuck; bring a comps-based counter.
Risks & watch-outs
- Watch-outs: flood insurance adds $427/mo.
- Climate carrying-cost: in FEMA flood zone AE (mandatory federal flood insurance); severe wind risk, 80% chance of damaging wind over 30y — expect insurance premiums to compound above CPI over the hold.
Questions for the listing agent
- What do current leases actually rent for vs. the listed asking? Can we see a recent rent roll and the last 12 months of T-12 income?
- Built in 1962 — when were the roof, HVAC, electrical panel, plumbing, and water heater last replaced?
- What's the actual annual flood-insurance premium (NFIP or private), and is the property in a SFHA with mandatory coverage?
- Is there a deadline driving the sale (1031 exchange, divorce, estate, relocation)? That informs how much negotiation room exists.
- The area grade is low — what's the realistic commute time and amenity access for the typical tenant pool here? Any planned neighborhood developments (good or bad) we should know about?
- What's the average days-on-market for RENTAL listings here right now (not sales)? A rising rental-DOM trend means longer vacancies and softer asking-rent achievability than the comps imply.
- What's the recent tenant-quality profile in this submarket — average credit score on applications, eviction rate, late-payment / NSF rate, and stable-employment percentage? A property-management company in the area should have these aggregated.
- How much new for-sale + rental construction is in the pipeline within 1–3 miles? Heavy new supply typically softens prices + rents 12–24 months out; constrained supply supports both.
Investment metrics
- 1% rule
- 0.71% ✗
- Cap rate
- 5.84%
- Cash-on-cash
- -1.63%
- DSCR
- 0.93
- GRM
- 11.8
CMA / ARV
- ARV (on-the-fly)
- $1,806,513
- Comps found
- 4
Show comp detail 4 sales within ~0.75 mi
| Address | Dist | Beds/Ba | Sqft | Sold | Price | $/sf | Match |
|---|---|---|---|---|---|---|---|
| 3 Seatuck Ln | 0.42mi | 3/2.0 | 1,856 (-6%) | 5mo | $1,690,000 | $911 | 65 |
| 61 Halsey Rd | 0.24mi | 4/2.0 (+1) | 2,160 (+9%) | 16mo | $1,149,000 | $532 | 56 |
| 56 Nidzyn Ave | 0.65mi | 4/2.5 (+1) | 2,033 (+2%) | 7mo | $1,615,000 | $794 | 53 |
| 26 Basket Neck Ln | 0.70mi | 4/4.0 (+1) | 2,200 (+11%) | 7mo | $2,350,000 | $1,068 | 30 |
Match score weights: distance 35% · size 25% · config 20% · recency 20%. Top-matched comps best support the ARV.
Projected returns pro-forma
7.81% appreciation · 3.0% rent growth · sell at horizon
- IRR
- 17.6%
- Equity multiple
- 2.29×
- Total profit
- $704,422
- Equity at exit
- $1,456,150
- IRR
- 16.8%
- Equity multiple
- 4.84×
- Total profit
- $2,097,169
- Equity at exit
- $2,866,626
Cash invested: $546,000 (down + closing). Projections, not guarantees.
Landlord ↔ Tenant lean methodology
- Overall (STATE)
- 15 Strongly Tenant-Friendly
- State New York
- 15 Strongly Tenant-Friendly · D+10
- County
- — inherits STATE
- City
- — inherits STATE
ZIP-level market 11960
- Home prices YoY
- 2.1%
- Active inventory
- 41
- Price-to-rent
- 11.8×
Monthly cashflow live
- Estimated rent
- $13,822 medium interval (Pro) →
- Mortgage (P&I)
- −$10,226
- Tax from tax record
- −$623 /mo · $7,472/yr
- Insurance
- −$812
- Flood insurance flood zone
- −$427 /mo · $5,118/yr
- HOA
- −$0
- Vacancy / Maint / Mgmt
- −$2,903
- Net cashflow
- $-1,169
Break-even live
Sensitivity live
| Price | -10% $-65 | -5% $-617 | +0% $-1,169 | +5% $-1,720 | +10% $-2,272 |
|---|---|---|---|---|---|
| Rent | -10% $-2,260 | -5% $-1,714 | +0% $-1,169 | +5% $-623 | +10% $-77 |
| Rate | -1.0pp $-187 | -0.5pp $-673 | base $-1,169 | +0.5pp $-1,674 | +1.0pp $-2,188 |
UW: 25.0% down · 7.5% · 30yr · 1.5% tax · 5.0% vac · 8.0% maint · 8.0% mgmt
Financing live
Cash to close
- Down payment
- $487,500
- Closing costs
- $58,500
- Reserves months
- —
- Total cash needed
- —
Loan-product check · same deal, 3 products live
Conventional
25% down · 7.5% · 30yr
- Down + closing
- —
- Monthly P&I
- —
- Monthly cashflow
- —
- DSCR
- —
- Eligible?
- —
Personal DTI + credit; lowest rate.
DSCR
20% down · 8.5% · 30yr
- Down + closing
- —
- Monthly P&I
- —
- Monthly cashflow
- —
- DSCR
- —
- Eligible?
- —
No personal income docs; deal must DSCR.
Hard money
10% down · 12.0% · 12mo
- Down + closing
- —
- Monthly P&I
- —
- Monthly cashflow
- —
- DSCR
- —
- Eligible?
- —
Short-term bridge; refi at stabilization.
Rent comps 3 comps
| Address | Beds | Baths | Sqft | Rent | $/sqft | DOM | Units | Dist |
|---|---|---|---|---|---|---|---|---|
| 35 Halsey Rd Remsenburg, NY | 3.0 | 2.0 | 2345 | $10,000 | $4.26 | 0d | 1 | 0.30mi |
| 620 Dune Rd Westhampton Beach, NY | 3.0 | 2.0 | 2300 | $25,000 | $10.87 | 0d | 1 | 1.43mi |
| 70 Jagger Ln Westhampton, NY | 3.0 | 2.0 | 1850 | $20,000 | $10.81 | 0d | 1 | 1.44mi |
Listing history 4 events
-
2026-06-21days on market $1,950,000 Active 5 DOM
-
2026-06-18days on market $1,950,000 Active 2 DOM
-
2026-06-16remarks 699-char remark
-
2026-06-16$1,950,000 Active 1 DOM
ⓘ Source: listings_history table (triggers on properties + properties_extension) + one-shot
backfill from property_details.listing_events for pre-trigger history.
Tax reassessment forecast NY · Partial reset (capped growth)
- Current annual tax
- $7,472 · $623/mo
- Projected year-2 tax
- $20,213 · $1,684/mo
- Expected delta
- +$12,742/yr (+$1,062/mo · 170.5%)
ⓘ Screening estimate from a state-policy table — verify with the county assessor before closing.
Climate risk First Street
- Flood 7/10 Severe FEMA zone AE · 93% chance over 30 yrs
- Wildfire 1/10 Low
- Heat 4/10 Moderate 7 d/yr ≥90°F today · 18 d/yr by 30 yrs out
- Wind 8/10 Severe 80% chance of damaging wind over 30 yrs
- Air quality 4/10 Moderate 4 unhealthy d/yr today · 5 by 30 yrs out
Nearby sold comps map
Loading sold comps map…
Walkable amenities ~0.75 mi
Loading nearby amenities…
Taxation est. · year 1
- Rental income
- $165,860
- − Mortgage interest
- −$109,230
- − Property taxes
- −$7,472
- − Insurance
- −$14,868
- − Repairs & maintenance
- −$13,269
- − Management
- −$13,269
- − Depreciation
- −$56,727
- Taxable loss
- −$48,975
- Est. tax savings @ 24.0%
- +$11,754
- After-tax cash flow
- $-2,268/yr
For passive investors: Depreciation is non-cash, so a rental often shows a tax loss while cash-flowing — sheltering income. Rental losses are passive: they offset passive income freely, and up to $25,000/yr can offset ordinary (W-2) income if you actively participate and your MAGI is under $100k (phasing out to $0 by $150k); unused losses carry forward. On sale, claimed depreciation is recaptured at up to 25%, and gains may owe capital-gains tax (a 1031 exchange can defer both). Figures are a year-1 estimate at your 24.0% rate — not tax advice; consult a CPA.
Schools (NCES district)
- District
- Remsenburg-Speonk Union Free School District
- NCES district ID
- 3624420
- Math proficiency
- 60% ▲ 10.00%
- Reading proficiency
- 40% ▼ -10.00%
- Median HH income
- $79,972
- Composite
- 47.7/100
- National rank
- #4915
- State rank
- #389 of 755 in NY
Livability — Remsenburg-Speonk
No livability data for this city. (Only ~50 U.S. cities are tracked.)
Census & demographics
- Census place
- Remsenburg-Speonk, NY
- City population
- 1,346
- Population (ZIP)
- 1,037
Population outlook (Suffolk County) Hauer SSP2
- Today (2025)
- 1,505,262 people
- By 2030
- 1,498,318 · -0.5%
- By 2040
- 1,471,101 · -2.3%
- By 2050
- 1,424,848 · -5.3%
- By 2075
- 1,337,157 · -11.2%
- By 2100
- 1,217,720 · -19.1%
Race, ethnicity, and origin ACS 2023
- Neighborhood character
- Predominantly White (100%)
- Race & ethnicity
- White 100%
- Common ancestry
- Iranian 9% Romanian 8% Scotch-Irish 1%
- Foreign-born
- 3%
Political lean MEDSL · Suffolk
- 2024 margin
- Lean R (+10.0) · D 45.0% · R 55.0%
- 2008→2024 swing
- -16.0pp toward R · 2008: 6.0pp · 2024: -10.0pp
- All cycles
- 2024: R+10.0 2020: R+0.0 2016: R+8.2 2012: D+2.9 2008: D+6.0
Not yet ingested
- Civics
- —
Market trends
- HPI YoY
- ▲ 7.81%
- Current HPI
- 386.454
- Rent YoY
- —
- Metro
- —
- State GDP YoY
- ▲ 2.60%
- F500 in state
- 92
Industry mix (Fortune 500 HQ in NY)
| Industry | F500 HQs | Revenue |
|---|---|---|
| Financial Services | 10 | $950B |
|
||
| Consumer Goods | 9 | $162B |
|
||
| Insurance | 4 | $225B |
|
||
| Telecommunications | 2 | $144B |
|
||
| Pharmaceuticals | 2 | $112B |
|
||
| Media / Entertainment | 2 | $69B |
|
||
Price history
+200.5% since first listed8 events — show timeline
- 2026-06-04 Listed $1,950,000 OneKey® MLS as Distributed by MLS Grid
- 2025-09-03 Price Changed $1,995,000 OneKey® MLS as Distributed by MLS Grid
- 2025-08-02 Price Changed $2,095,000 OneKey® MLS as Distributed by MLS Grid
- 2025-05-13 Listed $2,295,000 OneKey® MLS as Distributed by MLS Grid
- 2013-04-02 Listing Removed — OneKey® MLS as Distributed by MLS Grid
- 2012-10-05 Listed $649,000 OneKey® MLS as Distributed by MLS Grid
- 2012-09-30 Listing Removed — OneKey® MLS as Distributed by MLS Grid
- 2012-01-28 Listed $649,000 OneKey® MLS as Distributed by MLS Grid
Property tax history
+7.8%/yrLatest (2022): $7,472 · +0.0% YoY. Source: county tax records.
Cash-flow waterfall
monthlySold comps — $/sqft
last 12 mo · ≤1 miLoading sold comps…