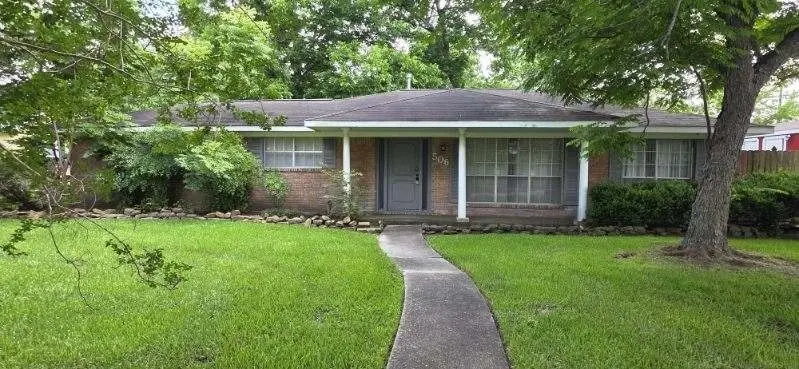
506 Kernohan St · Crosby, TX
Flood risk 1/10 · Minimal
- FEMA flood zone
- X (shaded)
- Chance of flooding over 30 yrs
- 0.0%
- Est. flood insurance / yr
- $507 – $1,088
Fire risk 2/10 · Minimal
- Est. fire insurance / yr
- $1,222 – $2,270
Heat risk 9/10 · Severe
- Hot days now (above 110°F)
- 7 days/yr
- Hot days in 30 yrs
- 23 days/yr
Wind risk 9/10 · Severe
- Chance of severe wind over 30 yrs
- 99.0%
Air-quality risk 2/10 · Minimal
- Unhealthy air days now
- 2 days/yr
- Unhealthy air days in 30 yrs
- 2 days/yr
Risk factors via First Street. Map © Google.
Why this score? — see what drove the C+ grade
The composite is a weighted blend of 9 inputs, each scored 0–100. Each bar is that input's sub-score; the figure is the points it added to the 100-point composite (weight × sub-score).
- Cash flow +23.4/30.0
- ARV discount +15.0/15.0
- DSCR +7.5/10.0
- 1% rule +7.1/10.0
- Schools +3.5/10.0
- Livability +3.0/5.0
- Rent growth +2.9/5.0
- Condition / age +2.5/5.0
- Appreciation +0.0/10.0
$169,000
🖨 Deal sheet (PDF) 📄 Offer letter ✓ Due diligence
Key facts
- 0.3 acre lot
- Garage
- Built 1967
Property features AI
Finance
- Other: Seller disclosure available
Exterior
- Parking: Detached garage (1 car)
- Utilities: Public water; Public sewer; Electric service
- Home design: Residential property; Single-story (entry level not specified); Originally built in 1967
- Construction: Brick and wood siding exterior; Composition roof; Slab foundation
- Exterior features: Lot includes other notable features
Interior
- Kitchen: Electric oven; Electric range
- Bedrooms: Total of 6 rooms (bedroom count not specified)
- Bathrooms: 1 full bathroom
- Interior features: Ceiling fan(s); Ventilation for improved indoor air quality
- Laundry & utility: Washer hookup; Electric dryer hookup
Neighborhood map
What this means for you Summary
Snapshot
- This is a 3-bed/2.0-bath single-family listed at $169k.
Deal economics
- At list price, monthly cash flow is $313 ($4k/yr) — positive.
- The deal already cash-flows at list — no discount required.
- Meets the 1% rule at list price ($2k rent vs $169k).
- Recommended offer: $166k (1.5% below list) — sets the bar for market timing.
- Cap rate 8.5% vs local median 4.8% in Crosby — top-decile yield for the area; either an underpriced asset or a hidden risk that comps aren't pricing in. Stress-test before assuming the spread holds.
Location & tenants
- Location reads 59/100 on livability (#1,121 in TX) — a working-class tenant base; expect higher turnover. Strengths: cost of living A+, crime A, housing A; Watch: amenities F, commute F, employment F.
- Crosby ISD (rural): math 39% / reading 40% proficiency, ranked #369 of 826 in TX (top 45%) — families likely to look elsewhere, expect single-tenant / working-renter base with shorter leases.
- Zoned schools: Crosby Middle (math 36% / reading 37%, grade F, #786 of 1,662 statewide, top 48%, 1,549 students, 60% FRL); Highpoint School East (Crosby) (20 students, 80% FRL) — zoned schools average 70% FRL vs 50% district-wide (20 pts higher); higher-poverty schools than district average — tighter screening recommended.
- Market conditions: Rents rising (+1.5%/yr); 1188 active listings in the ZIP; 3 comparable units currently listed for rent nearby; rentals at typical pace (median 14d on market — plan ~3-4 weeks tenant-placement turnaround); solid renter incomes; 29,883 units permitted in Harris County in 2024 (8,621 in 5+ unit buildings).
Forward outlook
- Local home prices are declining (-3.0%/yr); year-one equity from $1k of loan paydown is wiped out by about $5k of value loss. Plan a longer hold.
- Harris County population projected at +47% by 2050 — long-run rental-demand tailwind backs the buy-and-hold thesis.
Negotiation context
- It's been on market 16 days — a 2% lower offer ($166k) is reasonable based on typical stale-listing flexibility.
Risks & watch-outs
- Climate carrying-cost: severe wind risk, 99% chance of damaging wind over 30y; extreme-heat days projected 7→23/yr by 2055 (HVAC capex compounding) — expect insurance premiums to compound above CPI over the hold.
Questions for the listing agent
- Built in 1967 — when were the roof, HVAC, electrical panel, plumbing, and water heater last replaced?
- Is there a deadline driving the sale (1031 exchange, divorce, estate, relocation)? That informs how much negotiation room exists.
- Schools are D-rated, which usually means shorter tenancies and higher turnover. Who's the typical renter profile here, and what's been the actual vacancy rate?
- What's the average days-on-market for RENTAL listings here right now (not sales)? A rising rental-DOM trend means longer vacancies and softer asking-rent achievability than the comps imply.
- What's the recent tenant-quality profile in this submarket — average credit score on applications, eviction rate, late-payment / NSF rate, and stable-employment percentage? A property-management company in the area should have these aggregated.
- How much new for-sale + rental construction is in the pipeline within 1–3 miles? Heavy new supply typically softens prices + rents 12–24 months out; constrained supply supports both.
Investment metrics
- 1% rule
- 1.21% ✓
- Cap rate
- 8.52%
- Cash-on-cash
- 7.94%
- DSCR
- 1.35
- GRM
- 6.9
CMA / ARV
- ARV (on-the-fly)
- $261,355
- Comps found
- 12
Show comp detail 12 sales within ~0.75 mi
| Address | Dist | Beds/Ba | Sqft | Sold | Price | $/sf | Match |
|---|---|---|---|---|---|---|---|
| 17311 Thor Well Ln | 0.12mi | 3/2.0 | 1,496 (-4%) | 3mo | $239,900 | $160 | 85 |
| 707 Amberwood Creek Dr | 0.12mi | 3/2.0 | 1,484 (-5%) | 2mo | $268,990 | $181 | 84 |
| 17314 Roxboro Ridge Ln | 0.12mi | 3/2.0 | 1,484 (-5%) | 3mo | $270,990 | $183 | 84 |
| 17315 Glacier Forest Ln | 0.12mi | 3/2.0 | 1,484 (-5%) | 3mo | $268,990 | $181 | 83 |
| 2547 Cactus Ranch Ln | 0.39mi | 3/2.0 | 1,562 (-0%) | 5mo | $249,840 | $160 | 78 |
| 17318 Roxboro Ridge Ln | 0.12mi | 4/2.0 (+1) | 1,676 (+7%) | 1mo | $279,990 | $167 | 77 |
| 17323 Glacier Forest Ln | 0.12mi | 4/2.0 (+1) | 1,676 (+7%) | 3mo | $279,990 | $167 | 75 |
| 17334 Roxboro Ridge Ln | 0.12mi | 4/2.0 (+1) | 1,676 (+7%) | 4mo | $281,990 | $168 | 74 |
| 17327 Glacier Forest Ln | 0.12mi | 4/2.0 (+1) | 1,760 (+12%) | 3mo | $284,990 | $162 | 66 |
| 17227 Boulder Beach Dr | 0.12mi | 4/2.0 (+1) | 1,777 (+14%) | 1mo | $249,020 | $140 | 66 |
| 17318 Glacier Forest Ln | 0.12mi | 4/2.0 (+1) | 1,760 (+12%) | 4mo | $284,990 | $162 | 65 |
| 6318 Borage St | 0.60mi | 3/2.0 | 1,457 (-7%) | 1mo | $249,999 | $172 | 60 |
Match score weights: distance 35% · size 25% · config 20% · recency 20%. Top-matched comps best support the ARV.
Projected returns pro-forma
-3.0% appreciation · 1.48% rent growth · sell at horizon
- IRR
- -6.0%
- Equity multiple
- 0.78×
- Total profit
- $-10,410
- Equity at exit
- $25,198
- IRR
- 1.5%
- Equity multiple
- 1.10×
- Total profit
- $4,798
- Equity at exit
- $14,612
Cash invested: $47,320 (down + closing). Projections, not guarantees.
Landlord ↔ Tenant lean methodology
- Overall (STATE)
- 87 Strongly Landlord-Friendly
- State Texas
- 87 Strongly Landlord-Friendly · R+5
- County
- — inherits STATE
- City
- — inherits STATE
ZIP-level market 77532
- Home prices YoY
- -28.6%
- Rents YoY
- 1.5%
- Active inventory
- 1188
- Price-to-rent
- 6.9×
Monthly cashflow live
- Estimated rent
- $2,051 medium interval (Pro) →
- Mortgage (P&I)
- −$886
- Tax from tax record
- −$350 /mo · $4,201/yr
- Insurance
- −$70
- HOA
- −$0
- Vacancy / Maint / Mgmt
- −$431
- Net cashflow
- $313
Break-even live
Sensitivity live
| Price | -10% $409 | -5% $361 | +0% $313 | +5% $265 | +10% $218 |
|---|---|---|---|---|---|
| Rent | -10% $151 | -5% $232 | +0% $313 | +5% $394 | +10% $475 |
| Rate | -1.0pp $398 | -0.5pp $356 | base $313 | +0.5pp $269 | +1.0pp $225 |
UW: 25.0% down · 7.5% · 30yr · 1.5% tax · 5.0% vac · 8.0% maint · 8.0% mgmt
Financing live
Cash to close
- Down payment
- $42,250
- Closing costs
- $5,070
- Reserves months
- —
- Total cash needed
- —
Loan-product check · same deal, 3 products live
Conventional
25% down · 7.5% · 30yr
- Down + closing
- —
- Monthly P&I
- —
- Monthly cashflow
- —
- DSCR
- —
- Eligible?
- —
Personal DTI + credit; lowest rate.
DSCR
20% down · 8.5% · 30yr
- Down + closing
- —
- Monthly P&I
- —
- Monthly cashflow
- —
- DSCR
- —
- Eligible?
- —
No personal income docs; deal must DSCR.
Hard money
10% down · 12.0% · 12mo
- Down + closing
- —
- Monthly P&I
- —
- Monthly cashflow
- —
- DSCR
- —
- Eligible?
- —
Short-term bridge; refi at stabilization.
Rent comps 3 comps
| Address | Beds | Baths | Sqft | Rent | $/sqft | DOM | Units | Dist |
|---|---|---|---|---|---|---|---|---|
| 15722 E Astern Dr Crosby, TX | 3.0 | 2.0 | 1996 | $1,896 | $0.95 | 14d | 1 | 1.02mi |
| 711 Equinox St Crosby, TX | 3.0 | 2.0 | 1802 | $1,881 | $1.04 | 44d | 1 | 1.22mi |
| 430 Fishhawk Way Crosby, TX | 3.0 | 2.0 | 1369 | $1,783 | $1.30 | 0d | 1 | 1.35mi |
Listing history 11 events
-
2026-06-17days on market $169,000 Pending 16 DOM
-
2026-06-16days on market $169,000 Pending 15 DOM
-
2026-06-15status $169,000 Pending 14 DOM
-
2026-06-15days on market $169,000 Active 14 DOM
-
2026-06-13days on market $169,000 Active 12 DOM
-
2026-06-09days on market $169,000 Active 8 DOM
-
2026-06-08days on market $169,000 Active 7 DOM
-
2026-06-07days on market $169,000 Active 6 DOM
-
2026-06-04days on market $169,000 Active 3 DOM
-
2026-06-03days on market $169,000 Active 2 DOM
-
2026-06-01$169,000 Active 1 DOM
ⓘ Source: listings_history table (triggers on properties + properties_extension) + one-shot
backfill from property_details.listing_events for pre-trigger history.
Tax reassessment forecast TX · Resets to sale price
- Current annual tax
- $4,201 · $350/mo
- Projected year-2 tax
- $4,201 · $350/mo
- Expected delta
- $0/yr ($0/mo · 0.0%)
ⓘ Screening estimate from a state-policy table — verify with the county assessor before closing.
Climate risk First Street
- Flood 1/10 Low FEMA zone X (shaded) · 0% chance over 30 yrs
- Wildfire 2/10 Low
- Heat 9/10 Extreme 7 d/yr ≥110°F today · 23 d/yr by 30 yrs out
- Wind 9/10 Extreme 99% chance of damaging wind over 30 yrs
- Air quality 2/10 Low 2 unhealthy d/yr today · 2 by 30 yrs out
Nearby sold comps map
Loading sold comps map…
Walkable amenities ~0.75 mi
Loading nearby amenities…
Taxation est. · year 1
- Rental income
- $24,607
- − Mortgage interest
- −$9,467
- − Property taxes
- −$4,201
- − Insurance
- −$845
- − Repairs & maintenance
- −$1,969
- − Management
- −$1,969
- − Depreciation
- −$4,916
- Taxable income
- $1,241
- Est. tax owed @ 24.0%
- −$298
- After-tax cash flow
- $3,461/yr
For passive investors: Depreciation is non-cash, so a rental often shows a tax loss while cash-flowing — sheltering income. Rental losses are passive: they offset passive income freely, and up to $25,000/yr can offset ordinary (W-2) income if you actively participate and your MAGI is under $100k (phasing out to $0 by $150k); unused losses carry forward. On sale, claimed depreciation is recaptured at up to 25%, and gains may owe capital-gains tax (a 1031 exchange can defer both). Figures are a year-1 estimate at your 24.0% rate — not tax advice; consult a CPA.
Schools (NCES district)
- District
- Crosby ISD
- NCES district ID
- 4815750
- Math proficiency
- 39% ▼ -13.00%
- Reading proficiency
- 40% ▼ -5.00%
- Median HH income
- $61,079
- Composite
- 35.14/100
- National rank
- #5012
- State rank
- #369 of 826 in TX
Livability — Crosby
- Score
- 59/100
- State rank
- #1121
- US rank
- #19783
Category grades
Schools grade is shown separately in the Schools card above.
Census & demographics
- Census place
- Crosby, TX
- County
- Harris County · 4,702,590 people
- City population
- 33,780
- Metro
- Houston-The Woodlands-Sugar Land, TX
- Population (ZIP)
- 33,780
- Household income
- $92,201
- Rent vs Own
- Severe rent burden
- 382.0
Population outlook (Harris County) Hauer SSP2
- Today (2025)
- 5,571,493 people
- By 2030
- 6,089,821 · +9.3%
- By 2040
- 7,142,806 · +28.2%
- By 2050
- 8,185,864 · +46.9%
- By 2075
- 10,574,329 · +89.8%
- By 2100
- 12,109,958 · +117.4%
Race, ethnicity, and origin ACS 2023
- Neighborhood character
- Diverse neighborhood (Simpson 0.60)
- Race & ethnicity
- White 54% Hispanic / Latino 31% Two or more races 16% Black 9%
- Hispanic origin (detail)
- Mexican 24%
- Common ancestry
- Lithuanian 4% Romanian 3% Italian 2%
- Foreign-born
- 10% · Canada
- Languages at home
- 78% English-only · Spanish 21%
Political lean MEDSL · Harris
- 2024 margin
- Lean D (+5.5) · D 52.0% · R 46.4% · Other 1.6%
- 2008→2024 swing
- +3.9pp toward D · 2008: 1.6pp · 2024: 5.5pp
- All cycles
- 2024: D+5.5 2020: D+13.3 2016: D+12.4 2012: D+0.1 2008: D+1.6
Not yet ingested
- Civics
- —
Market trends
- HPI YoY
- ▼ -105.63%
- Current HPI
- 264.0126
- Rent YoY
- ▲ 1.48%
- Metro
- Houston-The Woodlands-Sugar Land, TX
- State GDP YoY
- ▲ 3.95%
- F500 in state
- 110
Industry mix (Fortune 500 HQ in TX)
| Industry | F500 HQs | Revenue |
|---|---|---|
| Energy | 16 | $1,198B |
|
||
| Technology | 5 | $198B |
|
||
| Engineering / Construction | 4 | $72B |
|
||
| Energy Services | 3 | $60B |
|
||
| Utilities | 3 | $41B |
|
||
| Healthcare | 2 | $330B |
|
||
Price history
2 events — show timeline
- 2026-06-01 Listed $169,000 HARMLS
- 1988-01-02 Sold (Public Records) — Public Records
Property tax history
+2.0%/yrLatest (2025): $4,201 · +8.8% YoY. Source: county tax records.
Cash-flow waterfall
monthlySold comps — $/sqft
last 12 mo · ≤1 miLoading sold comps…