 🏗️ New Construction
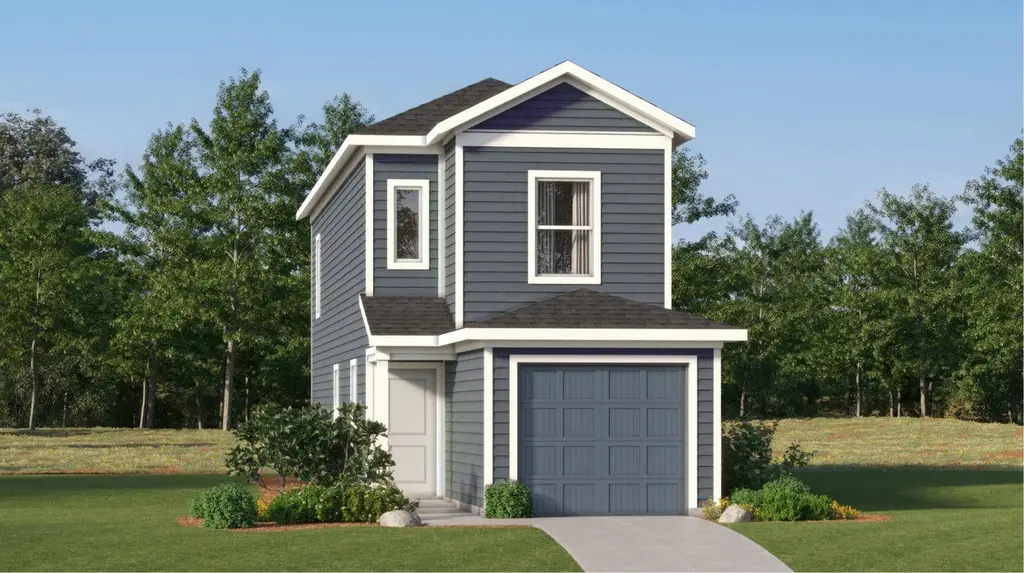
Pima Plan · Deerwood, TX
Flood risk No data
- FEMA flood zone
- —
- Chance of flooding over 30 yrs
- —
- Est. flood insurance / yr
- —
Fire risk No data
- Est. fire insurance / yr
- —
Heat risk No data
- Hot days now (above threshold)
- —
- Hot days in 30 yrs
- —
Wind risk No data
- Chance of severe wind over 30 yrs
- —
Air-quality risk No data
- Unhealthy air days now
- —
- Unhealthy air days in 30 yrs
- —
Risk factors via First Street. Map © Google.
Why this score? — see what drove the C- grade
The composite is a weighted blend of 9 inputs, each scored 0–100. Each bar is that input's sub-score; the figure is the points it added to the 100-point composite (weight × sub-score).
- Cash flow +19.5/30.0
- ARV discount +7.5/15.0
- DSCR +6.2/10.0
- 1% rule +5.2/10.0
- Schools +5.1/10.0
- Condition / age +4.0/5.0
- Rent growth +2.5/5.0
- Livability +2.5/5.0
- Appreciation +0.0/10.0
$178,990
🖨 Deal sheet 📄 Offer letter ✓ Due diligence
Listing remarks MLS
The first floor of this two-story home is host to a spacious open floorplan that seamlessly connects an inviting family room, elegant dining room and chef-inspired kitchen. Upstairs, there are three bedrooms, including the luxe owner's suite, which features a restful bedroom, en-suite bathroom and generous walk-in closet.
Key facts
- Open floorplan
- Family room
- Dining room
Tags
Neighborhood map
What this means for you Summary
Snapshot
- This is a 3-bed/2.5-bath single-family listed at $179k. Condition is rated good.
Deal economics
- At list price, monthly cash flow is $213 ($3k/yr) — positive.
- The deal already cash-flows at list — no discount required.
- Meets the 1% rule at list price ($2k rent vs $179k).
- Recommended offer: $163k (9.0% below list) — sets the bar for market timing.
- Cap rate 7.7% vs local median 5.4% in Deerwood — top-decile yield for the area; either an underpriced asset or a hidden risk that comps aren't pricing in. Stress-test before assuming the spread holds.
Location & tenants
- Location reads: area grade C — affects rentability + tenant quality, not the cash-flow math above.
- Conroe ISD (other): math 57% / reading 57% proficiency, ranked #69 of 826 in TX (top 8%) — acceptable for families but not a draw, mixed tenant base, ~2y average lease.
- Market conditions: 414 active listings in the ZIP; 2 comparable units currently listed for rent nearby; solid renter incomes; 13,259 units permitted in Montgomery County in 2024 (1,402 in 5+ unit buildings).
Forward outlook
- Local home prices are declining (-3.0%/yr); year-one equity from $1k of loan paydown is wiped out by about $6k of value loss. Plan a longer hold.
- Montgomery County population projected at +65% by 2050 — long-run rental-demand tailwind backs the buy-and-hold thesis.
Negotiation context
- It's been on market 119 days — a 9% lower offer ($163k) is reasonable based on typical stale-listing flexibility.
Questions for the listing agent
- It's been on market 119 days. Have you received any prior offers? Is the seller open to a 9% concession, seller financing, or rate buy-down credit?
- Why hasn't it sold? Are there any deal-killer items the seller is aware of (foundation, flood, title, zoning, code violations)?
- Is there a deadline driving the sale (1031 exchange, divorce, estate, relocation)? That informs how much negotiation room exists.
- What's the average days-on-market for RENTAL listings here right now (not sales)? A rising rental-DOM trend means longer vacancies and softer asking-rent achievability than the comps imply.
- What's the recent tenant-quality profile in this submarket — average credit score on applications, eviction rate, late-payment / NSF rate, and stable-employment percentage? A property-management company in the area should have these aggregated.
- How much new for-sale + rental construction is in the pipeline within 1–3 miles? Heavy new supply typically softens prices + rents 12–24 months out; constrained supply supports both.
Investment metrics
- 1% rule
- 1.02% ✓
- Cap rate
- 7.66%
- Cash-on-cash
- 4.88%
- DSCR
- 1.22
- GRM
- 8.2
CMA / ARV
- ARV (median comp)
- $186,990
- List price
- $178,990
- Delta
- -4.28%
- Verdict
- FAIR
- Comps
- 20 within 1.0 mi
Show comp detail 12 sales within ~0.75 mi
| Address | Dist | Beds/Ba | Sqft | Sold | Price | $/sf | Match |
|---|---|---|---|---|---|---|---|
| 3602 Duplet Ave | 0.02mi | 3/2.0 | 1,360 (0%) | 1mo | $188,990 | $139 | 96 |
| 17143 Saxophone Ln | 0.02mi | 3/2.0 | 1,360 (0%) | 2mo | $189,990 | $140 | 96 |
| 17135 Saxophone Ln | 0.22mi | 3/2.0 | 1,360 (0%) | 1mo | $188,990 | $139 | 87 |
| 17107 Saxophone Ln | 0.03mi | 3/2.5 | 1,189 (-13%) | 1mo | $184,990 | $156 | 77 |
| 17131 Saxophone Ln | 0.02mi | 3/2.5 | 1,189 (-13%) | 2mo | $183,990 | $155 | 77 |
| 17115 Saxophone Ln | 0.02mi | 3/2.5 | 1,189 (-13%) | 2mo | $183,990 | $155 | 77 |
| 17127 Saxophone Ln | 0.02mi | 4/2.5 (+1) | 1,535 (+13%) | 0mo | $195,990 | $128 | 72 |
| 17119 Saxophone Ln | 0.08mi | 4/2.5 (+1) | 1,535 (+13%) | 1mo | $194,990 | $127 | 69 |
| 3862 Highline Oaks W | 0.59mi | 3/2.0 | 1,370 (+1%) | 0mo | $319,990 | $234 | 69 |
| 17840 Lionheart Rd | 0.60mi | 3/2.0 | 1,388 (+2%) | 3mo | $224,900 | $162 | 64 |
| 17678 Cedar Crest Dr | 0.74mi | 3/2.5 | 1,384 (+2%) | 6mo | $215,000 | $155 | 58 |
| 17836 Lionheart Rd | 0.59mi | 4/2.0 (+1) | 1,521 (+12%) | 6mo | $249,900 | $164 | 41 |
Match score weights: distance 35% · size 25% · config 20% · recency 20%. Top-matched comps best support the ARV.
Projected returns pro-forma
-3.0% appreciation · 3.0% rent growth · sell at horizon
- IRR
- -8.7%
- Equity multiple
- 0.68×
- Total profit
- $-16,709
- Equity at exit
- $27,881
- IRR
- 0.8%
- Equity multiple
- 1.06×
- Total profit
- $3,031
- Equity at exit
- $16,167
Cash invested: $52,357 (down + closing). Projections, not guarantees.
Landlord ↔ Tenant lean methodology
- Overall (STATE)
- 87 Strongly Landlord-Friendly
- State Texas
- 87 Strongly Landlord-Friendly · R+5
- County
- — inherits STATE
- City
- — inherits STATE
ZIP-level market 77306
- Home prices YoY
- -4.1%
- Active inventory
- 414
- Price-to-rent
- 7.8×
Monthly cashflow live
- Estimated rent
- $1,905 medium interval (Pro) →
- Mortgage (P&I)
- −$981
- Tax est. 1.5%
- −$234 /mo · $2,805/yr
- Insurance
- −$78
- HOA
- −$0
- Vacancy / Maint / Mgmt
- −$400
- Net cashflow
- $213
Break-even live
UW: 25.0% down · 7.5% · 30yr · 1.5% tax · 5.0% vac · 8.0% maint · 8.0% mgmt
Financing live
Cash to close
- Down payment
- $46,748
- Closing costs
- $5,610
- Reserves months
- —
- Total cash needed
- —
Loan-product check · same deal, 3 products live
Conventional
25% down · 7.5% · 30yr
- Down + closing
- —
- Monthly P&I
- —
- Monthly cashflow
- —
- DSCR
- —
- Eligible?
- —
Personal DTI + credit; lowest rate.
DSCR
20% down · 8.5% · 30yr
- Down + closing
- —
- Monthly P&I
- —
- Monthly cashflow
- —
- DSCR
- —
- Eligible?
- —
No personal income docs; deal must DSCR.
Hard money
10% down · 12.0% · 12mo
- Down + closing
- —
- Monthly P&I
- —
- Monthly cashflow
- —
- DSCR
- —
- Eligible?
- —
Short-term bridge; refi at stabilization.
Rent comps 2 comps
| Address | Beds | Baths | Sqft | Rent | $/sqft | DOM | Units | Dist |
|---|---|---|---|---|---|---|---|---|
| 6621 W Forest Rd Conroe, TX | 3.0 | 2.0 | 952 | $1,450 | $1.52 | 43d | 1 | 0.67mi |
| 2140 Cedar Bend Dr Conroe, TX | 4.0 | 3.0 | 1871 | $1,995 | $1.07 | 10d | 1 | 0.77mi |
Listing history 15 events
-
2026-06-18days on market $178,990 Active 119 DOM
-
2026-06-17days on market $178,990 Active 118 DOM
-
2026-06-16days on market $178,990 Active 117 DOM
-
2026-06-15days on market $178,990 Active 116 DOM
-
2026-06-13days on market $178,990 Active 114 DOM
-
2026-06-10price $178,990 Active 110 DOM
-
2026-06-09days on market $185,990 Active 110 DOM
-
2026-06-08days on market $185,990 Active 109 DOM
-
2026-06-07days on market $185,990 Active 108 DOM
-
2026-06-04days on market $185,990 Active 105 DOM
-
2026-06-03days on market $185,990 Active 104 DOM
-
2026-06-02days on market $185,990 Active 103 DOM
-
2026-06-01days on market $185,990 Active 102 DOM
-
2026-05-31days on market $185,990 Active 101 DOM
-
2026-02-19$185,990 Active 323-char remark
Show marketing remark (323 chars)
The first floor of this two-story home is host to a spacious open floorplan that seamlessly connects an inviting family room, elegant dining room and chef-inspired kitchen. Upstairs, there are three bedrooms, including the luxe owner's suite, which features a restful bedroom, en-suite bathroom and generous walk-in closet.
ⓘ Source: listings_history table (triggers on properties + properties_extension) + one-shot
backfill from property_details.listing_events for pre-trigger history.
Nearby sold comps map
Loading sold comps map…
Walkable amenities ~0.75 mi
Loading nearby amenities…
Taxation est. · year 1
- Rental income
- $22,864
- − Mortgage interest
- −$10,474
- − Property taxes
- −$2,805
- − Insurance
- −$935
- − Repairs & maintenance
- −$1,829
- − Management
- −$1,829
- − Depreciation
- −$5,440
- Taxable loss
- −$448
- Est. tax savings @ 24.0%
- +$108
- After-tax cash flow
- $2,663/yr
For passive investors: Depreciation is non-cash, so a rental often shows a tax loss while cash-flowing — sheltering income. Rental losses are passive: they offset passive income freely, and up to $25,000/yr can offset ordinary (W-2) income if you actively participate and your MAGI is under $100k (phasing out to $0 by $150k); unused losses carry forward. On sale, claimed depreciation is recaptured at up to 25%, and gains may owe capital-gains tax (a 1031 exchange can defer both). Figures are a year-1 estimate at your 24.0% rate — not tax advice; consult a CPA.
Condition & rehab AI · 12 photos
This two-story home features a spacious open floorplan with modern finishes and a well-maintained exterior. It is in good condition and ready for minor updates to enhance its resale and rental value.
Value-add opportunities
- Both Painting the exterior and interior walls — Fresh paint can enhance curb appeal and interior aesthetics.
- Resale Updating the kitchen backsplash — A backsplash can add visual interest and functionality to the kitchen.
- Both Adding smart home features — Smart home features can increase convenience and appeal to potential buyers/renters.
- Resale Upgrading the flooring in the bathrooms — Updated flooring can make bathrooms more appealing and functional.
- Rental Adding a smart thermostat — A smart thermostat can help manage energy costs and attract renters who value energy efficiency.
Renovation cost estimate screening
Value-add ROI direction
- Both Painting the exterior and interior walls — Fresh paint can enhance curb appeal and interior aesthetics. ↑
- Resale Updating the kitchen backsplash — A backsplash can add visual interest and functionality to the kitchen. ↑
- Both Adding smart home features — Smart home features can increase convenience and appeal to potential buyers/renters. ↑
- Resale Upgrading the flooring in the bathrooms — Updated flooring can make bathrooms more appealing and functional. ↑
- Rental Adding a smart thermostat — A smart thermostat can help manage energy costs and attract renters who value energy efficiency. ↑
ⓘ Cost ranges are severity-bucket heuristics (US national rule-of-thumb). Get contractor quotes + a written scope before underwriting a rehab budget.
Schools (NCES district)
- District
- Conroe ISD
- NCES district ID
- 4815000
- Math proficiency
- 57% ▼ -6.00%
- Reading proficiency
- 57% ▼ -1.00%
- Median HH income
- $71,541
- Composite
- 50.65/100
- National rank
- #1833
- State rank
- #69 of 826 in TX
Livability — Deerwood
No livability data for this city. (Only ~50 U.S. cities are tracked.)
Census & demographics
- County
- Montgomery County · 663,713 people
- Metro
- Houston-The Woodlands-Sugar Land, TX
- Population (ZIP)
- 18,086
- Household income
- $76,257
- Rent vs Own
- Severe rent burden
- 231.0
Population outlook (Montgomery County) Hauer SSP2
- Today (2025)
- 713,896 people
- By 2030
- 805,263 · +12.8%
- By 2040
- 992,708 · +39.1%
- By 2050
- 1,179,590 · +65.2%
- By 2075
- 1,628,084 · +128.1%
- By 2100
- 1,937,880 · +171.5%
Race, ethnicity, and origin ACS 2023
- Neighborhood character
- Majority Hispanic (55%)
- Race & ethnicity
- Hispanic / Latino 55% White 41% Two or more races 11% Black 2%
- Hispanic origin (detail)
- Mexican 51%
- Common ancestry
- Iranian 1% Slovak 1% Lithuanian 1%
- Foreign-born
- 21% · Canada
- Languages at home
- 53% English-only · Spanish 45% German/W. Germanic 1%
Political lean MEDSL · Montgomery
- 2024 margin
- Solid R (+45.5) · D 26.8% · R 72.3%
- 2008→2024 swing
- +7.2pp toward D · 2008: -52.7pp · 2024: -45.5pp
- All cycles
- 2024: R+45.5 2020: R+43.8 2016: R+51.4 2012: R+60.7 2008: R+52.7
Not yet ingested
- Civics
- —
Market trends
- HPI YoY
- ▼ -13.02%
- Current HPI
- 306.3801
- Rent YoY
- —
- Metro
- Houston-The Woodlands-Sugar Land, TX
- State GDP YoY
- ▲ 3.95%
- F500 in state
- 110
Industry mix (Fortune 500 HQ in TX)
| Industry | F500 HQs | Revenue |
|---|---|---|
| Energy | 16 | $1,198B |
|
||
| Technology | 5 | $198B |
|
||
| Engineering / Construction | 4 | $72B |
|
||
| Energy Services | 3 | $60B |
|
||
| Utilities | 3 | $41B |
|
||
| Healthcare | 2 | $330B |
|
||
Price history
1 event — show timeline
- 2026-02-19 Listed $185,990 Zillow
Cash-flow waterfall
monthlySold comps — $/sqft
last 12 mo · ≤1 miLoading sold comps…