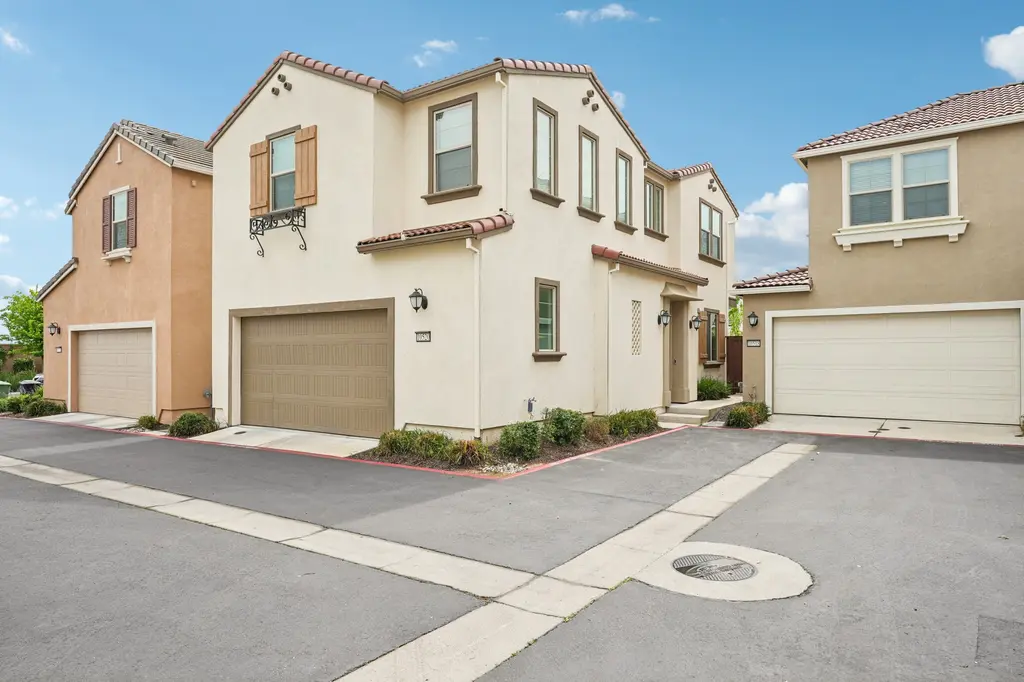
10520 Oboe Way · Elk Grove, CA
Flood risk 1/10 · Minimal
- FEMA flood zone
- X (unshaded)
- Chance of flooding over 30 yrs
- 0.0%
- Est. flood insurance / yr
- $507 – $1,088
Fire risk 5/10 · Moderate
- Est. fire insurance / yr
- $659 – $1,223
Heat risk 7/10 · Major
- Hot days now (above 102°F)
- 7 days/yr
- Hot days in 30 yrs
- 15 days/yr
Wind risk 1/10 · Minimal
- Chance of severe wind over 30 yrs
- —
Air-quality risk 10/10 · Severe
- Unhealthy air days now
- 25 days/yr
- Unhealthy air days in 30 yrs
- 27 days/yr
Risk factors via First Street. Map © Google.
Why this score? — see what drove the D grade
The composite is a weighted blend of 9 inputs, each scored 0–100. Each bar is that input's sub-score; the figure is the points it added to the 100-point composite (weight × sub-score).
- ARV discount +11.1/15.0
- Appreciation +10.0/10.0
- Cash flow +5.0/30.0
- Schools +4.1/10.0
- Rent growth +3.6/5.0
- Livability +3.6/5.0
- Condition / age +2.5/5.0
- 1% rule +1.2/10.0
- DSCR +0.0/10.0
$499,000
🖨 Deal sheet (PDF) 📄 Offer letter ✓ Due diligence
Listing remarks
Step into this like-new, beautifully maintained 3-bedroom, 2.5-bath home in Elk Grove's sought-after Sterling Meadows community. Offering 1,632 sq ft of thoughtfully designed living space, this home features a bright open-concept floor plan and owned solar for added efficiency and savings. The stylish kitchen shines with granite countertops, rich maple cabinetry, and stainless steel appliancesperfect for everyday living and effortless entertaining. Upstairs, retreat to a spacious primary suite complete with stone counters, dual sinks, and a generous walk-in closet. Ideally situated near shopping, Sky River Casino, parks, and convenient freeway access, and located within the highly regarded
Key facts
- 1,760 sq ft lot
- 2 garage spots
- Built 2022
Neighborhood map
What this means for you Summary
Snapshot
- This is a 3-bed/2.5-bath single-family listed at $499k.
Deal economics
- At list price, monthly cash flow is $-1k ($-14k/yr) — negative.
- To cash-flow at today's rent, offer at most $293k (41.3% below list).
- To meet the 1% rule (rent ≥ 1% of price), the offer needs to be $307k (38.5% below list).
- Recommended offer: $293k (41.3% below list) — sets the bar for cash-flow.
- Cap rate 3.5% vs local median 2.8% in Elk Grove — meaningfully above typical; check what's discounted (condition, days-on-market, listing class) to confirm the premium yield is real.
Location & tenants
- Location reads 71/100 on livability (#212 in CA) — a middle-class / working-renter tenant base. Strengths: employment A+, housing A+, crime B+; Watch: commute F, cost of living F.
- Elk Grove Unified (suburban): math 40% / reading 51% proficiency, ranked #165 of 517 in CA (top 32%) — families likely to look elsewhere, expect single-tenant / working-renter base with shorter leases.
- Zoned schools: Franklin Elementary (math 45% / reading 60%, grade C-, #350 of 1,571 statewide, top 22%, 894 students, 38% FRL); Elizabeth Pinkerton Middle (math 53% / reading 70%, grade B+, #52 of 498 statewide, top 11%, 982 students, 29% FRL); Cosumnes Oaks High (math 58% / reading 73%, grade B, #157 of 1,170 statewide, top 14%, 2,212 students, 31% FRL).
- Zoned-school proficiency averages 60% at this address vs 46% district-wide (+14 pts) — the actual schools serving this property are materially stronger than the Elk Grove Unified average implies; a family-tenant draw the district grade alone would hide.
- Market conditions: Rents rising fast (+4.5%/yr); 297 active listings in the ZIP; 10 comparable units currently listed for rent nearby; rentals leasing fast (median 10d on market — plan ~1-2 weeks tenant-placement turnaround); high-income renter base; 6,825 units permitted in Sacramento County in 2024 (1,752 in 5+ unit buildings).
Forward outlook
- In year one you build about $53k of equity ($3k loan paydown + $50k appreciation (10.0% local appreciation)).
- Sacramento County population projected at +17% by 2050 — long-run rental-demand tailwind backs the buy-and-hold thesis.
- By year 2, paydown + projected appreciation supports a ~$86k cash-out refi (75% LTV) — recoverable capital for the next deal without selling this one.
Negotiation context
- It's been on market 41 days — a 3% lower offer ($484k) is reasonable based on typical stale-listing flexibility.
Risks & watch-outs
- Climate carrying-cost: moderate wildfire risk; extreme-heat days projected 7→15/yr by 2055 (HVAC capex compounding) — expect insurance premiums to compound above CPI over the hold.
Questions for the listing agent
- What do current leases actually rent for vs. the listed asking? Can we see a recent rent roll and the last 12 months of T-12 income?
- It's been on market 41 days. Have you received any prior offers? Is the seller open to a 41% concession, seller financing, or rate buy-down credit?
- What does the HOA fee cover, when was the last increase, and are there any pending special assessments or reserve-fund shortfalls?
- Is there a deadline driving the sale (1031 exchange, divorce, estate, relocation)? That informs how much negotiation room exists.
- Schools are B-rated — typically a magnet for longer-tenancy family renters. What's the average tenant stay here, and is there a school-zone premium baked into asking?
- The area grade is low — what's the realistic commute time and amenity access for the typical tenant pool here? Any planned neighborhood developments (good or bad) we should know about?
- What's the average days-on-market for RENTAL listings here right now (not sales)? A rising rental-DOM trend means longer vacancies and softer asking-rent achievability than the comps imply.
- What's the recent tenant-quality profile in this submarket — average credit score on applications, eviction rate, late-payment / NSF rate, and stable-employment percentage? A property-management company in the area should have these aggregated.
- How much new for-sale + rental construction is in the pipeline within 1–3 miles? Heavy new supply typically softens prices + rents 12–24 months out; constrained supply supports both.
Investment metrics
- 1% rule
- 0.62% ✗
- Cap rate
- 3.49%
- Cash-on-cash
- -10.02%
- DSCR
- 0.55
- GRM
- 13.5
CMA / ARV
- ARV (median comp)
- $542,752
- List price
- $499,000
- Delta
- -8.06%
- Verdict
- FAIR
- Comps
- 20 within 1.0 mi
Show comp detail 12 sales within ~0.75 mi
| Address | Dist | Beds/Ba | Sqft | Sold | Price | $/sf | Match |
|---|---|---|---|---|---|---|---|
| 10520 Oboe Way | 0.00mi | 3/2.5 | 1,632 (0%) | 0mo | $500,000 | $306 | 100 |
| 10502 Oboe Way | 0.03mi | 3/2.5 | 1,632 (0%) | 5mo | $505,000 | $309 | 95 |
| 10545 Tenor Way | 0.09mi | 3/2.5 | 1,632 (0%) | 4mo | $500,000 | $306 | 92 |
| 10569 Tenor Way | 0.12mi | 3/2.5 | 1,632 (0%) | 3mo | $505,000 | $309 | 92 |
| 8851 Solo Way | 0.28mi | 3/2.5 | 1,632 (0%) | 3mo | $524,800 | $322 | 85 |
| 10517 Etude Way | 0.09mi | 3/2.5 | 1,454 (-11%) | 2mo | $577,000 | $397 | 76 |
| 8830 Encore Way | 0.15mi | 3/2.5 | 1,454 (-11%) | 4mo | $570,000 | $392 | 71 |
| 10349 Charles Morris Way | 0.65mi | 3/2.0 | 1,603 (-2%) | 2mo | $625,000 | $390 | 63 |
| 10352 Charles Morris Way | 0.64mi | 3/2.0 | 1,603 (-2%) | 3mo | $605,000 | $377 | 62 |
| 10367 Evangaline Way | 0.72mi | 2/2.0 (-1) | 1,644 (+1%) | 0mo | $592,500 | $360 | 58 |
| 10352 Evangaline Way | 0.68mi | 2/2.0 (-1) | 1,644 (+1%) | 5mo | $555,000 | $338 | 56 |
| 10360 Evangaline Way | 0.70mi | 2/2.0 (-1) | 1,644 (+1%) | 5mo | $549,000 | $334 | 55 |
Match score weights: distance 35% · size 25% · config 20% · recency 20%. Top-matched comps best support the ARV.
Projected returns pro-forma
10.0% appreciation · 4.54% rent growth · sell at horizon
- IRR
- 17.6%
- Equity multiple
- 2.45×
- Total profit
- $202,391
- Equity at exit
- $449,539
- IRR
- 16.9%
- Equity multiple
- 5.76×
- Total profit
- $665,168
- Equity at exit
- $969,447
Cash invested: $139,720 (down + closing). Projections, not guarantees.
Landlord ↔ Tenant lean methodology
- Overall (STATE)
- 18 Strongly Tenant-Friendly
- State California
- 18 Strongly Tenant-Friendly · D+13
- County
- — inherits STATE
- City
- — inherits STATE
ZIP-level market 95757
- Home prices YoY
- 13.5%
- Rents YoY
- 4.5%
- Active inventory
- 297
- Price-to-rent
- 13.5×
Monthly cashflow live
- Estimated rent
- $3,069 high interval (Pro) →
- Mortgage (P&I)
- −$2,617
- Tax from tax record
- −$673 /mo · $8,078/yr
- Insurance
- −$208
- HOA
- −$94
- Vacancy / Maint / Mgmt
- −$645
- Net cashflow
- $-1,167
Break-even live
Sensitivity live
| Price | -10% $-885 | -5% $-1,026 | +0% $-1,167 | +5% $-1,308 | +10% $-1,450 |
|---|---|---|---|---|---|
| Rent | -10% $-1,410 | -5% $-1,288 | +0% $-1,167 | +5% $-1,046 | +10% $-925 |
| Rate | -1.0pp $-916 | -0.5pp $-1,040 | base $-1,167 | +0.5pp $-1,297 | +1.0pp $-1,428 |
UW: 25.0% down · 7.5% · 30yr · 1.5% tax · 5.0% vac · 8.0% maint · 8.0% mgmt
Financing live
Cash to close
- Down payment
- $124,750
- Closing costs
- $14,970
- Reserves months
- —
- Total cash needed
- —
Loan-product check · same deal, 3 products live
Conventional
25% down · 7.5% · 30yr
- Down + closing
- —
- Monthly P&I
- —
- Monthly cashflow
- —
- DSCR
- —
- Eligible?
- —
Personal DTI + credit; lowest rate.
DSCR
20% down · 8.5% · 30yr
- Down + closing
- —
- Monthly P&I
- —
- Monthly cashflow
- —
- DSCR
- —
- Eligible?
- —
No personal income docs; deal must DSCR.
Hard money
10% down · 12.0% · 12mo
- Down + closing
- —
- Monthly P&I
- —
- Monthly cashflow
- —
- DSCR
- —
- Eligible?
- —
Short-term bridge; refi at stabilization.
Rent comps 10 comps
| Address | Beds | Baths | Sqft | Rent | $/sqft | DOM | Units | Dist |
|---|---|---|---|---|---|---|---|---|
| 10568 Trill Way Elk Grove, CA | 3.0 | 2.5 | 1815 | $2,900 | $1.60 | 4d | 1 | 0.09mi |
| 10568 Trill Way Elk Grove, CA | 3.0 | 2.5 | 1815 | $2,900 | $1.60 | 0d | 1 | 0.09mi |
| 10191 Gatemont Cir Elk Grove, CA | 3.0 | 2.5 | 1800 | $2,800 | $1.56 | 25d | 1 | 0.78mi |
| 10087 Emerald Grove Dr Elk Grove, CA | 3.0 | 2.0 | 1354 | $2,575 | $1.90 | 45d | 1 | 1.02mi |
| 8376 Solfrid Way Elk Grove, CA | 4.0 | 3.0 | 2070 | $3,200 | $1.55 | 19d | 1 | 1.11mi |
| 8357 Eleodoro Way Elk Grove, CA | 3.0 | 2.5 | 1730 | $3,245 | $1.88 | 4d | 1 | 1.13mi |
| 8357 Luan Way Elk Grove, CA | 3.0 | 2.0 | 1967 | $2,895 | $1.47 | 22d | 1 | 1.21mi |
| 10114 Elise Way Elk Grove, CA | 4.0 | 3.0 | 2214 | $2,995 | $1.35 | 9d | 1 | 1.45mi |
| 10110 Elise Way Elk Grove, CA | 3.0 | 2.5 | 1628 | $3,300 | $2.03 | 9d | 1 | 1.46mi |
| 8371 Valpane Way Elk Grove, CA | 4.0 | 3.0 | 2018 | $3,250 | $1.61 | 0d | 1 | 1.47mi |
HOA detail
- Monthly dues
- $94 · $1,128/yr
Tax reassessment forecast CA · Resets to sale price
- Current annual tax
- $8,078 · $673/mo
- Projected year-2 tax
- $8,078 · $673/mo
- Expected delta
- $0/yr ($0/mo · 0.0%)
ⓘ Screening estimate from a state-policy table — verify with the county assessor before closing.
Climate risk First Street
- Flood 1/10 Low FEMA zone X (unshaded) · 0% chance over 30 yrs
- Wildfire 5/10 Major
- Heat 7/10 Severe 7 d/yr ≥102°F today · 15 d/yr by 30 yrs out
- Wind 1/10 Low
- Air quality 10/10 Extreme 25 unhealthy d/yr today · 27 by 30 yrs out
Nearby sold comps map
Loading sold comps map…
Walkable amenities ~0.75 mi
Loading nearby amenities…
Taxation est. · year 1
- Rental income
- $36,830
- − Mortgage interest
- −$27,952
- − Property taxes
- −$8,078
- − Insurance
- −$2,495
- − Repairs & maintenance
- −$2,946
- − Management
- −$2,946
- − HOA
- −$1,128
- − Depreciation
- −$14,516
- Taxable loss
- −$23,231
- Est. tax savings @ 24.0%
- +$5,576
- After-tax cash flow
- $-8,431/yr
For passive investors: Depreciation is non-cash, so a rental often shows a tax loss while cash-flowing — sheltering income. Rental losses are passive: they offset passive income freely, and up to $25,000/yr can offset ordinary (W-2) income if you actively participate and your MAGI is under $100k (phasing out to $0 by $150k); unused losses carry forward. On sale, claimed depreciation is recaptured at up to 25%, and gains may owe capital-gains tax (a 1031 exchange can defer both). Figures are a year-1 estimate at your 24.0% rate — not tax advice; consult a CPA.
Schools (NCES district)
- District
- Elk Grove Unified
- NCES district ID
- 0612330
- Math proficiency
- 40% ▼ -5.00%
- Reading proficiency
- 51% ▼ -5.00%
- Median HH income
- $67,860
- Composite
- 40.72/100
- National rank
- #3658
- State rank
- #165 of 517 in CA
Livability — Elk Grove
- Score
- 71/100
- State rank
- #212
- US rank
- #6681
Category grades
Schools grade is shown separately in the Schools card above.
Census & demographics
- Census place
- Elk Grove, CA
- County
- Sacramento County · 1,539,646 people
- City population
- 190,119
- Metro
- Sacramento-Roseville-Folsom, CA
- Population (ZIP)
- 56,764
- Household income
- $138,198
- Rent vs Own
- Severe rent burden
- 1121.0
Population outlook (Sacramento County) Hauer SSP2
- Today (2025)
- 1,660,763 people
- By 2030
- 1,732,990 · +4.3%
- By 2040
- 1,855,755 · +11.7%
- By 2050
- 1,941,335 · +16.9%
- By 2075
- 2,046,162 · +23.2%
- By 2100
- 1,961,444 · +18.1%
Race, ethnicity, and origin ACS 2023
- Neighborhood character
- Highly diverse neighborhood (Simpson 0.75)
- Race & ethnicity
- Asian 40% White 21% Hispanic / Latino 18% Two or more races 14% Black 11% Pacific Islander 1%
- Hispanic origin (detail)
- Mexican 14%
- Common ancestry
- Russian 1% Italian 1% Portuguese 1%
- Foreign-born
- 28% · China, Canada, Vietnam
- Languages at home
- 62% English-only · Spanish 8% Other Indo-European 7% Chinese 7%
Political lean MEDSL · Sacramento
- 2024 margin
- D (+19.7) · D 58.1% · R 38.4% · Other 3.5%
- 2008→2024 swing
- +0.7pp no change · 2008: 19.0pp · 2024: 19.7pp
- All cycles
- 2024: D+19.7 2020: D+25.3 2016: D+23.7 2012: D+16.3 2008: D+19.0
Not yet ingested
- Civics
- —
Market trends
- HPI YoY
- ▲ 39.15%
- Current HPI
- 328.5885
- Rent YoY
- ▲ 4.54%
- Metro
- Sacramento-Roseville-Folsom, CA
- State GDP YoY
- ▲ 3.21%
- F500 in state
- 116
Industry mix (Fortune 500 HQ in CA)
| Industry | F500 HQs | Revenue |
|---|---|---|
| Technology | 27 | $1,492B |
|
||
| Financial Services | 3 | $174B |
|
||
| Retail | 3 | $44B |
|
||
| Insurance | 3 | $26B |
|
||
| Media / Entertainment | 2 | $115B |
|
||
| Pharmaceuticals / Biotech | 2 | $62B |
|
||
Property tax history
+28.7%/yrLatest (2025): $8,078 · +2.0% YoY. Source: county tax records.
Cash-flow waterfall
monthlySold comps — $/sqft
last 12 mo · ≤1 miLoading sold comps…